The early offseason landscape for 2020 fantasy football drafts is one dominated by running backs. The consensus top five picks in best-ball drafts (PPR) are running backs, and only three wide receivers crack the top 14 selections. With so many running backs coming off boards early, a sense of scarcity is forcing drafters to be even more aggressive in securing two in the first few rounds.
[Editor’s note: Subscribe to PFF ELITE today to gain access to PFF’s Premium Stats and new Player Grades experience in addition to the 2020 NFL Draft Guide, 2020 Fantasy Rookie Scouting Report, PFF Greenline, all of PFF’s premium article content and more.]
The thing is, when faced with individual choices between top wide receivers in drafts and the running backs drafted immediately before and after them, the public says it prefers the wide receiver.
In a vacuum (i.e. without thinking about draft strategy and how boards are currently falling into place), which player would you rather have on your fantasy team in 2020?
— Kevin Cole (@KevinCole___) June 4, 2020
I threaded a poll for every one of the top six wide receivers by average draft position (ADP), and they’re all preferred, by large margins, to the surrounding running backs. If you’re only thinking about the pick at hand and not the scarcity issue, the value equation changes drastically.
This disconnect between the valuations of players on an individual level and as part of an overall draft strategy leaves opportunity for those willing to fight against the tide. As Jack Miller of RotoViz recently explained, recency bias can create opportunities for those who look clearly at the situation.
If you know that wide receivers can provide early value, the ability to translate that value into a winning strategy still relies on filling the running back position with capable starters. Assuming you take undervalued wide receivers in the first two rounds of fantasy drafts, there will be roughly 14-15 running backs off the board before you have the chance to take one, according to ADP in recent FFPC best-ball drafts.
I looked at the historical performance of running backs selection after RB15, specifically 16 to 60, to find the most common traits found in those who break out and win leagues. I’m looking at 2010-19 fantasy drafts and defining a breakout player as one who didn’t have a top-15 PPR finish in any of the previous four seasons, but then finishes in the top-10. A similar analysis was recently put together by JJ Zachariason at numberFire, and I suggest you check out his conclusions — some shared by my analysis, some not.
WHAT DOES A BREAKOUT LOOK LIKE
Using PPR scoring over expectation, we find 24 running backs I’m calling “breakouts” who had positional ADPs between RB16 and RB60 and didn’t have a top-15 fantasy finish in any of the previous four years. We can compare those 24 breakouts to the entire pool of fantasy running backs to find meaningful differences.
Experience
| Experience | Candidates | Candidate % | Breakouts | Breakout % | Diff. |
| 1 | 58 | 15.7% | 4 | 16.7% | 1.0% |
| 2 | 73 | 19.7% | 6 | 25.0% | 5.3% |
| 3 | 57 | 15.4% | 7 | 29.2% | 13.8% |
| 4 | 37 | 10.0% | 1 | 4.2% | -5.8% |
| 5 | 37 | 10.0% | 3 | 12.5% | 2.5% |
| 6 | 36 | 9.7% | 0 | 0.0% | -9.7% |
| 7 | 22 | 5.9% | 2 | 8.3% | 2.4% |
| 8 | 13 | 3.5% | 0 | 0.0% | -3.5% |
| 9 | 12 | 3.2% | 0 | 0.0% | -3.2% |
| 10 | 12 | 3.2% | 1 | 4.2% | 1.0% |
The “candidate” numbers show all the players drafted from 2010 to 2019 who met the criteria for a player who hadn’t broken out, and then the breakout numbers show those who finally jumped into the top 10 in PPR scoring that year.
The vast majority of breakout candidates are in their first five NFL seasons (70.8%), and an even heavier concentration of those actually broke out (87.8%). But all the early years aren’t equal, with the most outperformance over baseline for third-year backs (+13.8%), followed by second-year backs (+5.3%). Rookies are slightly overrepresented among breakouts versus what you would expect based on the total drafted (+1.0%).
We aren’t dealing with the largest sample of 24 breakouts, but there does appear to be a sweet spot for running backs in Years 2 and 3 — especially the latter, as fantasy drafters have likely lost patience.
EXPECTED FANTASY POINTS
The key to this analysis is looking at the position ADP rankings for running backs in previous fantasy drafts, along with their underlying attributes, to find expected figures for different stats. These expected numbers are the best measure to judge actual performance.
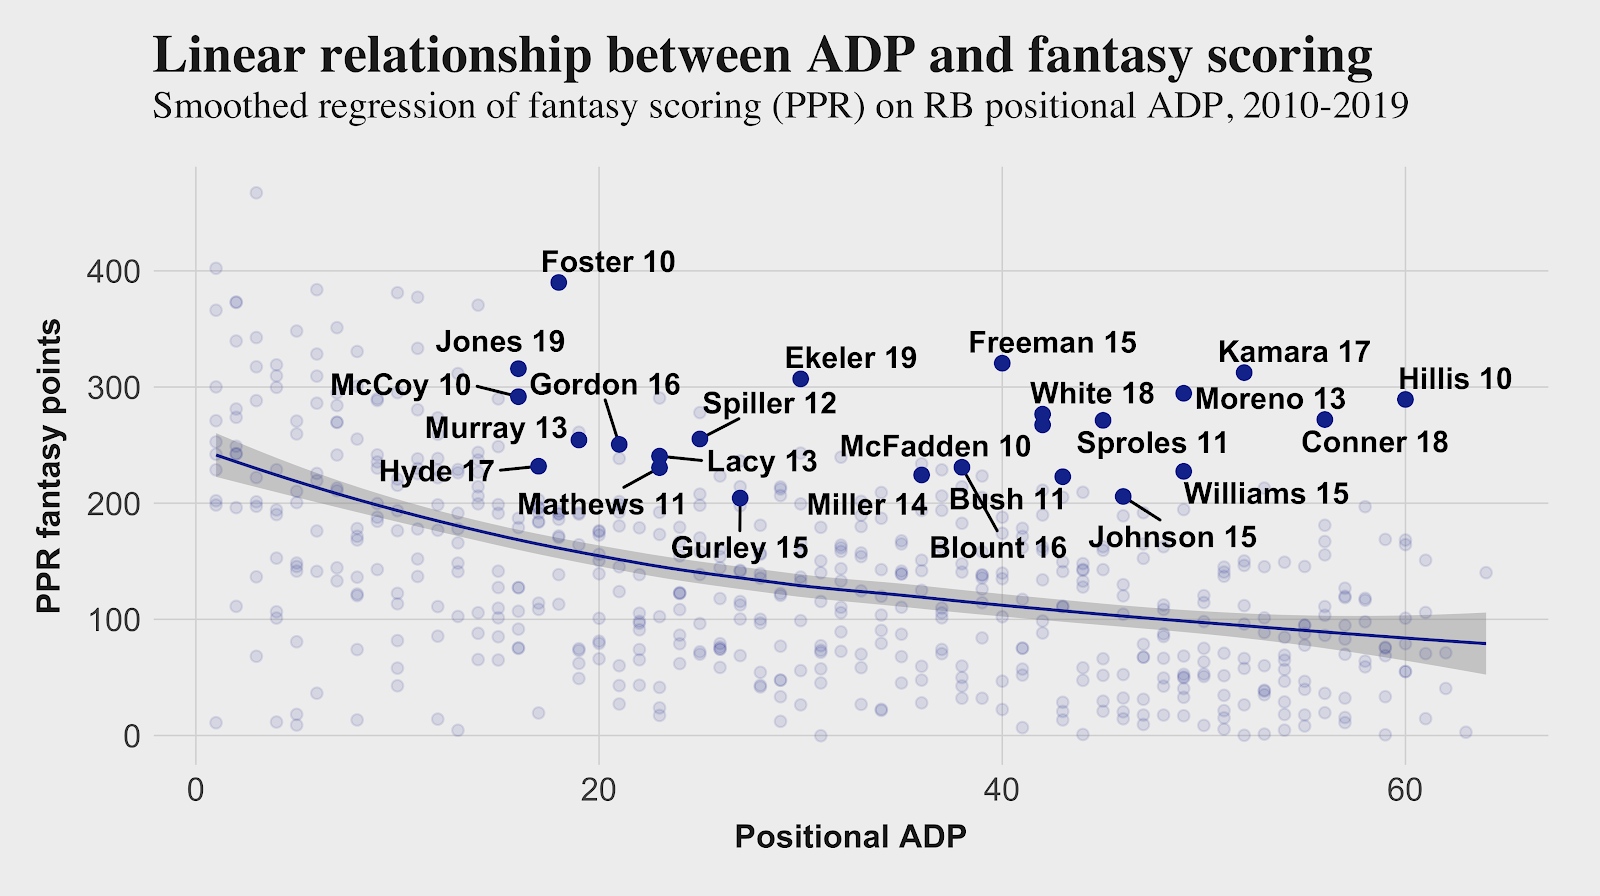
Above are the actual fantasy points in PPR scoring for running backs against their positional ADPs. If we use the smoothed regression line as the baseline for expected fantasy scoring, we can calculate the running backs who outperformed most in the context of where they were drafted. Highlighted are the running backs in our breakout sample, which shows how much more a later-round breakout needs to provide in value over ADP to hit a top-10 finish.
Looking at the top 15 breakouts by fantasy scoring over expectation, you can see the vast difference in outperformance, even among breakouts.
| Season | Player | Pos. ADP | Experience | PPR Finish | PPR Over Exp. |
| 2010 | Peyton Hillis | 60 | 3 | 3 | 225.7 |
| 2010 | Arian Foster | 18 | 2 | 1 | 222.5 |
| 2017 | Alvin Kamara | 52 | 1 | 3 | 212.3 |
| 2015 | Devonta Freeman | 40 | 2 | 1 | 204.4 |
| 2013 | Knowshon Moreno | 49 | 5 | 4 | 197.4 |
| 2018 | James Conner | 56 | 2 | 7 | 175.7 |
| 2011 | Darren Sproles | 45 | 7 | 5 | 172.0 |
| 2019 | Austin Ekeler | 30 | 3 | 4 | 164.3 |
| 2018 | James White | 42 | 5 | 6 | 162.4 |
| 2010 | Darren McFadden | 42 | 3 | 8 | 158.6 |
| 2015 | DeAngelo Williams | 49 | 10 | 6 | 124.3 |
| 2012 | C.J. Spiller | 25 | 3 | 6 | 121.9 |
| 2011 | Michael Bush | 43 | 5 | 9 | 119.1 |
| 2010 | LeSean McCoy | 16 | 2 | 2 | 117.0 |
| 2016 | LeGarrette Blount | 38 | 7 | 9 | 114.2 |
When we substitute the expected fantasy points generation into our experience analysis, the value of second- and third-year running backs is still evident, with rookies falling slightly to -1.0%.
| Experience | Candidates | Candidate % | PPR Over Exp. | PPROE % | Diff. |
| 1 | 58 | 15.7% | 496.9 | 14.7% | -1.0% |
| 2 | 73 | 19.7% | 914.6 | 27.1% | 7.4% |
| 3 | 57 | 15.4% | 1002.1 | 29.7% | 14.3% |
| 4 | 37 | 10.0% | 69.2 | 2.1% | -7.9% |
| 5 | 37 | 10.0% | 478.9 | 14.2% | 4.2% |
| 6 | 36 | 9.7% | 0.0 | 0.0% | -9.7% |
| 7 | 22 | 5.9% | 286.2 | 8.5% | 2.6% |
| 8 | 13 | 3.5% | 0.0 | 0.0% | -3.5% |
| 9 | 12 | 3.2% | 0.0 | 0.0% | -3.2% |
| 10 | 12 | 3.2% | 124.3 | 3.7% | 0.5% |
The outperformance of second-year backs rises to 7.4% to 5.3% when using PPR over expectation, and third-year backs move from 13.8% to 14.3%. No matter how you look at it, second- and third-year players are where the value lies.
Components
Knowing who the breakout running backs have been over the past 10 years, we can then compare their actual numbers to the expected numbers for different metrics, thereby more completely understanding how they broke out.
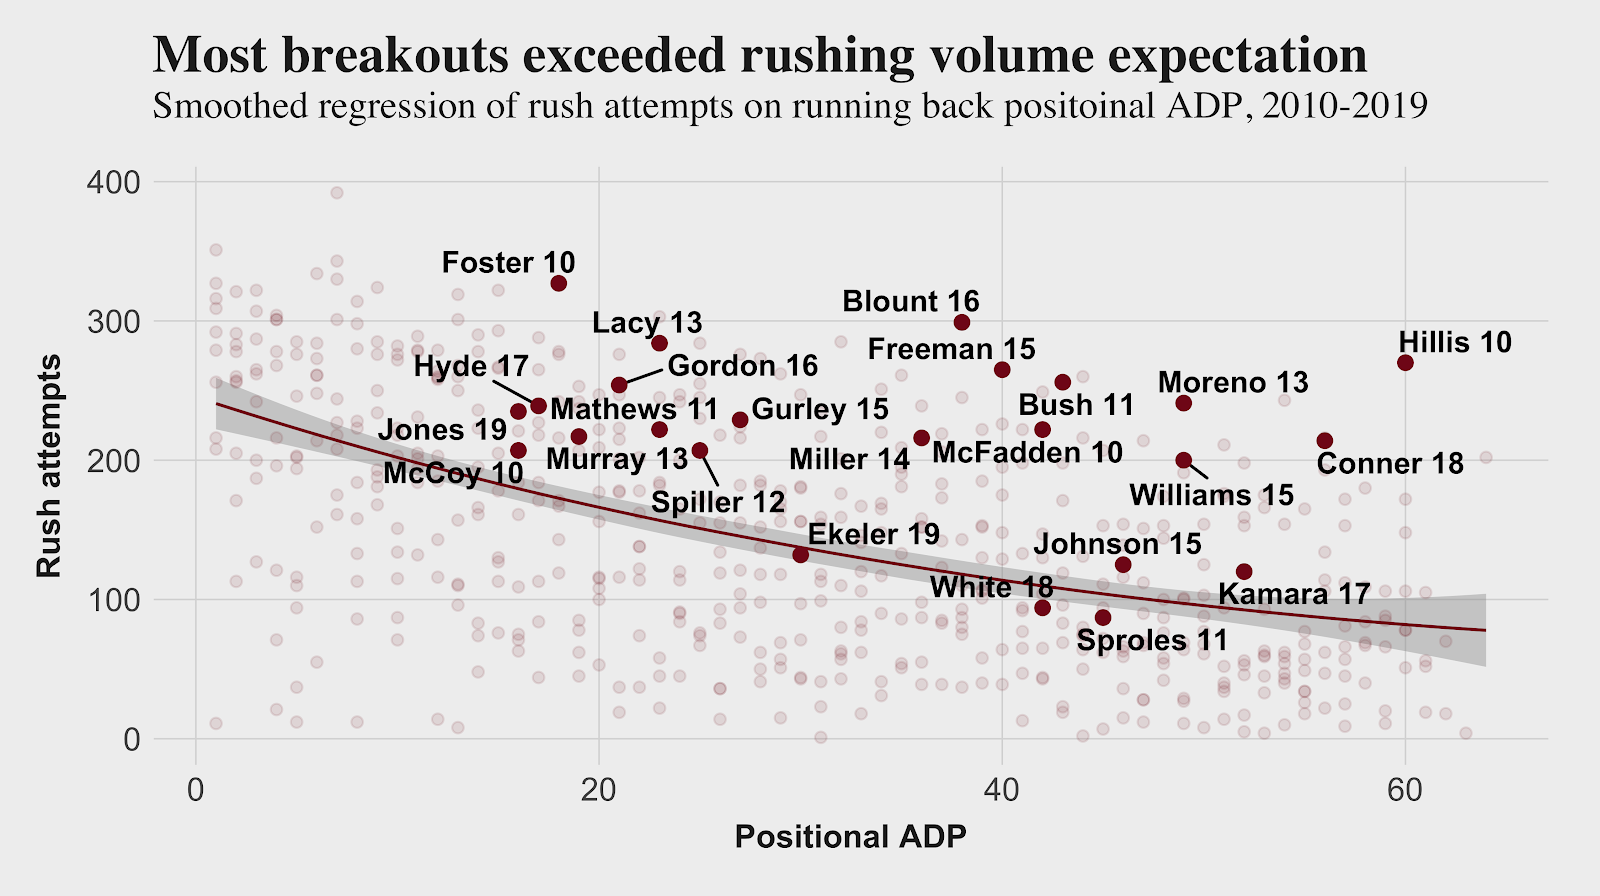
First looking at rushing attempts, you can see that nearly all of the breakouts exceeded the volume you would have expected based on their draft positions. But that hasn't always been the case. There are a number of breakouts I would classify as receiving backs who didn’t see significant rushing volume, such as Darren Sproles, James White, and Austin Ekeler. But there are also more complete backs, such as Alvin Kamara, David Johnson and LeSean McCoy, who broke out in spite of lower rushing volume.
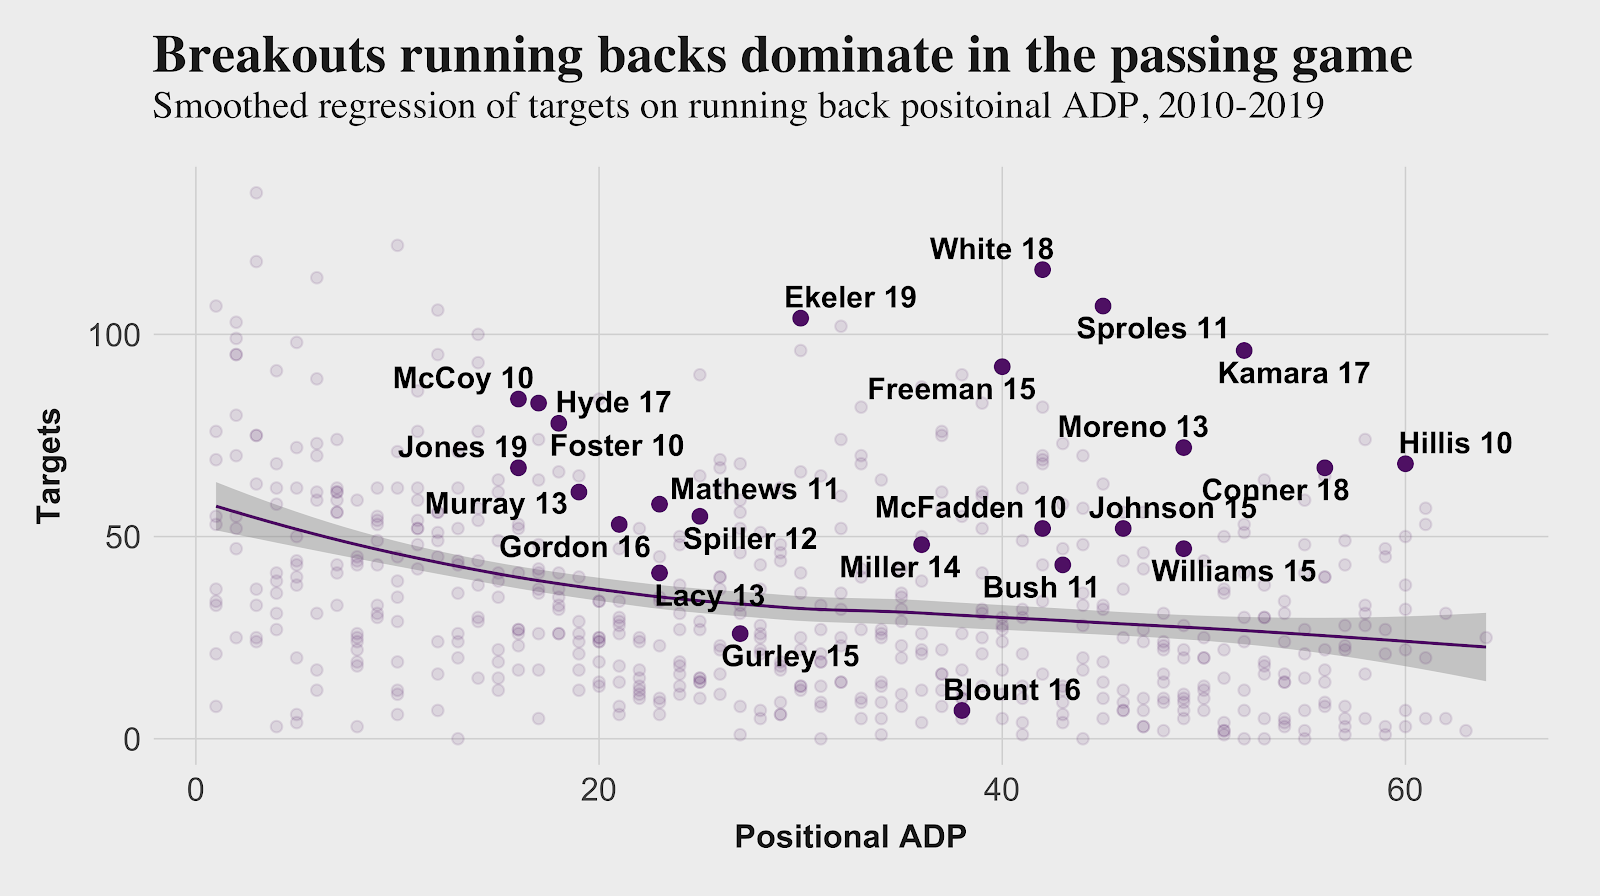
Looking at the performance of the breakout in receiving volume (targets) is where things get really interesting. Not only do almost all breakouts exceed their expected target volume, in many cases they destroy them. A running back can breakout with little receiving volume, but they need to do the extraordinary, like LeGarrette Blount scoring 18 rushing touchdowns in 2016 or Todd Gurley II relying on a string of long runs as a rookie in 2015.
Here is a breakdown of the average outperformance for breakouts in a number of volume and efficiency stats.
| Rush Att | Targets | YPC | YPT | Rush TD% | Rec TD% |
| 63.2% | 105.3% | 14.0% | 19.1% | 66.4% | 58.1% |
Breakouts outperform their ADP expectations in all volume and efficiency stats, but none more than targets. Yardage efficiency outperformance for carries and targets are the least important, and touchdowns matter in fantasy football, though they’re most difficult to forecast.
The best bet for finding a breakout running back in the middle of fantasy drafts this year is to find one who has a clear path to receiving volume. There is also likely value in second- and third-year backs, many of whom may have disappointed early in their careers but could outperform with similar volume.
In the next couple of weeks, I’m going to analyze the potential breakout running back for 2020, focusing specifically on the second- and third-year backs in the RB16 to RB50 range. This series will share some similarities with my breakout wide receiver series, by matching the candidates to past fantasy players according to college and NFL metrics.
