Last Friday, the Kansas City Chiefs acquired offensive tackle Orlando Brown Jr. from the Baltimore Ravens in a trade involving six draft picks. How did the teams value such a complicated deal? By using the “The Chart,” of course.
“The Chart” was first drawn by the Dallas Cowboys over 30 years ago. It was simply a one-line distillation of the draft-pick values implied by about 40 trades between 1987 and 1990. As coaches and scouts moved from the Cowboys to other teams, The Chart caught on and became the common currency for draft-pick trades. As Mike McCoy, the actual creator of The Chart, said in 2006, “For a rinky-dink concept, it has worked out pretty well.”
Indeed. But should a “rinky-dink concept” based on a few dozen trades in the late 1980s still be guiding trades in 2021? And what does it mean if it is?
View PFF's 2021 NFL Draft position rankings:
QB | RB | WR | TE | T | iOL | DI | EDGE | LB | CB | S
The overwhelming opinion of the analytics community is that the traditional trade chart values top draft picks too dearly compared to lower picks. This has been shown many times, using many methods, notably Massey-Thaler, Schuckers, Stuart, Burke, Hill, Lopez, Gertz, Riske and Fitzgerald-Spielberger. And though the magnitude of mispricing varies, the directional conclusion is always the same: The Chart is too steep.
One challenge with these analyses is their complexity. They involve equations and estimates and assumptions and layers — most decision-makers would have to trust the analyst, at some level of detail, in order to believe the results. Trust is hard to come by and reasonably withheld. Might there be a more straightforward way to evaluate The Chart?
Let us introduce The Fortune Teller’s Chart.
This chart is based on what actually happens in the future. It tells you how much the first pick is worth, relative to all other picks, if you were granted the best player in the draft. And we mean the best, not the player who is forecast to be the best. After playing for a few years and picking up a second contract (or not), what are they worth? This is a trade chart without uncertainty.
Consider the 2012 NFL Draft. We can measure the value of each player drafted using the salary-cap value in his fifth year, by which time he has reached free agency. The salary cap is an effective and transparent proxy for player value (and, as a practical matter, gives similar results to a player’s Approximate Value, a statistics-based measure created by Pro Football Reference).
By this measure, Andrew Luck was the best player in the 2012 draft, valued at $24.59 million per year. Russell Wilson ($21.9 million) was the second-best, Kirk Cousins ($19.95 million) was the third-best, and so on. This chart doesn’t care that Luck was drafted first, Wilson 75th and Cousins 102nd. Rather, this chart asks what you’d be willing to pay to trade positions in the draft if you knew for certain how the players would turn out.
We collect these data points for every year for which Over The Cap could provide salary cap information. This allows us to draw The Fortune Teller’s Chart for the 2011-2016 draft years, accounting for each draft for which every player’s rookie contract has expired (excluding fifth-year options) since the introduction of the new rookie wage scale (which reduced compensation at the top of the draft starting in 2011).
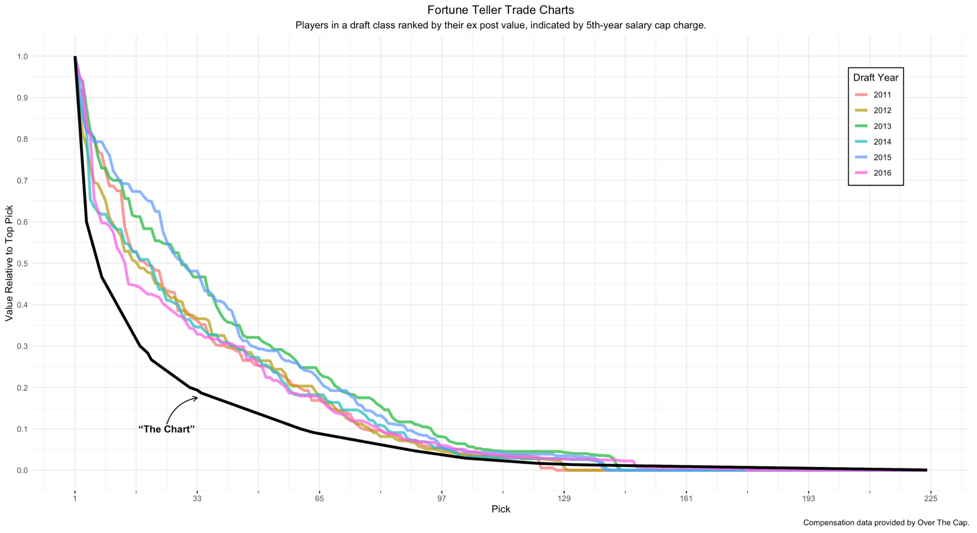
To evaluate steepness, consider the drop in value over the first round. The Chart values the 32nd pick at about 20% of the value of the first pick. In contrast, the Fortune Teller’s values for the 32nd pick range from 34% to 48%. There isn’t a single year that a Fortune Teller, with perfect foresight, would pay anywhere near the 5x premium for the first pick relative to the 32nd.
Because The Fortune Teller’s Chart has no uncertainty, it is by definition steeper than the “true” chart, whatever that is. It is impossible for a chart with uncertainty — a critical feature in a trade chart that values picks before they’re made — to be steeper than The Fortune Teller’s Chart. And, the more uncertainty, the flatter the real chart becomes. And yet, The Chart is steeper than the Fortune Teller’s chart every year we measure it.
Importantly, we are also setting aside compensation costs. This is a crazy thing to do, of course — the first pick of the first round costs about 3.5 times the last pick in the first round. A proper trade-value chart must account for the compensation due to the player. After all, this is a salary cap league and not English soccer.
Massey & Thaler’s chart incorporates compensation costs, as does PFF's Timo Riske’s. Both of those charts are upward sloping at the top of the draft, showing how dramatic the impact of compensation is. For simplicity, we ignore this factor, another reason our analysis is conservative.
So we’ve set aside uncertainty, which is significant and flattens the curve. We’ve set aside compensation, another sizable real-world consideration that flattens the curve. We’ve set aside opaque advanced statistics when measuring player value, relying instead on the market value of a player when he reaches free agency. And we haven’t even taken any averages, which can obscure extreme outcomes teams might care about. After all that, we still find The Chart to be too steep in every draft year for which we have compensation data.
This is the simplest and most conservative evaluation of The Chart possible. And the results could not be starker.
Given the degree of mispricing, are we certain teams still rely on the chart? Maybe the Chiefs-Ravens trade was an exception? According to Thomas Dimitroff, general manager of the Atlanta Falcons from 2008 to 2020, that is not the case. In a recent interview with PFF, Dimitroff said teams generally have their own revised version of a chart, but “it becomes obfuscated when you start talking about two different charts, and [so] we fall back to the traditional chart.”
Dimitroff’s comments give us an insight into The Chart’s staying power. It is the default option and a coordination device. It turns out a coordination device is vital, given that there are 32 teams, ambiguously valued assets, time pressure, public deals, and professional reputations. These factors create the perfect recipe for adherence to a norm, any norm. As McCoy said in 2006, “A standard list price protects you. Nobody gets skinned.”
In this way, it reminds us of fourth-down decisions in the NFL. One of the reasons coaches are reluctant to make more aggressive fourth-down decisions is that doing so flies in the face of conventional wisdom. When a coach fails following conventional wisdom, there is one less thing he can be blamed for. When he fails while flouting the norm, he is punished more harshly.
Now, fourth-down decisions are finally shifting in the NFL. Perhaps norms can change over time. At a minimum, this requires learning, and learning requires feedback. This fourth-down shift is arriving 19 years after David Romer’s paper identifying how biased fourth-down decision-making is. And that’s despite immediate, objective feedback after every fourth-down play. What hope do GMs have to learn their way out of suboptimal draft-pick prices when trade feedback is rarely tracked, delayed for years and often ambiguous anyway?
This is a difficult learning environment. And the need to coordinate provides both positive and negative incentives for using The Chart. There are also myriad psychological factors that push in the same direction, leading GMs, coaches and scouts to overvalue top picks. Historical statistics are a pallid counterweight to the vivid personal details that suggest a prospect will be a star. Those details matter, but they simply feel more important than they are.
Our point isn’t that The Chart is bad, as that is well established. Our point is how extraordinarily bad it is and, more importantly, how it has persisted for decades nonetheless. We (mostly) don’t mean this as an indictment. The psychological and organizational factors that create this bias are multiple and can be overwhelming. Mainly, we see it as an opportunity.
Years ago, at the dawn of the “Moneyball era,” one of us sat with Billy Beane and a small group of academics and writers in Arizona. The group quizzed Beane on what he thought would happen as other teams caught on to his approach. Beane said something like, “We’ve been picking free dollars off the ground. Those may eventually become quarters and then dimes, but we’ll still be picking them up.”
Beane was right on the money. Major League Baseball looks quite different now than it did then, and it is much sharper analytically, but Beane is still finding enough dimes to lead his underfunded Oakland A’s to an early spot at the top of their division.
In contrast, the draft-day dollars we first identified in 2005 are still dollars. The forces producing them are robust, and the countervailing forces diffuse. Our strong prediction is that The Chart has a long life in front of it yet. That means there is an opportunity for sharp teams, especially those with strong enough leadership, to flout conventional wisdom.
So pay attention. Deals like last week’s Chiefs-Ravens trade will only get more interesting as the draft heats up. A team’s attitude toward the edges available in the draft provides a glimpse into their attitude toward the many analytics-based edges available in other months of the year. Apparently, exploiting these edges is hard. If it were easy, we wouldn’t be having the same conversation after all these years.
More of PFF's 2021 NFL Draft tools here:
2021 NFL Draft Big Board | 2021 NFL Draft Guide | 2021 NFL Draft Stats Export | NFL Mock Drafts | NFL Mock Draft Simulator
