
Most of the draft analysis around the NFL focuses on understanding the draft from a micro perspective, i.e., which college prospects are the best, and how do we find out who is the best? While this is, of course, a crucial part of April's proceedings, an underappreciated part of the draft is the ability to understand it from a macro perspective, or, in other words, the ability to manage the draft as best as possible without knowing for sure about the future careers of NFL draft prospects.
The ability to understand the value of each pick is crucial for teams who want to maneuver the draft successfully. Draft value curves or tables (which simply assign a value to each single draft pick) have existed for a long time. The still-famous Jimmy Johnson draft trade value chart is the oldest, though this chart was mostly supposed to be a tool to balance out draft trades and didn’t really focus on the actual on-field value of draft picks. Chase Stuart’s draft chart fixed this problem by fitting his chart to historical draft success as measured by Pro Football Reference’s Approximate Value metric (AV). Jason Fitzgerald and Brad Spielberger from OverTheCap.com used a clever approach to create their own draft chart with salary data, and instead of evaluating draft success with performance metrics, they chose to let the NFL teams do the evaluation and measured draft success by financial value of the post-rookie contract.
While AV was the best measure of individual success just a few years ago, it still has some shortcomings (for instance, it can’t really evaluate offensive linemen separately from the quarterback). This is where PFF’s WAR metric comes to play and allows an even more nuanced look at draft value.
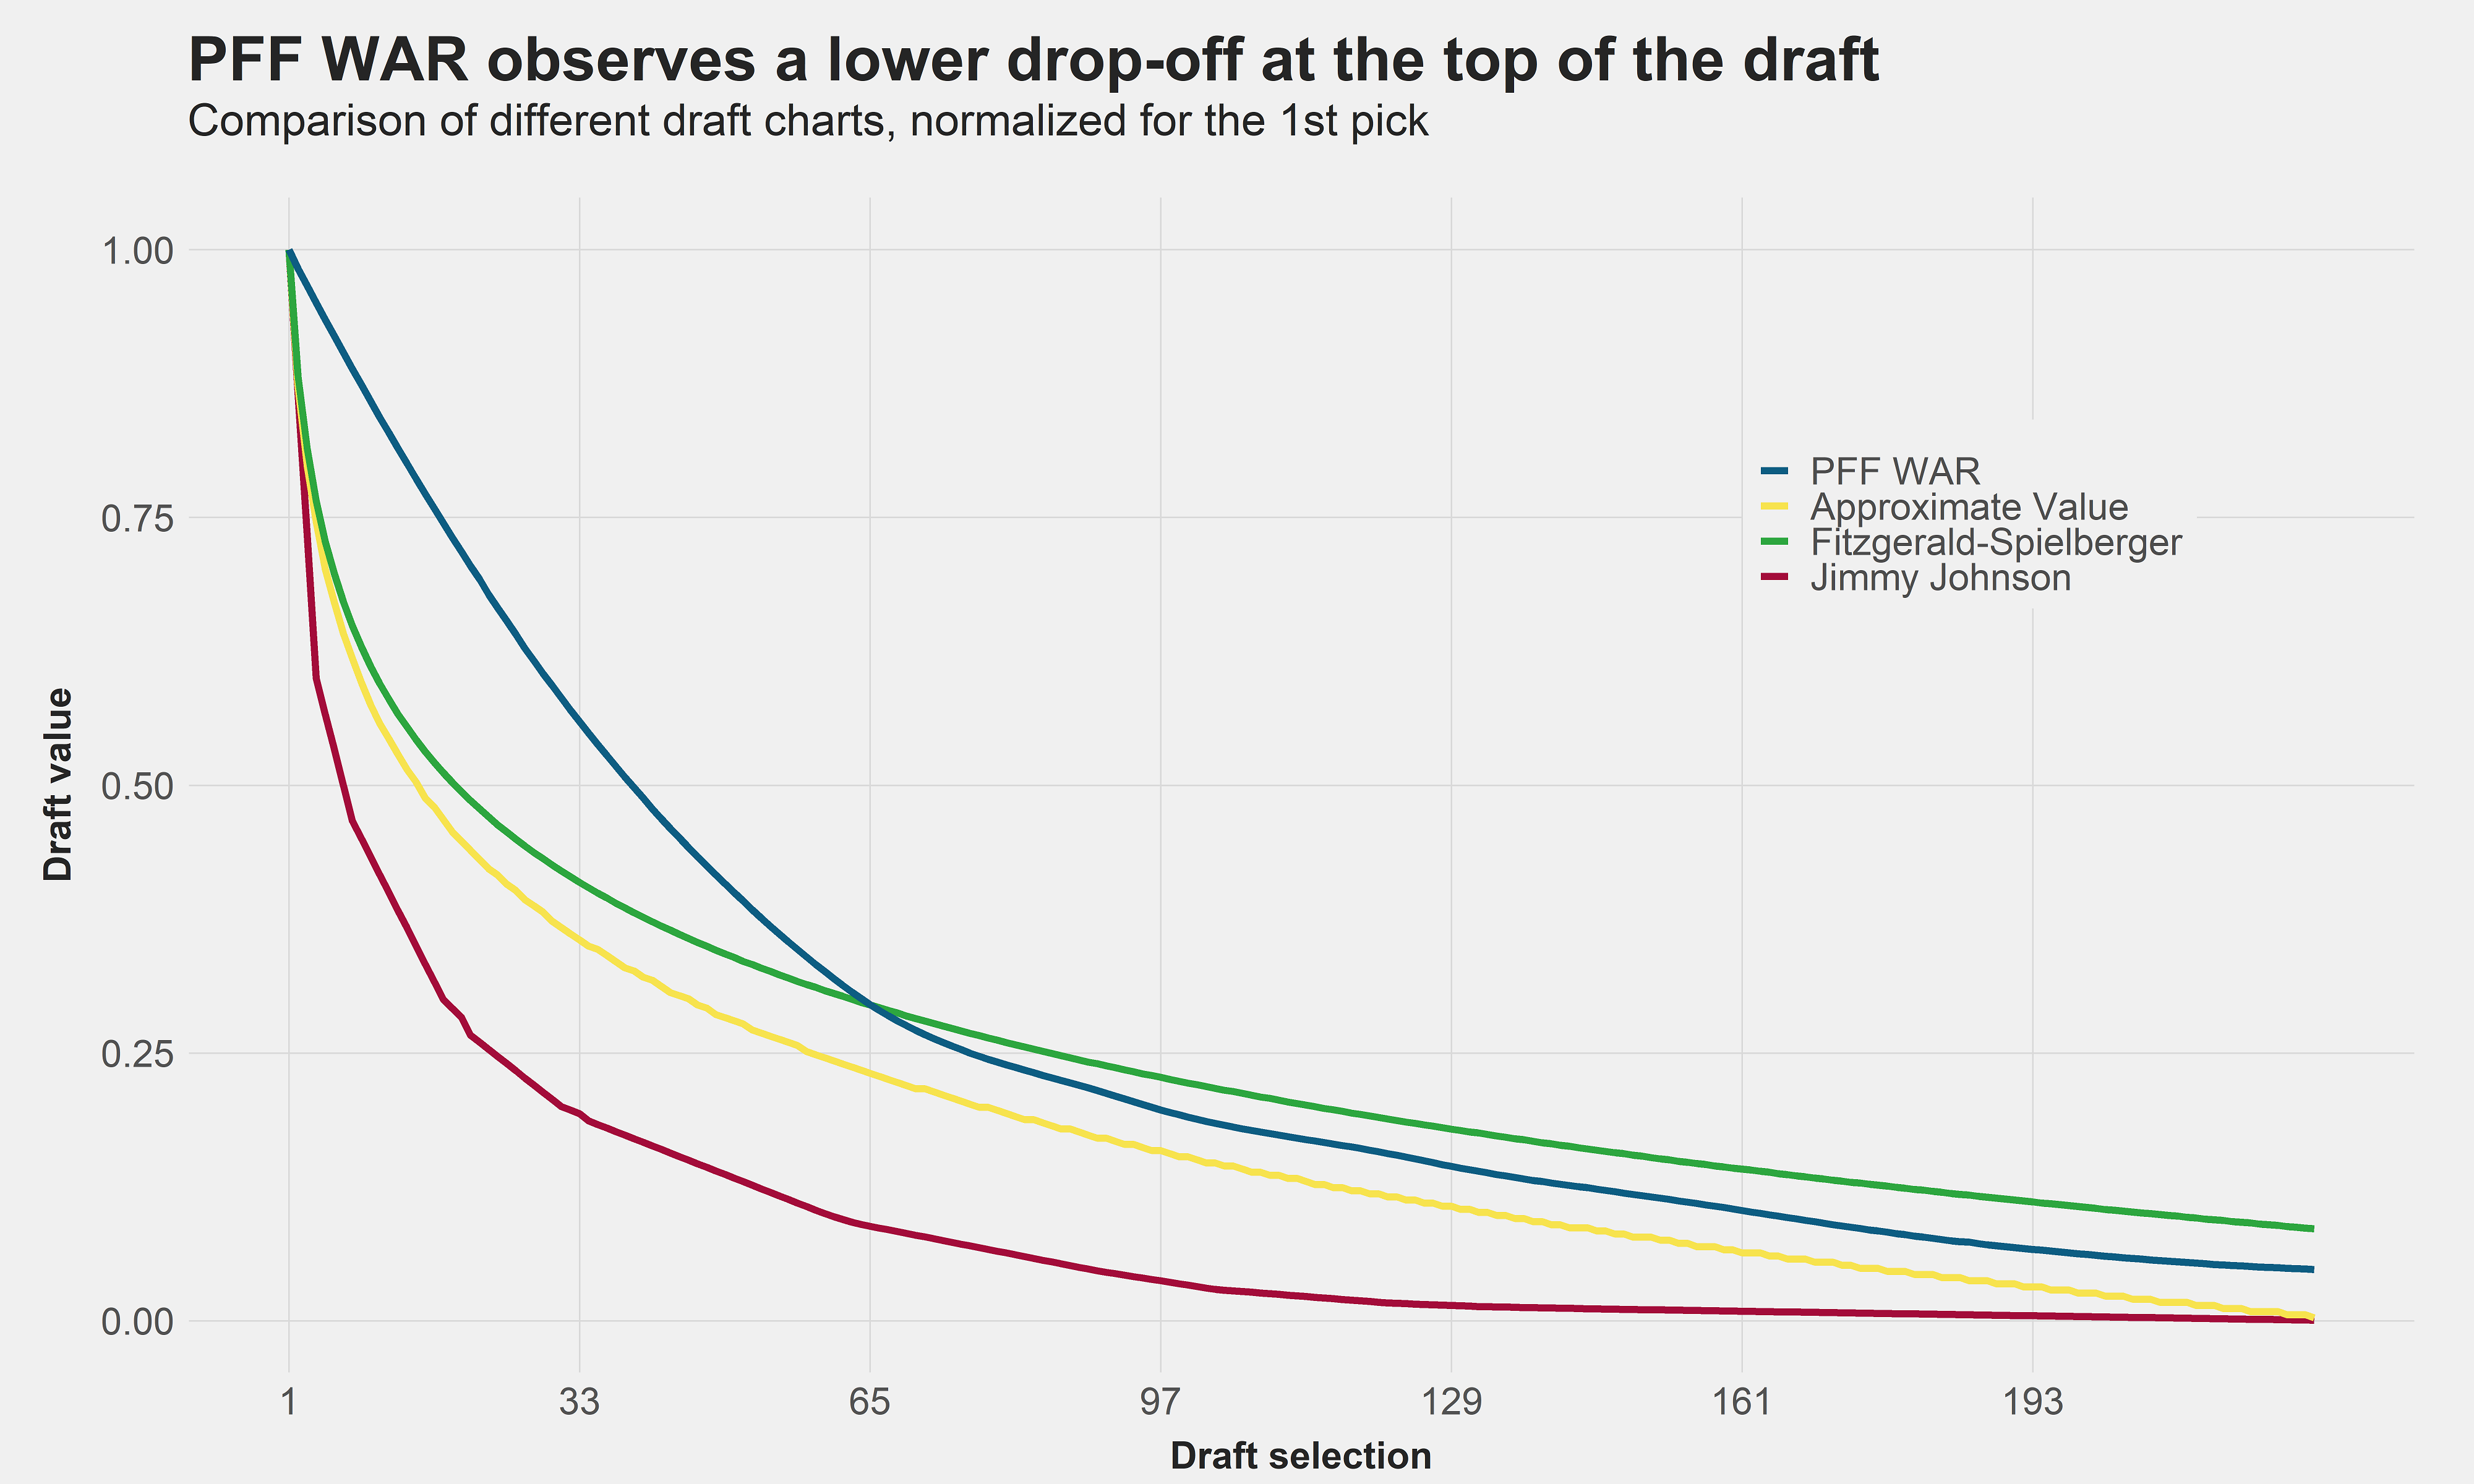
We find that, according to our PFF WAR metric, all other draft charts overestimate the value of a pick at the top of the draft. In terms of WAR, the first pick of the second round is worth 56% of the value of the first overall pick (if drafting a non-quarterback).
According to the other draft charts, the value of the 33rd pick is 35.5% (Approximate Value), 19.3% (Jimmy Johnson) and 40.9% (Fitzgerald-Spielberger) of the first pick. Using our draft chart, which not only yields expected values but also uncertainty and thus allows us to compute probabilities, such a steep drop-off would happen only 39%, 31% and 42% of the time, respectively, in comparison. The differences are partly driven by not separating quarterbacks and other positions, which is a crucial step towards a better understanding of draft value.
All the presented draft charts consider only the value that a draft pick is expected to generate on the field, and not its actual cost. In a seminal paper published in 2013, Cade Massey and Richard H. Thaler investigated the difference of the value and the cost of a draft pick, which is also known as the surplus value.
They found that the surplus value increases in the first round of the draft and peaks somewhere between the late first round and early second round. This means that, relative to the difference of the on-field value, teams that pick very early in the draft pay more for the services of their first-round rookies than teams that pick late in the first round. And because the worst teams are picking early in the draft, the authors fittingly called this finding The Loser’s Curse.
The goal of this article is to revisit Massey’s and Thaler’s research with the PFF WAR draft chart. For that matter, we assign the salary cost to each draft pick based on the rookie wage scale in the current CBA (though this analysis might need to be revisited once the new CBA is active).
Our draft value chart is measured in PFF WAR while the salary cost is measured in percentage of the cap. To compute the difference between those two, we have to translate the salary cost into WAR. This is a fairly easy task: Since we’ve set replacement level at three wins per season, the average NFL team earns five wins above replacement in a given season and uses 100% of the salary cap to do so. Thus, 1 WAR is worth 20% of the cap.
