
Now the fun begins.
Predicting wide receiver performance is the most difficult aspect of NFL projections. But it can also be the most financially rewarding when it comes to NFL betting.
After focusing on passing and rushing yardage, passing and rushing touchdowns, interception and sack props, PFF's player prop series continues with receiving yardage from both the season-long and week-to-week timeframe. The PFF stats used throughout this piece have weekly and yearly prediction value for receiving yardage prop bets, making this piece an invaluable resource before PFF's betting tools go live for Week 1 action.
RECEIVING YARDS
Whether it's the season-long or week-to-week prop problem, the first step to determining what matters when it comes to predicting receiving yards is to establish the “base rate.” This is calculated by using prior receiving yardage history to predict future totals.
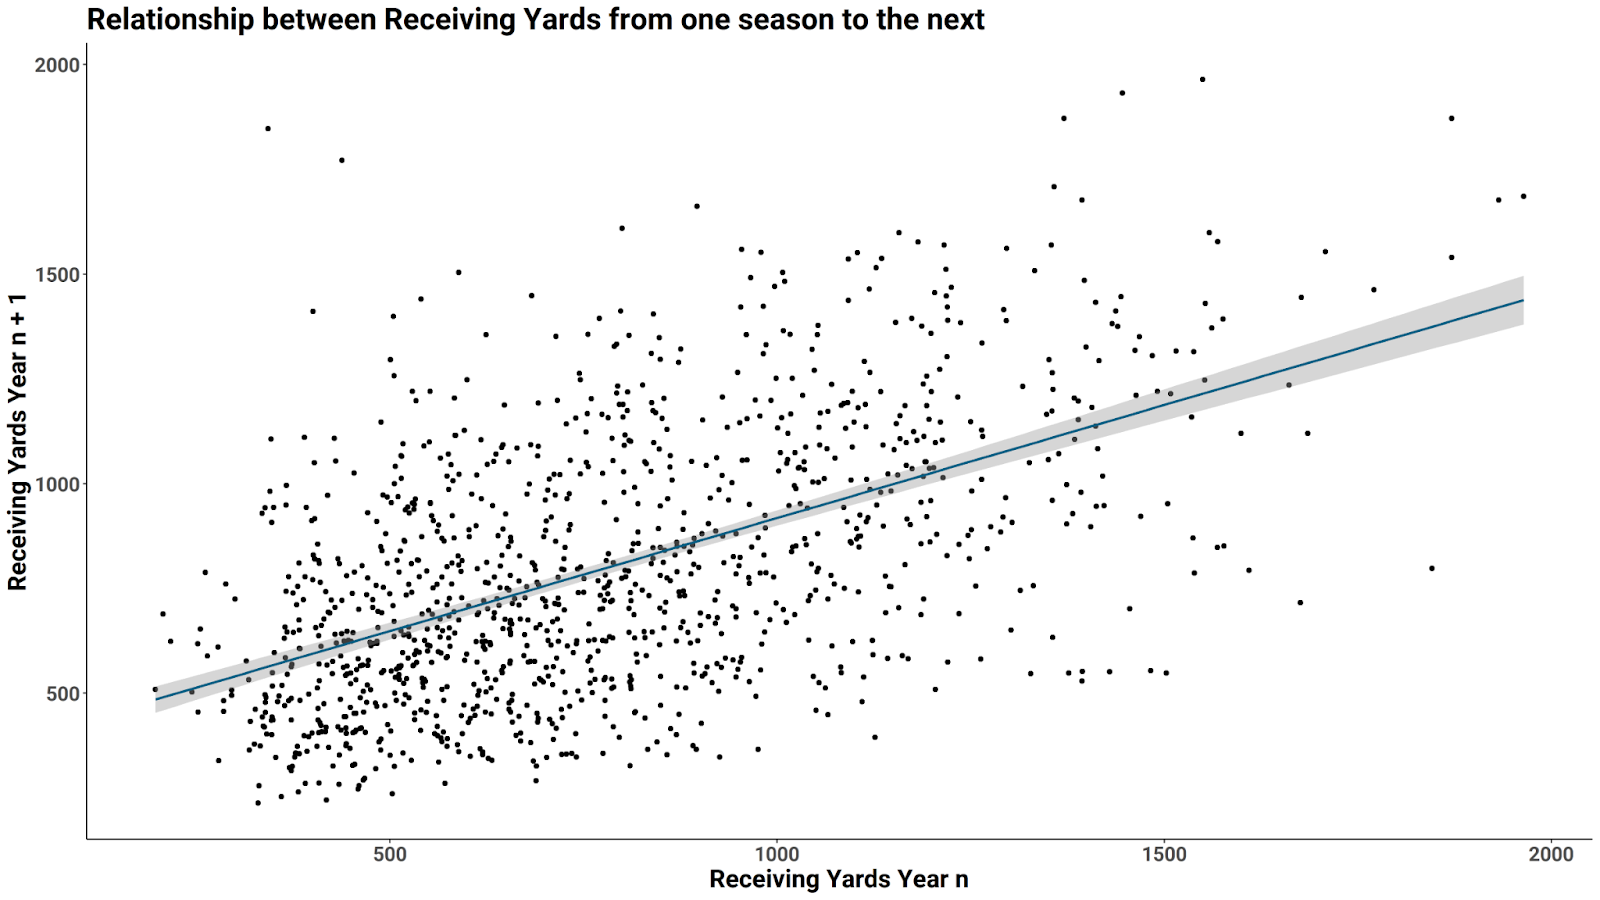
It turns out that receiving yardage from one season to the next is incredibly sticky, with an R-squared value of 0.810.
Opportunities are earned at the wide receiver position, of course, but a wide receiver’s ability to generate a positive receiving grade is even more impactful.
| Stat | Receiving Yards r^2 |
| Positive Receiving Grade Percentage | 0.812 |
| Receiving Yards | 0.810 |
| Total Catchable Targets | 0.807 |
| Air Yards | 0.756 |
| Air Yards Percentage | 0.736 |
| Total Receiving Touchdowns | 0.621 |
| Total Yards After Catch | 0.621 |
| Total Targets | 0.620 |
| Total Routes Run | 0.163 |
| Percent of Routes Run to Total Dropbacks | 0.105 |
A player's PFF receiving grade is the biggest indicator for his receiving yardage total the following season. Volume is key here, but there is nothing better than a pass-catcher's ability to gain separation.
We can also see that there will be some reliance on quarterback play, as a high volume of catchable targets predicts almost as well as receiving yards. Meanwhile, overvaluing drops on a week-to-week or season-to-season basis is a mistake bettors and fantasy players shouldn’t be making.
Air yards are the key to most models for the weekly timeframe, and they also perform well at the season-long level. They don’t quite catch receiving yards from season to season but are a more worthwhile prediction tool in-season.
Routes run, or the percentage of routes run relative to the team's passing snaps, yield some of the lowest r-squared values of stats tested. Quality routes are rewarded, but this is one volume metric that doesn’t seem to have much predictive value. There could also be an injury element that influences these numbers, which requires further study.
So, how can we use this information for betting purposes?
The rate of positive receiving grade is something that likely isn’t factored into the prop pricing. It probably isn't even a consideration for most bettors. And that's why it makes for a perfect stat to base our initial research on.
Receiving grades are stable from one year to the next and hold together well from game to game. Players can have one or two poor outings, but this could present a situation to target in upcoming weeks if those poor grades are driven by drops or some type of injury.
Focusing more on quality targets and air yards that come via well-thrown balls will also separate from what other bettors are doing. My approach for week-to-week prop betting this year will be to unearth these situations and then wager off them, but until that time comes, let’s take a look at some of the best season-long offerings compared to our fantasy projections.
FANTASY PROJECTIONS TO CURRENT MARKET LINE