Propapalooza continues at PFF as we prepare you for the 2021 betting season. Articles are being released daily that highlight not only the best bets to make in each prop category but also the framework for how to evaluate those bets on your own. Previous pieces have focused on passing yardage, passing touchdown, interception and sack props.
Subscribe to
This article returns to the more normal distribution of accumulating yardage by focusing on the rushing yardage props DraftKings now has available. We draw inspiration from the idea that there are often statistics that help us understand and measure the underlying processes behind a result better than the result itself. The stats used throughout this piece do have prediction value at both the season-long and week-to-week timeframe for rushing yardage prop bets.
RUSHING YARDS
The first step to determine what matters when predicting rushing yards is to establish the base rate, whether it's the season-long or week-to-week prop problem. This is done by using prior rushing yardage history to try to predict future rushing yards.
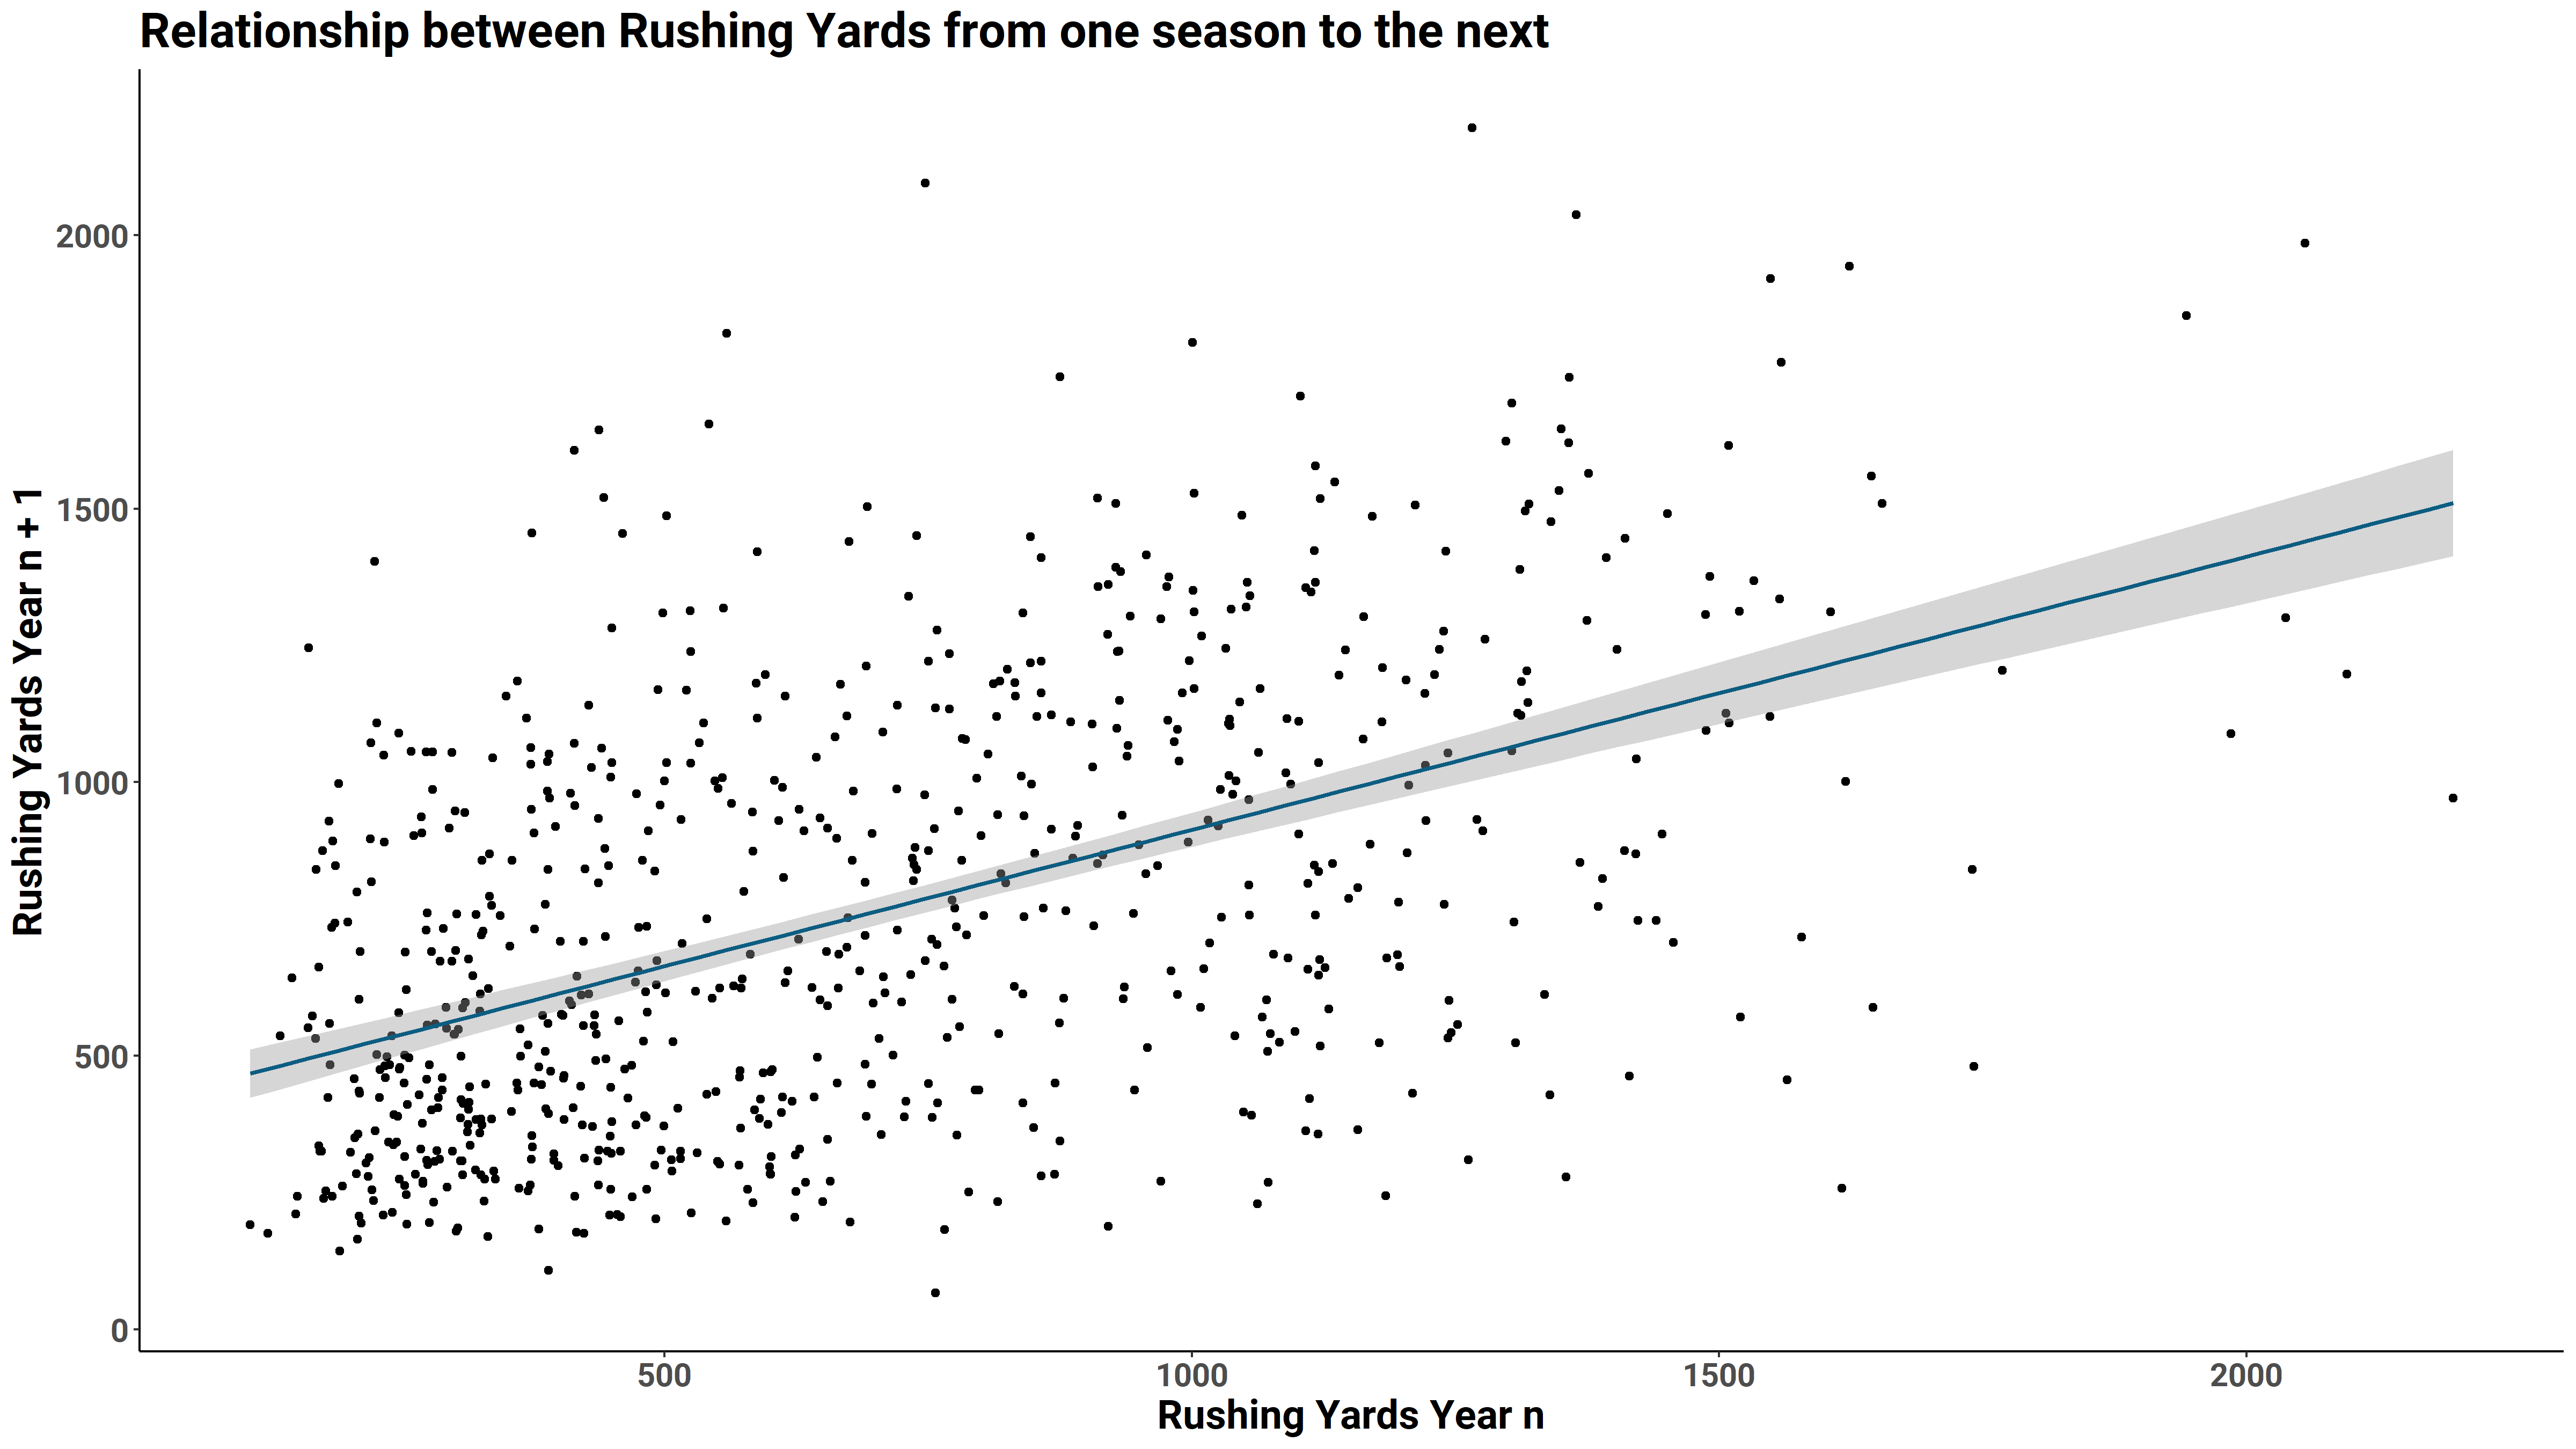
Rushing yards don’t have the highest base year-to-year correlation compared to other stats we have looked into, but the r-squared value still shows significance at .25 (min. 50 attempts each year). Other stats can definitely help us identify the best targets for rushing yardage player props.
The idea that volume is king for running backs is one easily understood by fantasy players. Similar to targets for wide receivers, actual rushing attempts go hand in hand with yardage production. And we see that in the r-squared value, as total rushing attempts in a season is the best explainer for rushing yards in season n+1. For convenience, below is a table of all stats with the r-squared value to rushing yards in season n+1 along with that particular stat's r-squared value to itself in season n+1 to show stability.
| Stat | Rush Yards r^2 | Stat r^2 |
| Total Rushing Attempts | 0.291 | 0.276 |
| Total Attempts with Positive Grade | 0.254 | 0.261 |
| Overall Rushing Grade | 0.253 | 0.266 |
| Overall Offensive Grade | 0.252 | 0.261 |
| Total Rushing Yards | 0.248 | 0.248 |
| Total Yards After Contact | 0.241 | 0.263 |
| Total Yards Before Contact | 0.195 | 0.206 |
| Total Tackles Avoided | 0.182 | 0.280 |
| Total Touchdowns | 0.122 | 0.162 |
| Total Attempts with First Contact Blocked | 0.044 | 0.332 |
Not only are we looking for stats that explain rushing yards in the upcoming season the best but also those stats that are stable from one year to the next. As expected, total rushing attempts is supreme with the highest r-squared value to next year’s rushing yards and also a solid r-squared value to next year’s rush attempts. It is noteworthy that total rushing attempts this season better explains rushing yards in the next season better than the next season's rushing attempts.
So, how can we use this information for betting purposes?