The 2021 NFL season is just around the corner. With all of the great PFF tools at your disposal, it can be overwhelming at times to know where to start when looking for the best bets.
One easy place to start for player props is Premium Stats. Let's go even further by looking at a very specific player prop: interceptions.
Subscribe to
The interception player prop is about as easy a proposition wager as there is, with most players each week lined at 0.5 interceptions. The price on over and under is an indication of the implied probability that the quarterback in question will throw zero interceptions or one or more interceptions. There are rare cases in which the line is one interception or 1.5 interceptions, but determining these probabilities is trivial once a process is in place for the canonical problem.
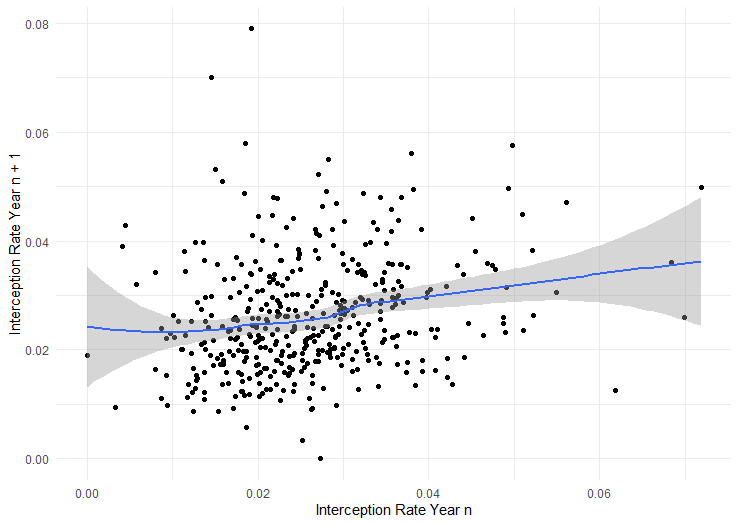
There is a natural way to try to solve this season-long or week-to-week prop problem, which is to use prior interception history to try to predict future interception rates. This isn’t completely misguided, as the year-to-year correlation in interception rates is not zero, but rather r = 0.230 implying that about 5% of the variance in interception rate one season can be explained by interception rate the previous year (min. 100 dropbacks each year).
A player’s interception rate from one season to the next
However, there are often statistics that help us understand and measure the underlying processes behind a result rather than the result itself. Inspired by this article by my colleague Ben Linsey and this subsequent Twitter interaction…
https://twitter.com/PFF_Eric/status/1413127539963404288?s=20
…I wanted to use another example of data we collect that can predict outcomes better than the outcome itself. Since 2006, PFF has tracked a statistic called “turnover-worthy plays,” which include fumbles in the pocket, throws that are interceptable and interceptions. Not all interceptions are turnover-worthy plays (think about a perfect pass that bounces off a receiver’s hands into the arms of a defender), and not all turnover-worthy plays are interceptions (think about the same pass off a defender’s hands).
In addition to being more stable itself (r = 0.370), turnover-worthy play rate correlates slightly better with interceptions than interceptions do year to year (r = 0.26), responsible for almost 7% of the variance in interceptions in subsequent years.
Relationship between turnover-worthy play rates and interception rates from one year to the next
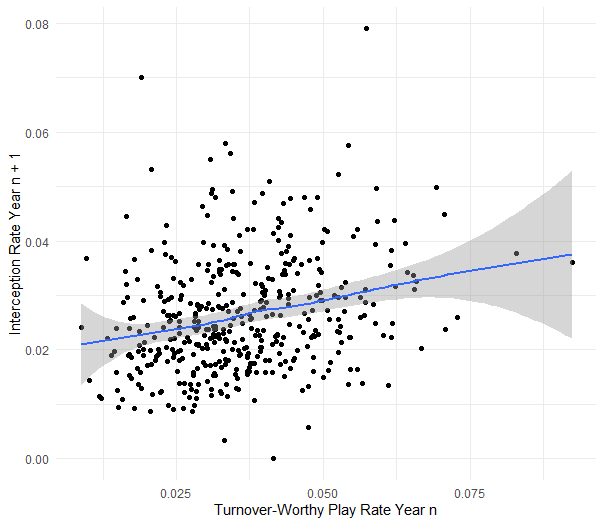
If reduced only to turnover-worthy play rate on passes, the correlation doesn’t really change, meaning there is something about being careless with the ball in the pocket vis-à-vis fumbles that translates to passes.
So, how can we use this information for betting purposes?
There are three parts to the process of predicting player props when they are a count like total interceptions. The first process is to predict the rate at which something will happen. Given the insights above, it stands to reason that turnover-worthy play rates, which are now available through Premium Stats, are the starting point for any model to predict interception rates for quarterbacks during a given week.
2020 Highest Turnover-Worthy Play Rates | Min. 300 Dropbacks
| Player | Turnover-Worthy Plays | Turnover-Worthy Play Rate |
| Mitchell Trubisky, CHI | 20 | 5.9% |
| Nick Mullens, SF | 21 | 5.8% |
| Drew Brees, NO | 19 | 4.5% |
| Drew Lock, DEN | 23 | 4.5% |
| Carson Wentz, PHI | 24 | 4.4% |
In fact, if one combines turnover-worthy play rate and interception rate, predictions get a small boost, much in the same way that combining expected goals and actual goals in soccer leads to better match predictions, or combining pressures and sacks together leads to better predictions of pass-rushing success.
Once a prediction for interception rate is produced, one has to come up with an estimate for the expected or average number of interceptions a quarterback will throw in a given game. This is pretty simple: Just multiply the rate derived above with an estimate for the number of passes a quarterback will attempt in that given week, and you have it.
For example, if a quarterback’s expected interception rate is 3%, and you expect (say, from looking at PFF's fantasy projections for a given game) that he will throw 35 pass attempts, his expected interceptions for that game will be 35*0.03 = 1.05 interceptions.
This is essentially what the fantasy projections do at the game and season level, although other features are folded in to try to make the projections more accurate — for example, offensive line grades, pass-rushing and coverage grades of a team’s opponent and weather. What makes player props a different game is that the bet is less about the index (e.g., 0.5 interceptions) than it is the price (e.g., -140 to the over, or +140 to the under). Hence, once a mean projection is achieved, there needs to be a predicted probability distribution to go with it.
We'll attack this using the Poisson distribution, which you can read more about here. Essentially, it's a one-parameter distribution that helps predict the probability of how many interceptions a quarterback will throw during a game.
To see the utility of this approach, here is a histogram of interceptions thrown in a game for players with 10 or more dropbacks in a game during the PFF era (2006-present):
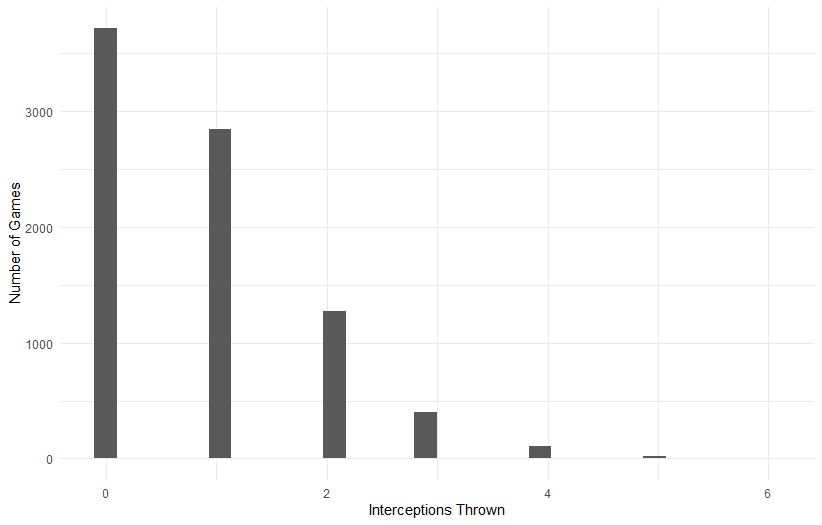
The average here is 0.85 interceptions, with a substantial tail. Simulating such data using the Poisson distribution yields the following distribution:
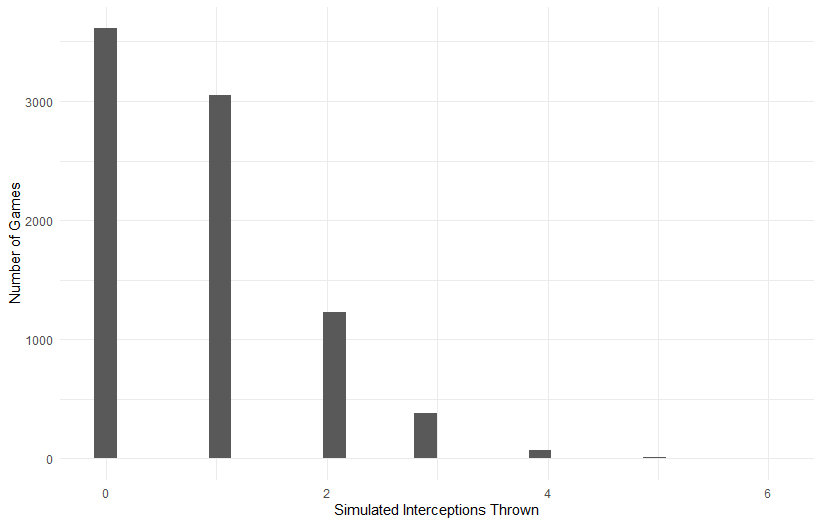
These two look strikingly similar, down to the tail. For example, for the simulation that produced the graph above, 43% of instances had zero interceptions, versus 44% of actual games.
With this distribution in your hands, you can compute the probability of zero, one or more interceptions and compare it to the market price to see if you have an edge to bet. There are other aspects of modeling this prop that will make your predictions more accurate, like the aforementioned facet grades for a quarterback’s offensive line or the opponent’s defensive line or secondary. There’s also temporal information (i.e., the fact that fewer interceptions were thrown in 2020 than in 2006) that will help you, as well.
This is just one example of many where someone can use PFF data and model player props themselves. If you’ve followed us over the past few years, you’ll know that we have a player props tool that will do some of this for you (and is 40% off this week with promo code SAVE40), but it’s often the intellectual challenge that draws bettors and DFS players to the party. If you want to enter the realm of interceptions props, this is a good start to doing it yourself.
Dive into PFF's guides to get the most out of the 2021 season, from the 2022 NFL Draft to college football to fantasy football!