Every year, booms and busts get treated somewhat in tandem. A boom is a player whose numbers should take a leap in the next year, while a bust is one going in the opposite direction. Standard fare, really.
Except they aren’t partners in simplicity. When a player, team, or other unit does something on the football field that sets new records and crosses never-before-seen thresholds, just pencil them in for major regression, call them a bust. You’ll be wrong sometimes, but you’ll be right far more often.
When players go the other way, though, and put up numbers way below what you might expect, it’s not so easy. Maybe a player was unlucky. Maybe a player had a down year. But also, maybe the player just isn’t good enough.
Case in point: In Tuesday’s piece, I highlighted how Sammy Watkins was likely to see less touchdown luck in 2018, because players who have a touchdown rate like Watkins did in 2017 just about always have less touchdown luck. But the flip side: Cecil Shorts. In 2013, Shorts had a touchdown on 2.56 percent of his targets. In 2014, 0.98 percent. In 2015, 2.99 percent. Generally speaking, players in the last decade who scored on 3 percent or less of their targets (min. 100) saw their touchdown rate more than double the next year (2.30 percent to 4.84). So was Shorts just the unluckiest player in the modern NFL, or was he a fringe receiver, just good enough to hang around the league, and on bad enough teams that he saw plenty of targets? In short, identifying positive regression candidates can be difficult.
Not this year, though.
In 2017, four players saw 100-plus targets and scored on under 3 percent of them. Before I unveil this year’s list, let’s look at the list from 2016, just to show how such a list can go in multiple directions. Last year, these players qualified:
- Tavon Austin
- Stefon Diggs
- Julian Edelman
- Pierre Garcon
- DeAndre Hopkins
- Jeremy Kerley
- Marqise Lee
- Jordan Matthews
- Greg Olsen
- Dennis Pitta
It’s a mix, right? Diggs and Hopkins are great, sure. But then Austin? What even is he as an NFL player? Kerley? Was Olsen unlucky in 2016, or has he started his decline? Slot guys like Edelman and Matthews are inherently less likely to score, but that much?
In short, it can be complicated. Now let’s look at the (much shorter) list from 2017:
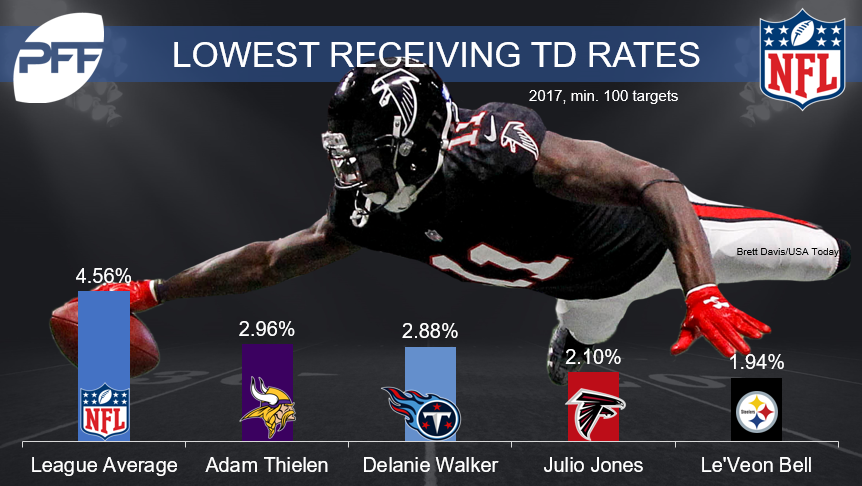
That’s the list. Those four combined for 485 targets in 2017, but only 12 receiving touchdowns. Combined, that’s 2.47 percent. If you assume the same number of targets for that group in 2018 but a standard increase in touchdown rate, those guys would score 24, 25 touchdowns. That’s great and all, but given that those guys finished as PPR RB2 (Bell), WR7 and 8 (Jones, Thielen), and TE4 (Walker), positive regression can only carry a player so far.
What does it mean for 2018? In 2017, the top 10 players in total targets (a list that includes both Jones and Thielen) were targeted a combined 1,462 times and scored 68 touchdowns (4.65 percent). That’s easily the worst rate in the last five years, and easily the second-worst in the last 10. Our Scott Barrett wrote about the trends of 2017 earlier this week, looking at how receiving production was down across the board. Part of that is usage, of course. But part of it is the natural vagaries of numbers. Bell, Jones, Thielen, and Walker could easily all find the end zone more often on their receptions in 2018. In fact, that’s a good bet to make. But the bigger lesson is that yes, receiving production was down in 2017, but don’t expect that to continue. That tide will rise, and it will lift the Bell, Jones, Thielen, and Walker boats along with it.
