In fantasy football, opportunity is the single greatest predictor of fantasy success at the flex positions. You can be the best running back in the world, but if you’re getting 12 carries a month, your season totals just aren’t going to measure up.
But just because opportunity is the greatest predictor doesn’t mean it’s the end of the discussion. Players do different things with the opportunities they receive. If, for example, 10 different players on a team divided up the opportunities (carries plus targets) equally, each getting a 10% share, you could pretty easily determine the best and worse just from what share of the team’s fantasy production those players got. The guy who gets 18% of the fantasy point market share on 10% of the opportunities is probably better than the guy getting 5% on a 10% opportunity share, for example. (This is all with the obvious caveat that not all opportunities are created equal, a target is worth more than a carry, etc.)
So today, I’m examining production as a product of opportunity. If a player gets a significantly higher share of his team’s PPR point market share than his opportunity share, that tells us one thing. If it’s significantly lower, than tells us another thing entirely. What does it tell us? Well, it depends. Sometimes it tells us that a player is particularly efficient (or inefficient). Other times it tells us that a player’s teammates are the (in)efficient ones. Either way, it is the start of a decent conversation.
(One more caveat, related to that first caveat: Running backs get far more opportunity than pass-catchers — Julio Jones led receivers and tight ends with 166 total opportunities, which would have only been 35th at running back — which more than offsets the greater value of targets. As such, the comparisons here will be based on position, not overall.)
Today, running backs and quarterbacks. Thursday, wide receivers and tight ends.
Running backs
Exceeded expectations
James White, New England Patriots
(20.7% opportunity share, 21.2% PPR point share, +0.5%)
Only five running backs with at least 40 opportunities put up a better PPR point share than opportunity share, and there’s a pretty clear common bond between them:
| Team PPR Point Share vs. Touch Opportunity Share, RBs/FBs |
||||
| Player | Team | Touch Opportunity Share | PPR Point Share | Difference |
| Kyle Juszczyk | SF | 5.0% | 5.9% | 0.9% |
| James White | NE | 20.7% | 21.2% | 0.5% |
| Javorius Allen | BAL | 7.7% | 8.1% | 0.4% |
| Tarik Cohen | CHI | 19.3% | 19.5% | 0.2% |
| Duke Johnson | CLE | 10.7% | 10.7% | 0.0% |
(min. 40 combined carries plus targets)
Obviously, pass-catching backs are at an advantage here, because of the aforementioned extra value of a target as it compares to a carry. White is notable, though, for his massive opportunity total — he was one of only 28 running backs with a team opportunity share greater than 20%. Sony Michel, who himself commanded 21.7% of the team’s opportunity share, should see even more chances in 2019, assuming health. On the other hand, you could argue that the Patriots have the league’s worst collection of receivers and tight ends at the moment, so White should continue to see plenty of targets, keeping his share high.
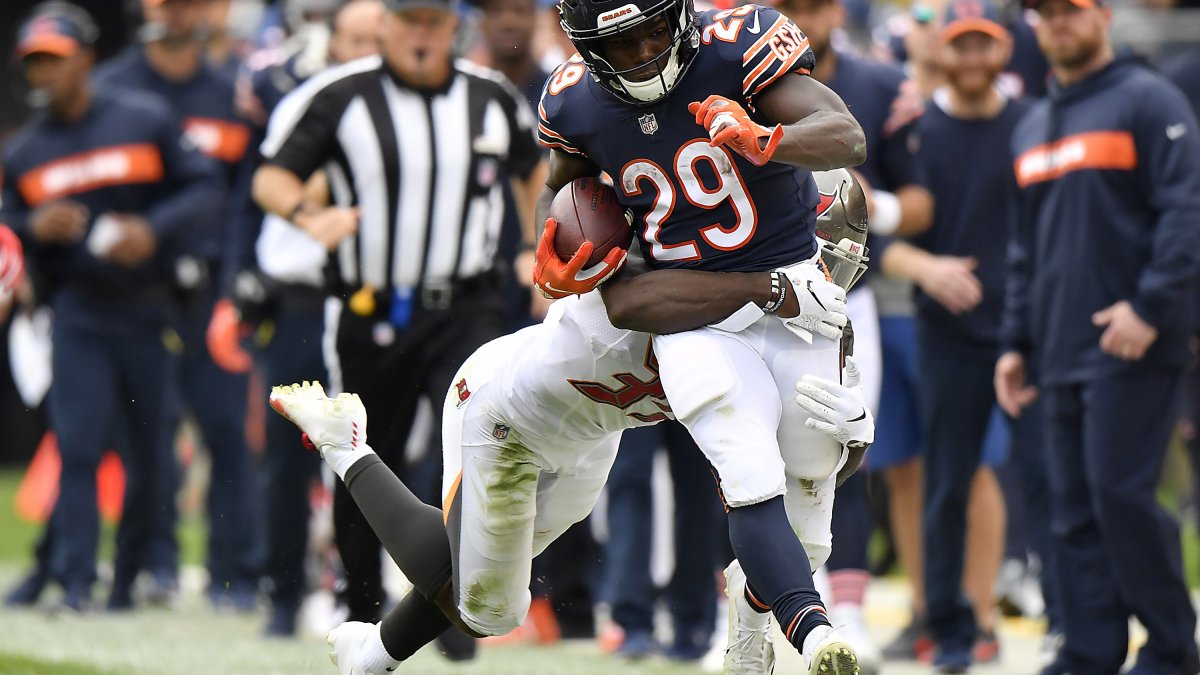
Tarik Cohen, Chicago Bears
(19.3% opportunity share, 19.5% PPR point share, +0.2%)
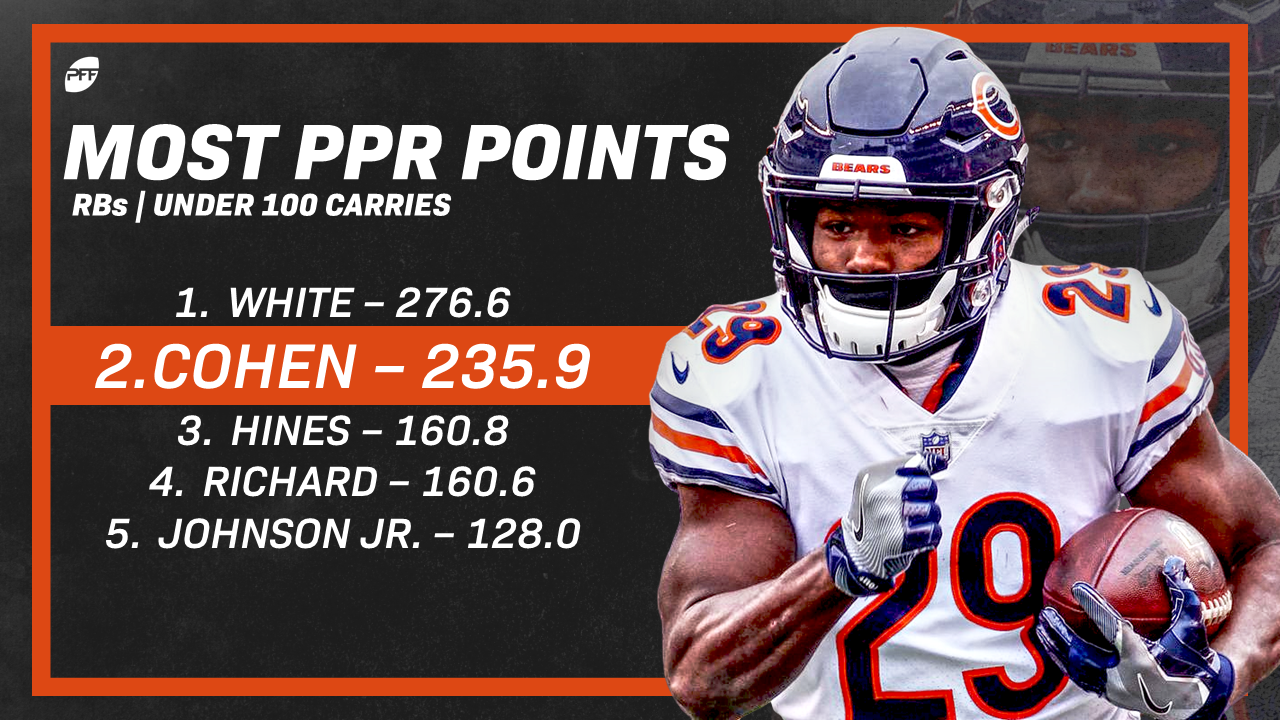
Cohen did his damage largely through the air — he had the second-most PPR points of any back with fewer than 100 carries, behind only White, and they had miles more points than any other sub-100-carry back. With Jordan Howard gone from Chicago now, and (for now) Mike Davis the only real replacement, Cohen should see an even greater opportunity share in 2019.
Damien Williams, Kansas City Chiefs
(8.1% opportunity share, 6.7% PPR point share, -1.4%)
Williams’ season-long numbers are obviously lower than most relevant names here, because he didn’t seize the Chiefs No. 1 job until the last month of the season. In Weeks 14-17, Williams had 26.6% of the Chiefs’ opportunity, 26.0% of the PPR points, a -0.6% difference that was negligibly better than his full-season numbers. With Carlos Hyde in town and maybe a draft pick to contend with, Williams might not see quite as much opportunity, but if he remains the team’s best pass-catching option out of the backfield his efficiency should stay high.
Fell short of expectations
Peyton Barber, Tampa Bay Buccaneers
(26.8% opportunity share, 11.0% PPR point share, -15.9%)
Barber had the unfortunate combination of being a subpar running back on the team with the best fantasy receiving corps in the league (the Buccaneers had the most PPR points from receivers in 2018 and the fewest from running backs). With essentially no change in the Bucs’ backfield so far this offseason, Barber could see a similar opportunity share, especially if Ronald Jones continues to disappoint. But he’s a clear example of where opportunity isn’t everything. Steer clear unless he just plummets in the draft.
Ezekiel Elliott, Dallas Cowboys
(42.3% opportunity share, 28.8% PPR point share, -13.4%)
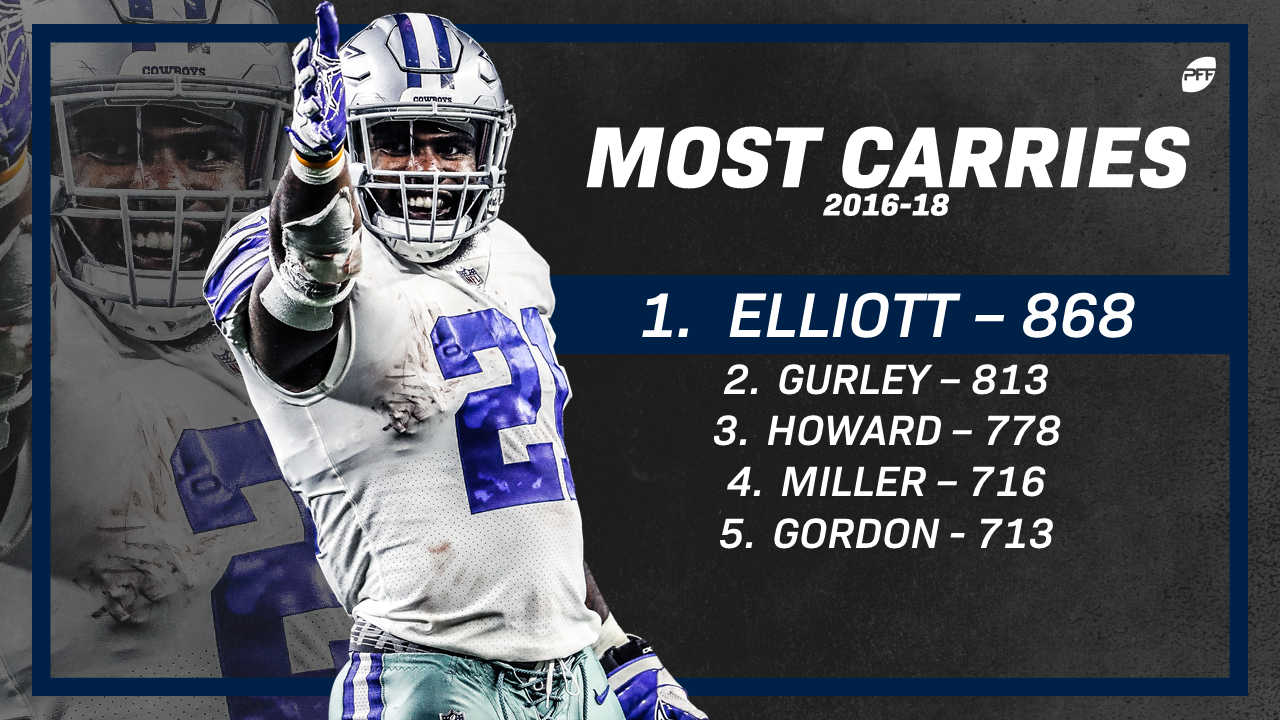
Elliott led the league in carries (304) by a full 43 over second-place Saquon Barkley, and only Barkley, David Johnson, and Todd Gurley were even within 50. Over the last three years combined (his whole career), Elliott has the most carries in the league by more than 50 despite missing eight games over that span. That alone helps to explain why Elliott’s overall percentage is lower than you’d expect despite being on a mediocre offense overall. The team hasn’t exactly surrounded Elliott with much backfield help so far this offseason, so you can expect him to have a massive opportunity share once again … but when a player is doing what Elliott is doing overall, you don’t care that much that his individual PPR point share might be a bit low.
Jordan Howard, Chicago Bears
(28.7% opportunity share, 15.4% PPR point share, -13.3%)
Remember the Tarik Cohen section up above? This is the inverse to that. Howard has 103 total targets in his three seasons — a number surpassed by three different backs in 2018 alone — and it dropped to a career-low 26 last season. Howard’s ceiling is naturally capped by his lack of contribution in the receiving game, and while his move to Philadelphia this offseason has garnered some hype, our Jeff Ratcliffe explained why it might be misplaced. Stay away from Howard unless he falls far in drafts.
Quarterbacks
Obviously, the vast majority of quarterbacks’ value comes from throwing the ball (with some notable exceptions in 2018), and we aren’t considering passing in this. This is strictly what the quarterbacks did on runs (and the few receptions QBs got).
Most efficient quarterback
(9.8% opportunity share, 11.8% PPR point share, +2.0%)
Allen was the only quarterback with 40-plus opportunities who had a positive efficiency number in 2018, with a number almost four percentage points better than second-place Aaron Rodgers’ -1.7% number. He can credit an awful LeSean McCoy season for some of that, but Allen was a very successful runner in his own right, especially late in the year — Weeks 12-17, Allen had 476 rushing yards, most among quarterbacks and eighth-most at any position. If Allen can keep up that rushing prowess, he’s always going to be an efficient contributor, but I have my doubts.
Least efficient quarterback
Lamar Jackson, Baltimore Ravens
(14.1% opportunity share, 8.6% PPR point share, -5.5%)
That’s right, Allen and Jackson occupied polar opposite positions on the leaderboard at the quarterback position. Allen is the outlier here — Jackson and Cam Newton had the two most opportunities among quarterbacks in 2018, and they were the two least efficient by this measure. Jackson didn’t have a quarterback with the name value of LeSean McCoy in his backfield, but Gus Edwards and Kenneth Dixon were better contributors than McCoy during Jackson’s stretch as a starter. Considering you’d expect a player with a massive amount of carries and no involvement in the receiving game to be strongly in the negative like Jackson and Newton, I feel like this actually bodes well for Jackson and indicates coming regression for Allen on the ground.
