If every single player on a given roster is equally productive on a given sample of chances, then a player’s percentage of team carries and targets will equal that player’s percentage of team fantasy points. If a guy gets exactly 10 percent of the chances and exactly 10 percent of the team fantasy points, well, that’s what he’s supposed to do, more or less.
When the numbers skew in one direction or another, it can mean some combination of two things:
- The player in question was hyper-efficient (or hyper-inefficient),
- The team in question either had so many or so few contributors around the given player that his performance stands out.
Basically, this is a quantity-v.-quality debate. If you give even the league’s worst healthy running back 300 carries, he’s going to end the year with a relevant number of fantasy points. But if he gets 40 percent of his team’s opportunities and only 10 percent of the fantasy points, well, that helps you see why that guy was called the league’s worst.
A couple of caveats before I get into the specifics:
- Running backs get more “opportunities” than receivers. DeAndre Hopkins had a league-leading 164 targets; 28 running backs had more carries than that, to say nothing of the many more who had more carries-plus-targets. So running backs naturally look less efficient than pass-catchers, and as such my comparisons below will focus on intrapositional looks.
- A subpar player on a bad team and a good player on a good team could have the exact same percentage of team’s fantasy performance, simply because of context. This isn’t the be-all, end-all statistic. It’s an interesting way to look at 2017 performance, and it invites deeper look, but two players simply having the same numbers here isn’t the end of the conversation; it’s the beginning.
What we’re looking at today is the gap between chances and fantasy scoring. Total a -20 (meaning you scored 20 percent more of the team’s fantasy points than your percentage of chances), you were a crazy-efficient player, relative to your team. Total a +20, and … you weren’t.
Now, on to the interesting numbers:
Bottom five running backs
Le’Veon Bell, Pittsburgh Steelers (+14.0)
Frank Gore, Indianapolis Colts (+11.4)
Melvin Gordon, Los Angeles Chargers (+11.2)
Samaje Perine, Washington (+10.9)
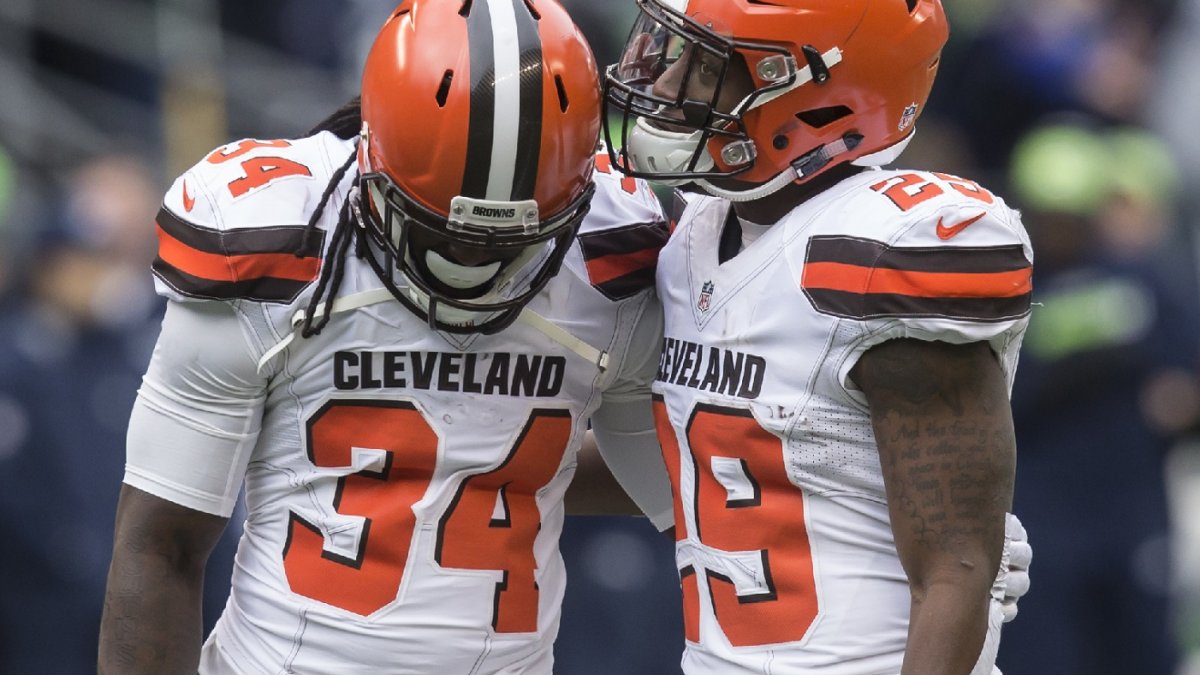
Isaiah Crowell, Cleveland Browns (+10.6)
Of the five here, two (Gore and Perine) clearly belong to the category of inefficient scorers. Both earned a big chunk of their respective teams’ chances because those teams didn’t have much else to offer at the position. One (Bell) was really good, but was on one of the league’s highest-scoring teams.
It’s the other two (Gordon and Crowell) that are the most interesting. Crowell was a disappointment in 2017, but he had better grades in 2015 (75.0) and 2016 (74.4) before that and finished as the No. 14 RB in 2016. Now with the Jets, Crowell isn’t likely to be a clear RB2 again, but he might be able to improve on a disappointing 2017 if he gets a full early-down gig.
And then there’s Gordon, who shook off an awful rookie season in 2015 to finish as a top-eight back each of the last two years. Of course, he did that with essentially no supporting cast at the position, and I’m on record as being intrigued by Austin Ekeler as a sleeper in 2018. Still, Gordon’s numbers here are more a factor of the Chargers having Keenan Allen, Hunter Henry and others than they are his own underwhelming numbers.
Top five running backs
Duke Johnson, Cleveland Browns (-2.9)
Chris Thompson, Washington (-2.3)
Alvin Kamara, New Orleans Saints (-2.0)
Corey Grant, Jacksonville Jaguars (-1.6)
Rod Smith, Dallas Cowboys (-1.4)
There’s a running theme among those backs (save one), and it’s pass-catching ability. In standard scoring, the average carry was worth 0.56 fantasy points in 2017, while the average reception was worth 1.53. So a pass-catching back is logically going to score higher in this measurement than a LeGarrette Blount-esque, largely receptionless back. Johnson, Thompson, and Kamara all had strong years (half in the case of Thompson, before injury) with plenty of receptions, while Smith had a much lighter workload but made the most of his chances.
Grant is the interesting one here. He played all 16 games and only had carries in seven of them, only had more than six carries once. But he scored twice on 30 carries and averaged 3.1 yards after contact per attempt. There’s a reason our Pat Thorman can’t turn down a chance to talk about Grant, and while Leonard Fournette’s continued existence means Grant won’t be fully fantasy relevant, the departure of Chris Ivory should give Grant a bit more opportunity in 2018.
Bottom five wide receivers
Kamar Aiken, Indianapolis Colts (+2.4)
Breshad Perriman, Baltimore Ravens (+2.1)
Corey Davis, Tennessee Titans (+1.9)
Demarcus Robinson, Kansas City Chiefs (+1.8)
Mike Williams, Los Angeles Chargers (+1.3)
What an awful showing for the 2017 first-round receivers. Davis and Williams were both among the league’s least-efficient receivers, while John Ross didn’t put up a single fantasy point, but still didn’t make it onto this list by virtue of having virtually no opportunity. Davis looked great in the Titans’ playoff loss to the Patriots, and with Eric Decker gone, he should have all the chances to put up better numbers in 2018. Williams, meanwhile, lost a big chunk of his rookie year to injury, but it’s too early yet to give up on the 2017 seventh overall pick.
Of course, first-round picks don’t always develop, as Perriman (26th overall in 2015) has displayed, even on a bad team. He missed his rookie year, turned 66 targets into just under 500 yards in 2016, and gained only 77 yards on 31 targets in 2017. His 39.1 PFF grade in 2017 was 116th-best, worst among all qualified receivers (and no unqualified receivers had a lower grade, either). Second-worst? Aiken, whose 39.8 grade in his lone season in Indianapolis does not bode well for his future prospects.
Top five wide receivers
DeAndre Hopkins, Houston Texans (-11.5)
Marvin Jones, Detroit Lions (-8.7)
Davante Adams, Green Bay Packers (-8.4)
T.Y. Hilton, Indianapolis Colts (-8.3)
Antonio Brown, Pittsburgh Steelers (-7.7)
Little surprise here, with the possible exception of just by how much Hopkins stands above the rest of the league. Hilton is excellent in his own right, but his percentage here is also boosted by the poor performances by above teammates like Gore and Aiken. Brown is notable at fifth, largely because teammate JuJu Smith-Schuster finished sixth at -7.6, and that team just has the potential to put up so many points.
Notable tight ends
Josh Hill, New Orleans Saints (+0.8)
Greg Olsen, Carolina Panthers (+0.3)
Tyler Kroft, Cincinnati Bengals (-5.4)
O.J. Howard, Tampa Bay Buccaneers (-5.9)
Rob Gronkowski, New England Patriots (-6.3)
- Hill’s (and Coby Fleener’s) poor numbers help explain why the Saints brought back Benjamin Watson this offseason.
- Olsen dealt with injury most of the year, and did have one monster game, but color me pessimistic about his future as a TE1.
- Kroft’s numbers were very impressive in his first year with significant usage, but the re-signing of Tyler Eifert to the Bengals as a free agent likely means Kroft won’t get much of a chance to repeat.
- Howard battled with Cameron Brate for playing time, but he put up 76 standard fantasy points on only 36 targets. With Brate still around, he’s still unlikely to see a huge workload, but his scoring acumen makes him a sneaky low-end TE play every week.
- Oh, look. Gronk was the best. Who'da thunk it.
