
In fantasy football, as in … well, everything, context is crucial. My brother is a huge believer that experience and age trump all. He loves to say “Who do you want to operate on you, the surgeon with 20 years of experience or the surgeon with two years?”
And yes, sure, if that is literally the only piece of information you have in the scenario, go for the experienced guy. But I’m stumped as to a situation where that’s all the information you can get. Until someone makes a Love Connection-esque reality show called Pick My Surgeon, you can always get more information. Maybe the veteran is near retirement because his eyes are going. Maybe the young surgeon was trained on new, better procedures. You just don’t know, and if you’re picking based only on years of experience you’re doing it wrong.
In fantasy football, opportunity is king. You want a pass-catcher who is getting targeted. The quick-and-dirty way to determine that is simple raw target numbers. DeAndre Hopkins had 164 targets in 2017, most in the league. Emmanuel Sanders had 87 targets, while Brandon LaFell had 86. Odell Beckham Jr. had 41.
Of course, the obvious caveat there (you guessed it as soon as you read Beckham’s name) is that raw target totals ignore the opportunities for targets. So you look at routes. Larry Fitzgerald ran the most routes in the league, at 650. Sanders ran 411, while LaFell had 528. Beckham ran only 145.
It’s those last three names I want to talk about right now. And I want to look at targets per route. Which receivers were targeted the most often when they could have been? That shows trust between a quarterback and receiver — be it because that receiver is great, or the rest of a team’s options are subpar, or a mix of the two. A pass-catcher who is targeted on 100 percent of his routes is going to be a monster, one way or another. A pass-catcher who is targeted on 1 percent of his routes doesn’t have the faith of his quarterback.
So, Sanders had 87 targets in 2017, LaFell 86, Beckham 41. But Sanders was targeted on 21.2 percent of his routes. LaFell was targeted on 16.3. Beckham was targeted on a whopping 28.3 percent. You know Beckham has the faith of Eli Manning. Intuitively, you probably knew that Sanders had more trust than LaFell too, even if their raw target totals were essentially equal. Targets per route (available in PFF Signature Stats) is the best way to prove it.
Those results aren’t a surprise. Here are a few that might be, and what they mean for 2018. (NFC today, AFC Tuesday)
Arizona Cardinals
| 2017 targets per route for key Arizona Cardinals | |||||
| Player | Targets | Routes | Rec. Yards | YPRR | Target % |
| Ricky Seals-Jones | 28 | 68 | 201 | 2.96 | 41.18 |
| Larry Fitzgerald | 153 | 650 | 1156 | 1.78 | 23.54 |
| Andre Ellington | 47 | 200 | 297 | 1.49 | 23.50 |
| John Brown | 51 | 311 | 299 | 0.96 | 16.40 |
| J.J. Nelson | 59 | 364 | 508 | 1.40 | 16.21 |
| Jermaine Gresham | 45 | 309 | 322 | 1.04 | 14.56 |
| Jaron Brown | 64 | 529 | 477 | 0.90 | 12.10 |
The Cardinals had 18 different players targeted in 2017, but only seven with at least 28 targets. Fitzgerald getting targeted 23.5 percent of the time isn’t a surprise, especially given the fungibility of the rest of the team’s wide receivers in 2017 and the injury to David Johnson.
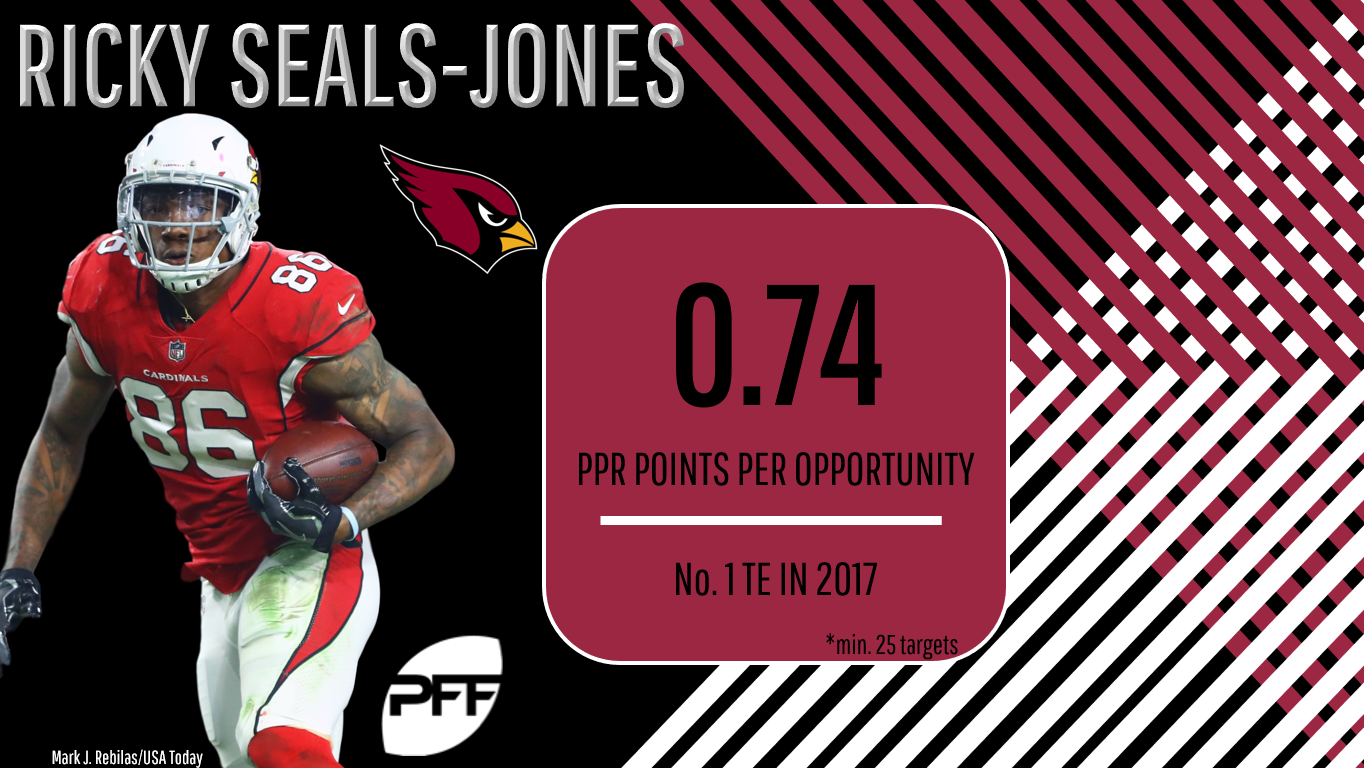
But it’s Seals-Jones’ numbers that stand out the most. He ran only 68 routes in 2017 and was targeted 28 times. Fourteen players were targeted 40-plus percent of the time in 2017. Seals-Jones is the only player on that list with more than a sad little five targets. The Cardinals have a new coaching staff in place for 2018, one that doesn’t guarantee as many tight end looks, but Seals-Jones’ production on a small scale bodes well for his potential sleeper status in 2018.
Carolina Panthers
| 2017 targets per route for key Carolina Panthers | |||||
| Player | Targets | Routes | Rec. Yards | YPRR | Target % |
| Christian McCaffrey | 106 | 448 | 651 | 1.45 | 23.66 |
| Kelvin Benjamin | 51 | 235 | 475 | 2.02 | 21.70 |
| Devin Funchess | 109 | 515 | 840 | 1.63 | 21.17 |
It’s tempting (and easy) to say that Funchess’ target rate shot up after the Benjamin’s departure to Buffalo, but it’s not really accurate. Funchess was targeted on 20.7 percent of his routes while Benjamin was on the team, 21.6 after he was traded. Instead, the biggest beneficiary of Benjamin leaving was actually the rookie McCaffrey, who was targeted 19.9 percent of the time before the trade but a whopping 27.0 percent of the time after. Given that the Panthers’ only significant pass-catching addition this offseason has been field-stretcher Torrey Smith, and McCaffrey is fairly entrenched as the team’s only full-time running back, he could be even more of a PPR monster in 2018.
Detroit Lions
| 2017 targets per route for key Detroit Lions | |||||
| Player | Targets | Routes | Rec. Yards | YPRR | Target % |
| Golden Tate | 117 | 534 | 1003 | 1.88 | 21.91 |
| Marvin Jones Jr. | 105 | 626 | 1101 | 1.76 | 16.77 |
| Kenny Golladay | 48 | 288 | 477 | 1.66 | 16.67 |
Tate’s average depth of target (6.7 yards) is almost 10 full yards less than Jones’ (16.1), which goes a long way toward explaining why he had only 12 more targets than Jones but had a full 31 more receptions. Golladay, with an aDOT of 15.7 yards, is much more Jones than Tate. And given that Golladay’s target percentage when he was healthy was essentially equal to Jones’, a healthy-all-year second-year Golladay is more likely to eat into Jones’ production than Tate’s. Tate should stay highly ranked for 2018, but maybe downgrade Jones a bit.
Los Angeles Rams
| 2017 targets per route for key Los Angeles Rams | |||||
| Player | Targets | Routes | Rec. Yards | YPRR | Target % |
| Robert Woods | 80 | 360 | 781 | 2.17 | 22.22 |
| Cooper Kupp | 90 | 424 | 869 | 2.05 | 21.23 |
| Todd Gurley | 76 | 368 | 788 | 2.14 | 20.65 |
| Tyler Higbee | 42 | 254 | 295 | 1.16 | 16.54 |
| Gerald Everett | 30 | 195 | 244 | 1.25 | 15.38 |
| Sammy Watkins | 66 | 455 | 593 | 1.3 | 14.51 |
It wasn’t just that Watkins scored at a likely unsustainable rate in 2017 (with 8 touchdowns on 66 targets), it’s also that he clearly wasn’t anywhere close to Jared Goff’s favorite target in Los Angeles, with Kupp, Woods, Gurley, and even the tight ends Higbee and Everett seeing targets on a higher percentage of their routes. Now in Kansas City, Watkins has all the skill to be a strong weapon for new starter Patrick Mahomes, but he seems sure to slot behind Tyreek Hill (2017 target percentage: 20.24), Travis Kelce (22.90), and perhaps even Kareem Hunt (20.46) in target percentage.
Minnesota Vikings
| 2017 targets per route for key Minnesota Vikings | |||||
| Player | Targets | Routes | Rec. Yards | YPRR | Target % |
| Dalvin Cook | 15 | 57 | 90 | 1.58 | 26.32 |
| Jerick McKinnon | 61 | 276 | 421 | 1.53 | 22.10 |
| Latavius Murray | 17 | 128 | 103 | 0.8 | 13.28 |
McKinnon, now with the 49ers, has the reputation as the big-time target monster, but he actually was targeted less often on his routes than rookie Cook was in the small sample he put up before tearing his ACL. Assuming Cook starts 2018 healthy, he has all the makings of a true bell-cow back who could see as many targets as any of the true three-down options around the league.
New York Giants
| 2017 targets per route for key New York Giants | |||||
| Player | Targets | Routes | Rec. Yards | YPRR | Target % |
| Odell Beckham Jr. | 41 | 145 | 302 | 2.08 | 28.28 |
| Sterling Shepard | 83 | 439 | 731 | 1.67 | 18.91 |
| Brandon Marshall | 32 | 170 | 154 | 0.91 | 18.82 |
Before Beckham’s injury, he was targeted as often as ever — virtually as often as DeAndre Hopkins, barely behind Antonio Brown and Julio Jones, right in line with the league’s top receivers. So while his counting stats aren’t up to the normal Beckham standards because of injury, there’s no reason to think his trust has dissipated (not that anyone is claiming otherwise). But Marshall, the Giants’ big receiving addition last offseason, is a different matter. He was targeted on only 18.8 percent of his 170 routes, and accumulated only 0.91 yards per route run on his receptions. The Giants haven’t yet committed to keeping Marshall for 2018, but even if they do, it’s hard to imagine trusting him as anything other than a late-round fantasy lottery ticket.
Tampa Bay Buccaneers
| 2017 targets per route for key Tampa Bay Buccaneers | |||||
| Player | Targets | Routes | Rec. Yards | YPRR | Target % |
| Mike Evans | 132 | 591 | 1004 | 1.7 | 22.34 |
| Chris Godwin | 54 | 258 | 525 | 2.03 | 20.93 |
| DeSean Jackson | 87 | 437 | 668 | 1.53 | 19.91 |
| Adam Humphries | 82 | 499 | 631 | 1.26 | 16.43 |
Godwin came into 2017 as a relatively unheralded rookie, and he didn’t exactly burst onto the scene early in the year — it took until Week 10 for him to see more than three targets in a game, and he only saw more than three four times all year. In those four games, though, he totaled 20 receptions on 34 targets for 345 yards and his lone rookie score. On top of that, Godwin was targeted on a slightly higher percentage of his routes than Jackson was on his. Godwin has sneaky breakout potential in 2018.
Washington
| 2017 targets per route for key Washington players | |||||
| Player | Targets | Routes | Rec. Yards | YPRR | Target % |
| Jordan Reed | 33 | 141 | 211 | 1.5 | 23.40 |
| Vernon Davis | 68 | 389 | 648 | 1.67 | 17.48 |
When healthy, Reed was targeted as often as ever in 2017, but no phrase has ever done more work than the first two words of this sentence. And with news out that Reed will miss OTAs because of a toe procedure, the phrase is already being tasked with more heading into the 2018 season. Few tight ends have more upside (he was targeted significantly more often on his routes than Davis was on his), which will keep Reed as a perennially interesting late-round fantasy pick, but that health risk will keep him from being drafted highly unless and until he can ever stay healthy.
