(Metrics that Matter is a regular offseason feature that examines some aspect of fantasy through a microscope to dive into the finer details.)
In PPR leagues since 2006, touchdowns make up 21.2 percent of fantasy scoring for running backs, 19.6 percent for tight ends, and 17.0 percent for wide receivers. In standard scoring, those numbers jump to 26.7 percent, 31.7 percent, and 26.3 percent at each position, respectively.
Though touchdowns are clearly extremely valuable in fantasy football, they’re rare events, mostly random, and extremely hard to predict. At each position, touchdowns were far less sticky (showing a much lower correlation year-over-year) than targets, receptions, carries, or yards. We also know that players who ranked highly in touchdowns in one year tend to regress closer to the mean in the following season. Over the past decade, there have been 129 instances of a flex-eligible player recording more than 10 touchdowns in one season and also play in at least one game in the following year. Only 8.5 percent of those players saw an increase in touchdowns, and, on average, each player lost about 5.5 touchdowns from their prior-season total.
So, we know touchdowns are extremely important for fantasy football but extremely difficult to predict. We also know it’s valuable to pinpoint looming touchdown regression candidates. But what’s the best method for evaluating this?
Efficiency and athletic ability certainly does play a role in touchdown scoring, but for the most part, touchdowns are far more a function of a player’s opportunity. The more opportunities you see and the more opportunities you see closer to the end zone, the more likely you are to score a high number of touchdowns. Though frequently cited, red-zone metrics aren’t very good at predicting touchdowns. The closer you are to the end zone the greater your chances of scoring, but that number starts shrinking rapidly, and well before you approach the edge of the red zone. So, for instance, rather than grouping carries from the 1-yard line (53.9 percent chance of scoring) in with carries from the 17-yard line (3.7 percent chance of scoring) and treating them the same, we’d be better off weighting each carry at each yard line by their actual degree of scoring probability.
Mike Clay first came up with this idea in 2013, and created a metric called oTD to improve upon red-zone metrics as a predictor for touchdowns. With Clay’s oTD as the inspiration – like with almost all new fantasy football metrics, everything is somewhat derivative of Clay’s work – I attempted to calculate expected touchdowns by using a similar methodology to Clay’s and to how I calculate a player’s Actual Opportunity numbers. Basically, I’m looking at each carry by distance from the end zone (and weighting each carry according to the average scoring rate on all identical carries since 2007) and looking at each target by distance from the end zone and depth of target (and weighting each specific target type based on the average scoring rate on all identical targets since 2007). The sum of these numbers gives us a player’s total expected touchdowns, or how many touchdowns we should expect a perfectly average player to score on an identical workload. We can contrast this with a player’s total touchdowns to measure their efficiency.
After testing this, I found expected touchdowns were just as strong at predicting touchdowns in the following season as raw touchdowns (0.52 correlation to 0.52 correlation), but expected touchdowns were much stickier year-over-year than raw touchdowns (0.60 correlation to 0.52 correlation).
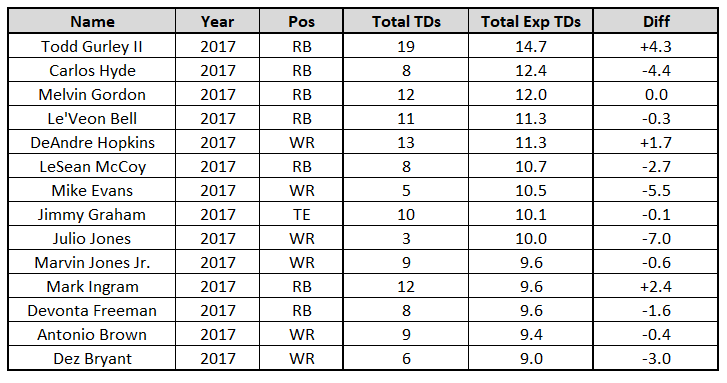
Without further ado, here were last season’s leaders in expected touchdowns:
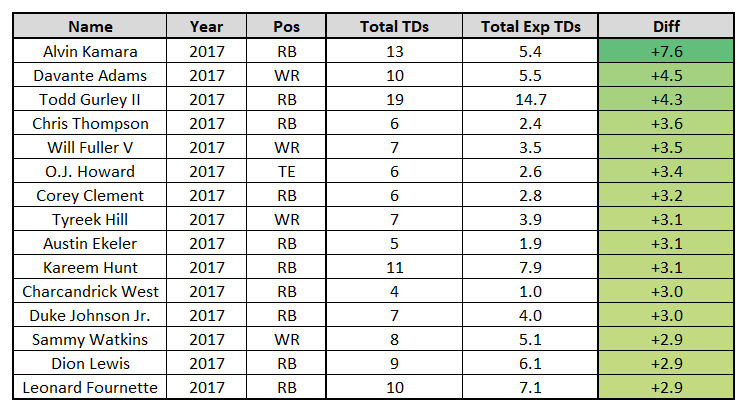
Here were the 15 players who most exceeded their touchdown expectation, or rather, the players most likely to regress in the touchdown department next year if their expectation doesn’t also climb:
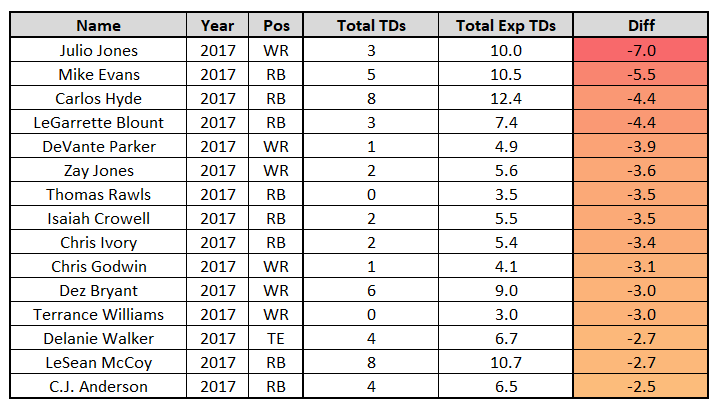
Here were the 15 least efficient touchdown scorers last season, or rather, the players most likely to positively regress in the touchdown department next year if their expectation doesn’t also shrink:
Here’s what stood out to me:
Julio Jones, WR, Atlanta Falcons
Jones’ -7.0 touchdown differential is not only the worst of any player this season, but also the second-worst of any player this past decade. Only Matt Forte in 2009 was worse, but Forte did manage to increase his touchdown total by five in the following year. I suppose that is the good news here. Like with all metrics, and especially with touchdowns, outliers tend to regress closer to the mean in the following season. It’s very unlikely Jones will get this unlucky again in 2018 if he sees similar volume. This is especially true considering Jones was highly touchdown-efficient prior to last season, scoring 40 career touchdowns on a 34.6 expectation.
Alvin Kamara, RB, New Orleans Saints
On the opposite end of the spectrum, Kamara seems due for a massive touchdown regression (+7.6). This was the third-largest positive differential this past decade, behind only 2008 DeAngelo Williams and 2011 Jordy Nelson. For reference, Williams and Nelson combined to score 21 fewer touchdowns the next season. This is a common theme among players ranking highly in touchdown efficiency. Of the 75 most touchdown-efficient seasons of the past decade, only eight players saw more touchdowns in the following season. (Coincidentally, one of these players was Julio Jones.) The good news, however, is that hyper-efficient touchdown scorers do tend to rank higher in expected touchdowns the following year. So, hopefully, increased volume (and increased near-end-zone volume) will help offset the looming regression.
Jimmy Graham, TE, Green Bay Packers
Graham saw 14 targets inside the 5-yard line last season, which is the most by any player this past decade. This helped lift him to the largest touchdown expectation among tight ends, and he was fairly efficient, scoring 10 touchdowns on a 10.1 expectation. An issue for Graham is that this number seems unlikely to be repeated next season. Only once has a Green Bay tight end totaled more than 5.5 expected touchdowns in a single season and only four times did that number eclipse 3.5 since 2007. Though Jordy Nelson did reach 11.8 expected touchdowns in 2016, so maybe Graham assumes the bulk of that with Nelson now in Oakland.
Davante Adams, WR, Green Bay Packers
Adams ranks behind Kamara as our top touchdown regression candidate. What’s interesting about Adams’ efficiency last season (+4.5) is that he did this while drawing 61 percent of his targets from Brett Hundley. Hopefully a healthy Aaron Rodgers will help negate some of the looming regression. Green Bay's wide receivers have totaled +50.6 more touchdowns than their expectation over the past 10 seasons, which leads the league over this stretch, and the next-closest team (Dallas) finished far behind with just +37.9. Adams could also see a larger expectation next year as well, with Rodgers’ preferred near-end-zone target Nelson leaving for Oakland.
Other negative regression candidates – Other candidates were a little more obvious. Todd Gurley was fantastic last year but it’s hard to maintain such elite levels of efficiency. Same too for Will Fuller, who averaged one touchdown every four receptions, or O.J. Howard, who averaged one touchdown every 4.3 receptions. Tyreek Hill saw just one target inside the 10-yard line, just four targets inside the red zone, and totaled just five end-zone targets, but still, he overachieved in the touchdown department. Unless he is again the league’s most efficient deep-ball receiver, I suspect he’ll decline in touchdowns next year. Leonard Fournette also isn’t likely to score multiple 75-plus-yard touchdowns again next season, which certainly helped bolster his touchdown efficiency numbers last season.
Other positive regression candidates – Despite ranking second in end-zone targets (20), Mike Evans was our second-least-efficient touchdown scorer. Considering he ranked about average in touchdown efficiency throughout the rest of his career (27 touchdowns on a 27.9 expectation), and it’s unlikely his near-end-zone volume declines significantly, I expect him to score more touchdowns next year. LeGarrette Blount’s ranking here was something of a surprise considering how many touchdowns he’s scored throughout his career, but he has been historically overrated as a goal-line and short-yardage back. Chris Godwin’s ranking was also something of a surprise, and this may have something to do with Tampa Bay’s quarterback situation last year (we just noted Evans ranked poorly as well), but he was so efficient in all other categories I’m not worried long term. Delanie Walker and LeSean McCoy have both been about average at scoring touchdowns throughout their career, so both should improve in this category next year. Outside of that, there weren’t too many surprises. A lot of the players in this chart also underwhelmed in other categories. Carlos Hyde, Isaiah Crowell, and Chris Ivory all graded bottom-12 at their position, as did Zay Jones among wide receivers.
Historically efficient touchdown scorers – Over the past decade, the most efficient touchdown scorers are, in order, Adrian Peterson (+25.9), Rob Gronkowski (+25.4), DeAngelo Williams (+21.9), Jamaal Charles (+20.8), Antonio Gates (+17.9), Darren Sproles (+17.4), Greg Jennings (+16.9), Jordy Nelson (+16.0), Dez Bryant (+14.1), and Doug Baldwin (+13.8). It’s interesting Sproles ranked so highly here, and maybe that’s good news for Kamara (who is used in a somewhat similar role to how Sproles was used in New Orleans). It’s interesting to see Bryant here as well, despite scoring three touchdowns below expectation last year. Perhaps he rebounds in this category next season, once he finds a team. On the opposite end of the spectrum, Pierre Garcon (-10.0) and Alshon Jeffery (-9.8) ranked ninth- and 10th-worst, respectively, in touchdown efficiency over the past decade. Perhaps these are two players to devalue in standard scoring leagues.
