
Touchdowns are extremely valuable in fantasy football, but they’re also rare events, mostly random, and extremely hard to predict. At each position, touchdowns were far less sticky (showing a much lower correlation year-over-year) than targets, receptions, carries, or yards. We also know that players who ranked highly in touchdowns in one year tend to regress closer to the mean in the following season. Over the past decade, there have been 121 instances of a flex-eligible player recording more than 10 touchdowns in one season and also play in at least one game in the following year. Only 11% of those players saw an increase in touchdowns, and, on average, each player lost about 5.4 touchdowns from their prior-season total.
So, we know touchdowns are extremely important for fantasy football but extremely difficult to predict. We also know it’s valuable to pinpoint looming touchdown regression candidates. But what’s the best method for evaluating this?
Efficiency and athletic ability certainly do play a role in touchdown scoring, but for the most part, touchdowns are far more a function of a player’s opportunity. The more opportunities you see and the more opportunities you see closer to the end zone, the more likely you are to score a high number of touchdowns. Though frequently cited, red-zone metrics aren’t very good at predicting touchdowns. The closer you are to the end zone the greater your chances of scoring, but that number starts shrinking rapidly, and well before you approach the edge of the red zone. So, for instance, rather than grouping carries from the 1-yard line (53.9% chance of scoring) in with carries from the 17-yard line (3.7% chance of scoring) and treating them the same, we’d be better off weighting each carry at each yard line by their actual degree of scoring probability.
Mike Clay first came up with this idea in 2013, and created a metric called oTD to improve upon red-zone metrics as a predictor for touchdowns. With Clay’s oTD as the inspiration, I attempted to calculate expected touchdowns by using a similar methodology to Clay’s and to how I calculate a player’s expected fantasy point numbers. Basically, I’m looking at each carry by distance from the end zone (and weighting each carry according to the average scoring rate on all identical carries since 2007) and looking at each target by distance from the end zone and depth of target (and weighting each specific target type based on the average scoring rate on all identical targets since 2007). The sum of these numbers gives us a player’s total expected touchdowns, or how many touchdowns we should expect a perfectly average player to score on an identical workload. We can contrast this with a player’s total touchdowns to measure their efficiency.
After testing this, I found expected touchdowns were even stronger at predicting touchdowns in the following season as raw touchdowns (0.282 to 0.277 r^2) and far stickier year-over-year (0.381 to 0.277 r^2).
Without further ado, by contrasting expected touchdowns with actual touchdowns, here are the players most likely to regress in touchdowns next season.
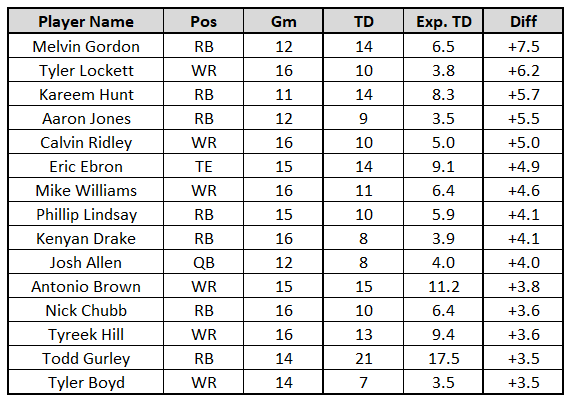
Melvin Gordon, RB, Los Angeles Chargers
Fantasy points per game in 2018: 23.0
Fantasy points per game in 2018 if perfectly average in touchdown efficiency: 19.2
Last season Gordon exceeded his touchdown expectation by 7.5 touchdowns, the third-largest positive differential by any running back this past decade. Gordon scored on all of his opportunities inside the 5-yard line and on nine of his 12 opportunities inside the 10-yard-line. That sort of efficiency is bound to regress (and significantly so), but with that regression, he should also see an increase in near-end-zone work (boosting his expectation next year). So, in terms of total touchdowns, his regression shouldn’t be too bad.
Tyler Lockett, WR, Seattle Seahawks
PPR/G: 13.9
TDadj-PPR/G: 11.6
Lockett, however, is a far more glaring regression candidate. Last season, Lockett saw zero targets inside the 5-yard line, zero inside the 10, five inside the 20 (77th), and eight inside the end zone (29th). Absurdly, he ranked 52nd among wide receivers in expected touchdowns but sixth in actual touchdowns. Lockett averaged 31.1 yards per touchdown, which ranked fifth-most among all wide receivers with at least six touchdowns. Doug Baldwin always ranked highly in this metric, so maybe Lockett’s hyper-efficiency is also partly a function of good quarterback-play, and he is an elite deep threat who doesn’t need to rely too much on near-end-zone work, but, still, he’s a strong bet to decline in this department next season.
Kareem Hunt, RB, Cleveland Browns
PPR/G: 20.9
TDadj-PPR/G: 17.8
Over the past two seasons, Hunt ranks second in both PFF grade and missed tackles forced per touch. He’s one of the best running backs in football, and now the best backup in football. Just keep in mind regarding Damien Williams’ ADP, near-end-zone volume might not be as good as Hunt’s production has implied. Over the past two seasons, Hunt ranks fourth in touchdowns (25), eighth in expected touchdowns (16.3), and second in differential (+8.7).
Aaron Jones, RB, Green Bay Packers
PPR/G: 14.3
TDadj-PPR/G: 11.6
Similarly, Jones has easily been one of the league’s most efficient running backs over the past two seasons, leading all running backs over this stretch in PFF rushing grade (90.4) and yards per carry average (5.54). So, I’m less concerned with his efficiency as some of the other running backs on this list. Just, hopefully, he finally starts to see the near-end-zone volume he deserves. Over the past two seasons he totals 5.1 expected touchdowns (13 total touchdowns), far less than Jamaal Williams’ 9.1 (9 total).
Calvin Ridley, WR, Atlanta Falcons
PPR/G: 12.9
TDadj-PPR/G: 11.0
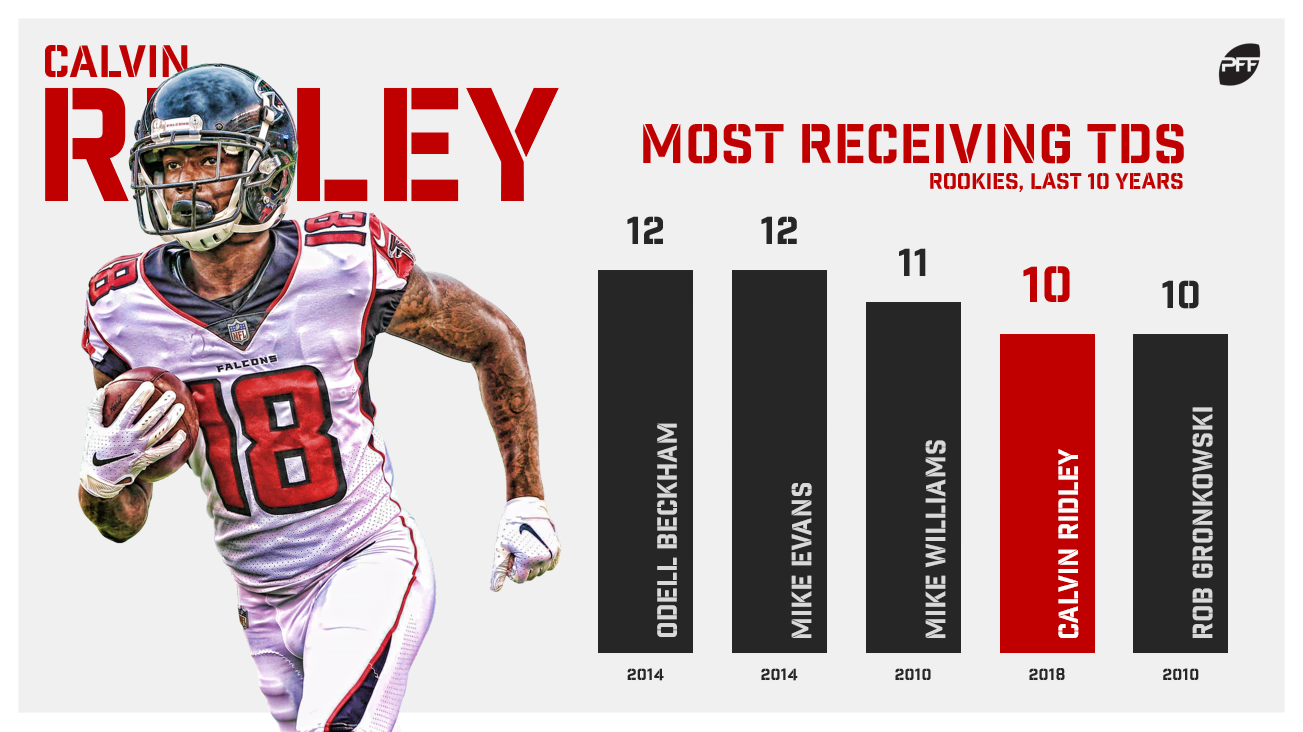
Ridley, like Lockett, is another glaring regression candidate. He scored 5.0 touchdowns over his expectation in 2018, the 12th-largest differential this past decade. This efficiency is bound to regress, but hopefully gets somewhat offset by an increase in volume. He was efficient enough in his rookie year (by other metrics) to warrant an increase in volume, but also, Dirk Koetter’s arrival should help volume too. Ridley totaled 97 targets last year, while Koetter’s WR2 (when he was Atlanta’s OC) averaged 116.7 targets per season.
Eric Ebron, TE, Indianapolis Colts
PPR/G: 13.9
TDadj-PPR/G: 11.9
Ebron was about average in touchdown efficiency throughout the rest of his career (+0.5) but exploded in 2018 (+4.9). That number is bound to regress, as should volume alongside the healthy return of Jack Doyle.
Mike Williams, WR, Los Angeles Chargers
PPR/G: 11.3
TDadj-PPR/G: 9.5
More than any player we’ve mentioned thus far, Williams seems the most likely to come crashing down to earth. He scored 4.6 touchdowns above his expectation, which ranks as the 18th-largest positive differential this past decade. He ranked fifth in touchdowns (10) but just 19th in expected touchdowns (6.4), implying volume wasn’t nearly as good as his production implied. On top of that, he was far too reliant on touchdowns for fantasy points. In total, 33% of his fantasy points came on touchdowns, which ranked third-most among wide receivers, and he averaged just 41.5 receiving yards per game (55th).
Phillip Lindsay, RB, Denver Broncos
Kenyan Drake, RB, Miami Dolphins
Last season, Lindsay ranked 10th in touchdowns, but only 26th in expected touchdowns and 18th in positional expected touchdown market share. Similarly, Drake ranked 20th in touchdowns, but 40th in expected touchdowns and 16th in positional expected touchdown market share. If perfectly average in touchdown efficiency, Lindsay would have lost 1.7 fantasy points per game and Drake would have lost 1.5. Essentially, Lindsay would have fallen from 13th to 19th in fantasy points per game, while Drake would have fallen from 21st to 30th.
Josh Allen, QB, Buffalo Bills
PPR/G: 17.3
TDadj-PPR/G: 15.4
Allen is the only quarterback who made either chart. (In this exercise, we only looked a quarterback’s rushing production and expectation.) Although I like Allen as a late-round cheat code, due to his rushing upside, it’s unlikely his rushing production is as good as it was last year.
Todd Gurley, RB, Los Angeles Rams
PPR/G: 26.6
TDadj-PPR/G: 25.1
You can say Gurley is due for a regression (+3.5), but that was also massively the case in 2017 (+4.3) and 2015 (+3.6). Perhaps Gurley is just really good at scoring touchdowns. The bigger threat to Gurley, is a reduced workload near the end zone, following reports of arthritis in his knee and the team’s decision to draft Darrell Henderson. Over the past two seasons he totals 32.1 expected touchdowns (most at the position by 11.8) as well as a league-leading 86% (positional) expected touchdown market share. Gurley, of course, has a long way to fall (from best in the league), but this should be a major concern for fantasy owners.
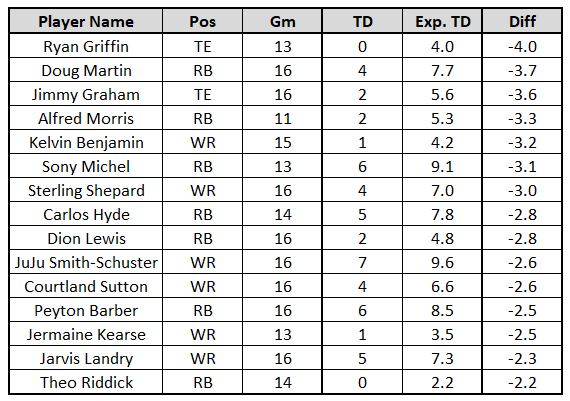
The most interesting names on this list, to me, are Jimmy Graham, Sony Michel, and JuJu Smith-Schuster. Graham has long been one of our most efficient touchdown scorers (+7.9), but he certainly struggled in this department last year (-3.6). It’s hard to tell whether this was mostly due to variance, due to injuries, or if he’s already fallen off of the age cliff. Though Michel saw good near-end-zone volume (ranking 10th in expected touchdowns per game), serving in the LeGarrette Blount role in the offense, he wasn't very efficient (-3.1). Either, we should hope this number regresses closer to the mean next season, or this is another reason (to add to injury risk and the increasing buzz surrounding Damien Harris) to avoid Michel in 2019 drafts. Whereas Antonio Brown (+3.8) excelled in touchdown efficiency, Smith-Schuster faltered (-2.6). However, I’m not too worried. Smith-Schuster was far more efficient in 2018 (+2.8), and, in 2019, should finish somewhere in the middle of those two numbers.
Bonus: Who are the most efficient players at scoring touchdowns this past decade? That would be: Rob Gronkowski (+24.1), Jamaal Charles (+20.8), DeAngelo Williams (+20.0), Darren Sproles (+17.7), and Adrian Peterson (+16.9). The least-efficient? Brandon Marshall (-12.3), Matt Forte (-11.4), and Brian Hartline (-11.2). Among active players, Alvin Kamara (+11.0) and Alshon Jeffery (-9.8) stand out.
