What if I told you there was a fantasy football statistic that combined all of your favorite metrics (targets, air yards, rushing attempts, goal-line opportunities, red-zone opportunities, end-zone opportunities) into one and was more stable and about just as predictive fantasy points?
Or, would you like to know which running backs saw the best volume in 2018? Which wide receivers will have the most-valuable workload in 2019? Which tight ends were the most or least efficient at scoring fantasy points relative to opportunity?
All of these questions can be answered simply, using only one metric: expected fantasy points.
Essentially, expected fantasy points measures the value of a player’s role in one number — how many fantasy points we should expect a perfectly average player (in terms of efficiency) to score with an identical workload.
Expected fantasy points — explained
Here’s just exactly what goes into this metric, and why the variables chosen make this metric the perfect measurement of a player’s workload:
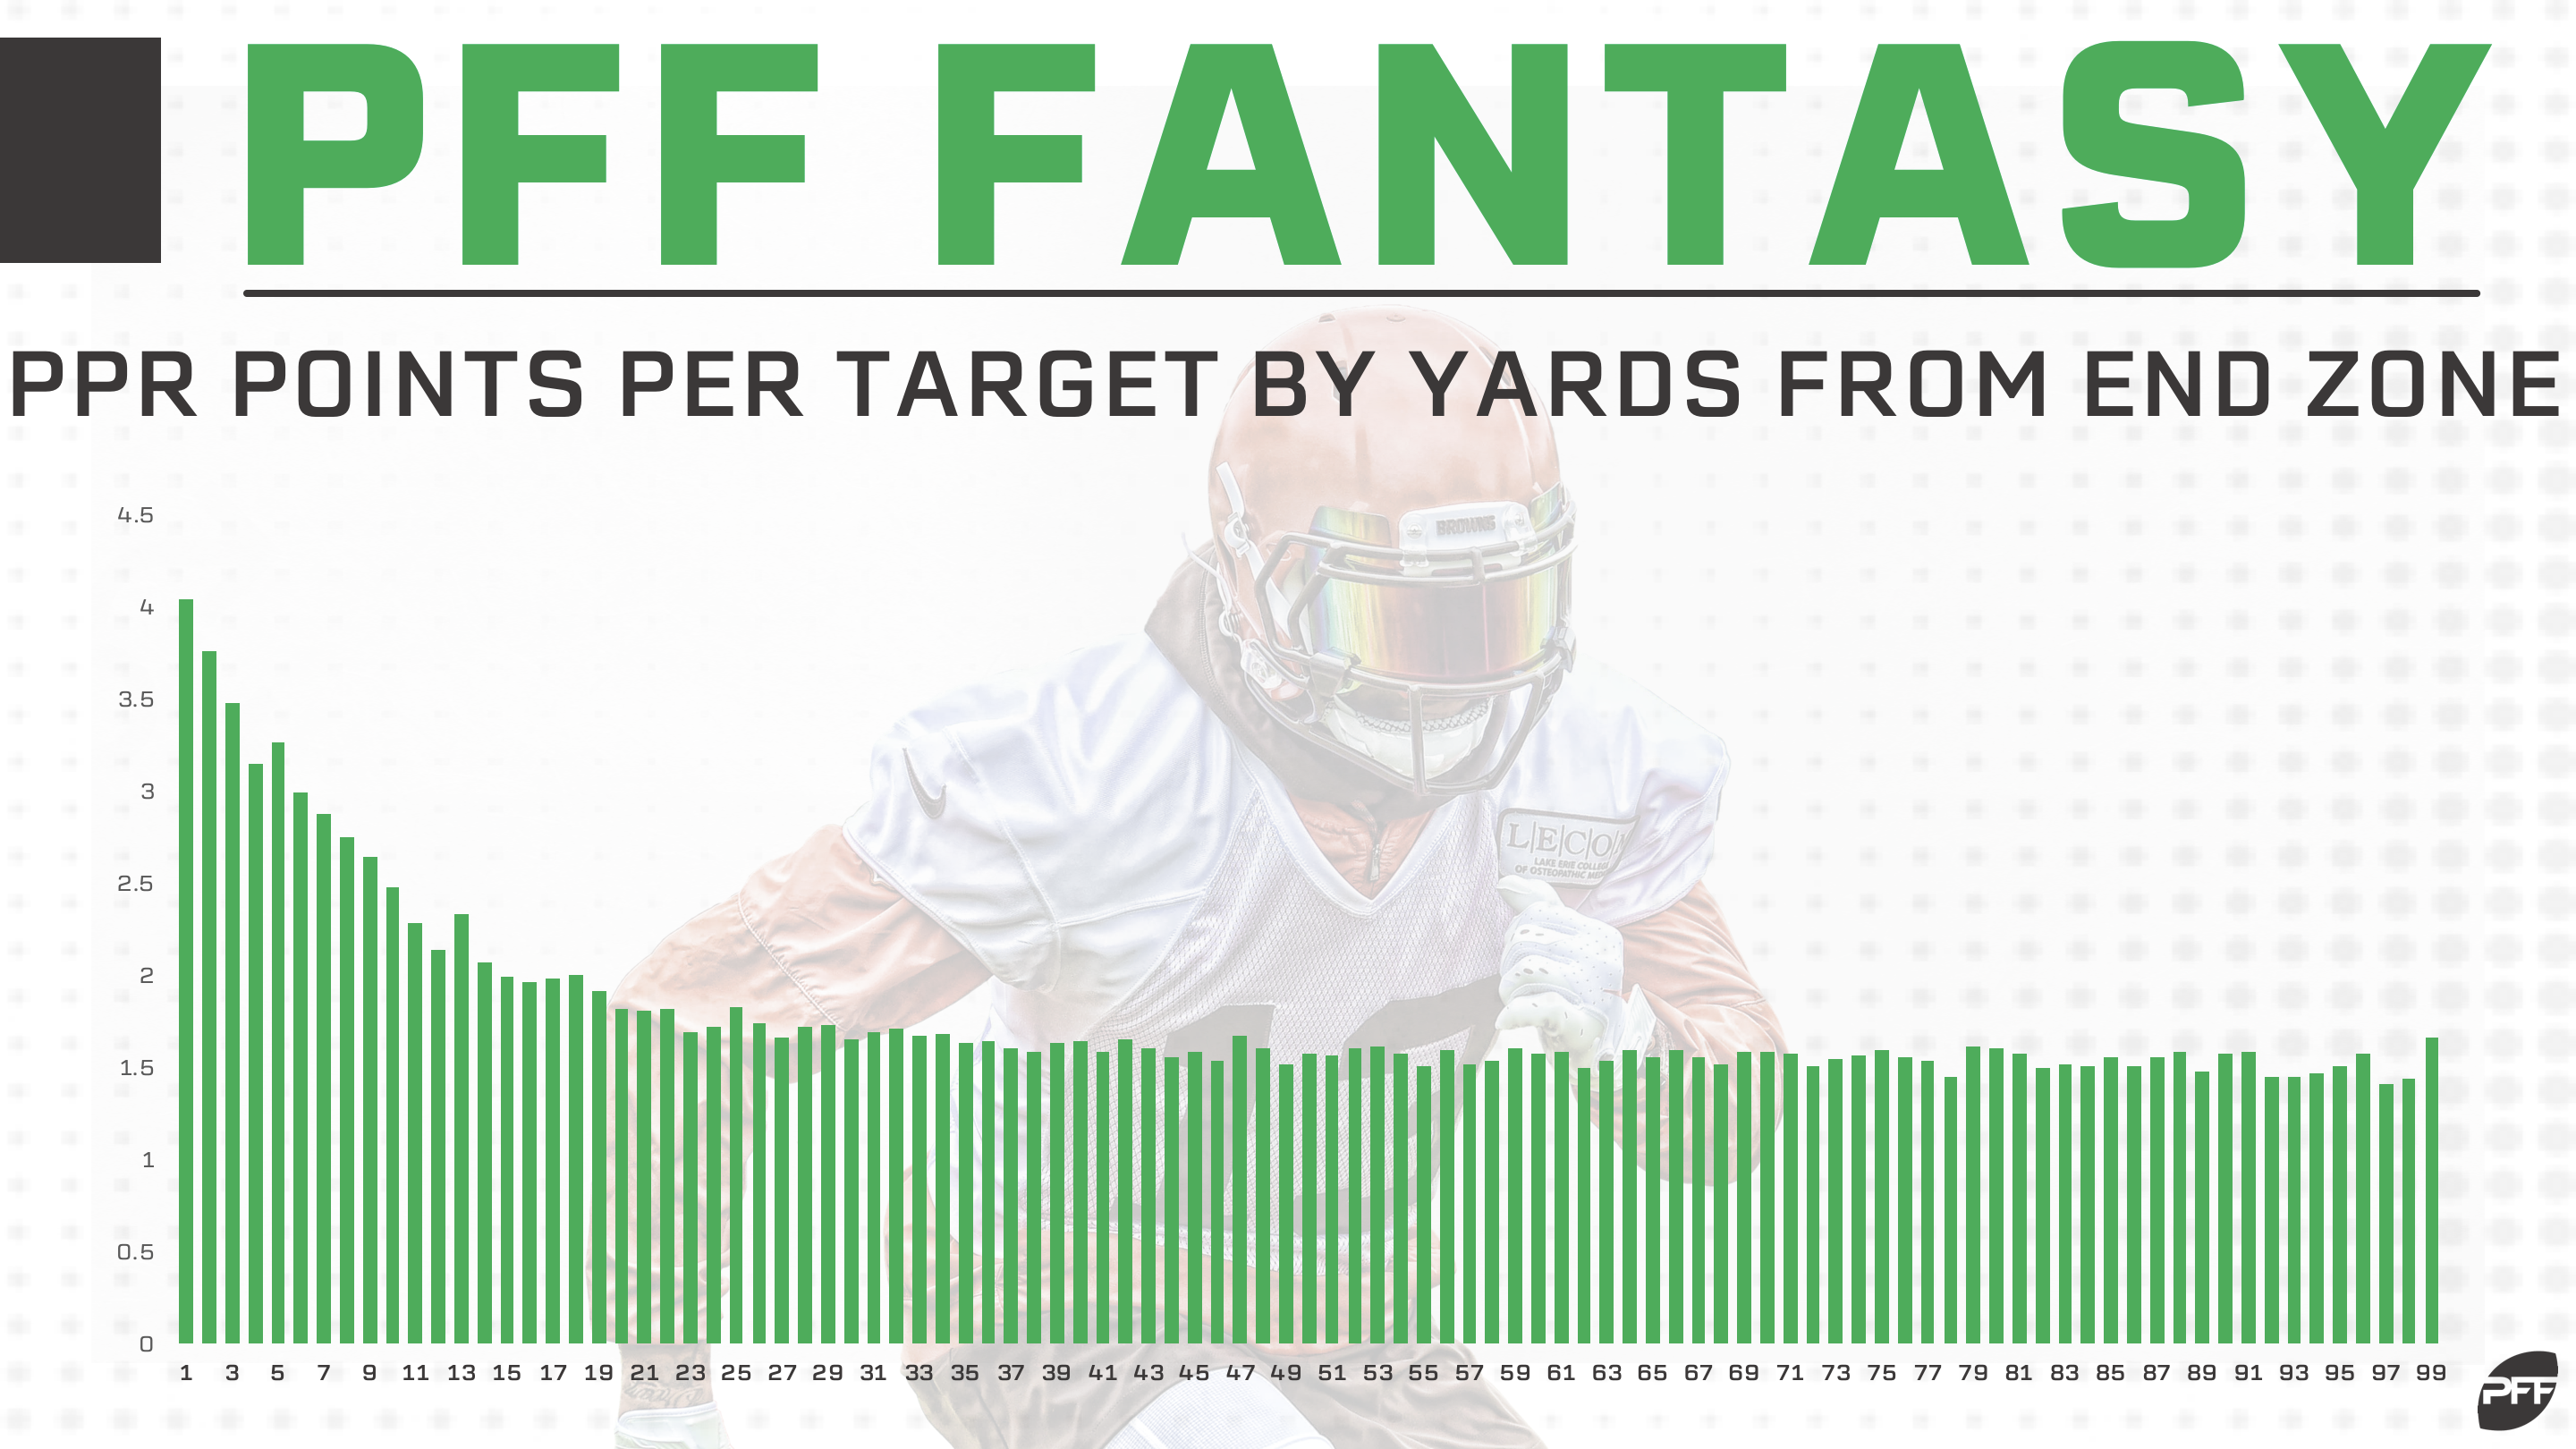
For wide receivers and tight ends, raw targets, with their 0.95 correlation to PPR fantasy points, is the obvious starting point. From there, we need to look at the value of each target — first, and most importantly, where the quarterback was when he was snapping the ball. Intuitively, the closer to the end zone you are, the more valuable the target for fantasy (the higher likelihood the receiver has of scoring). The metrics bear this out.
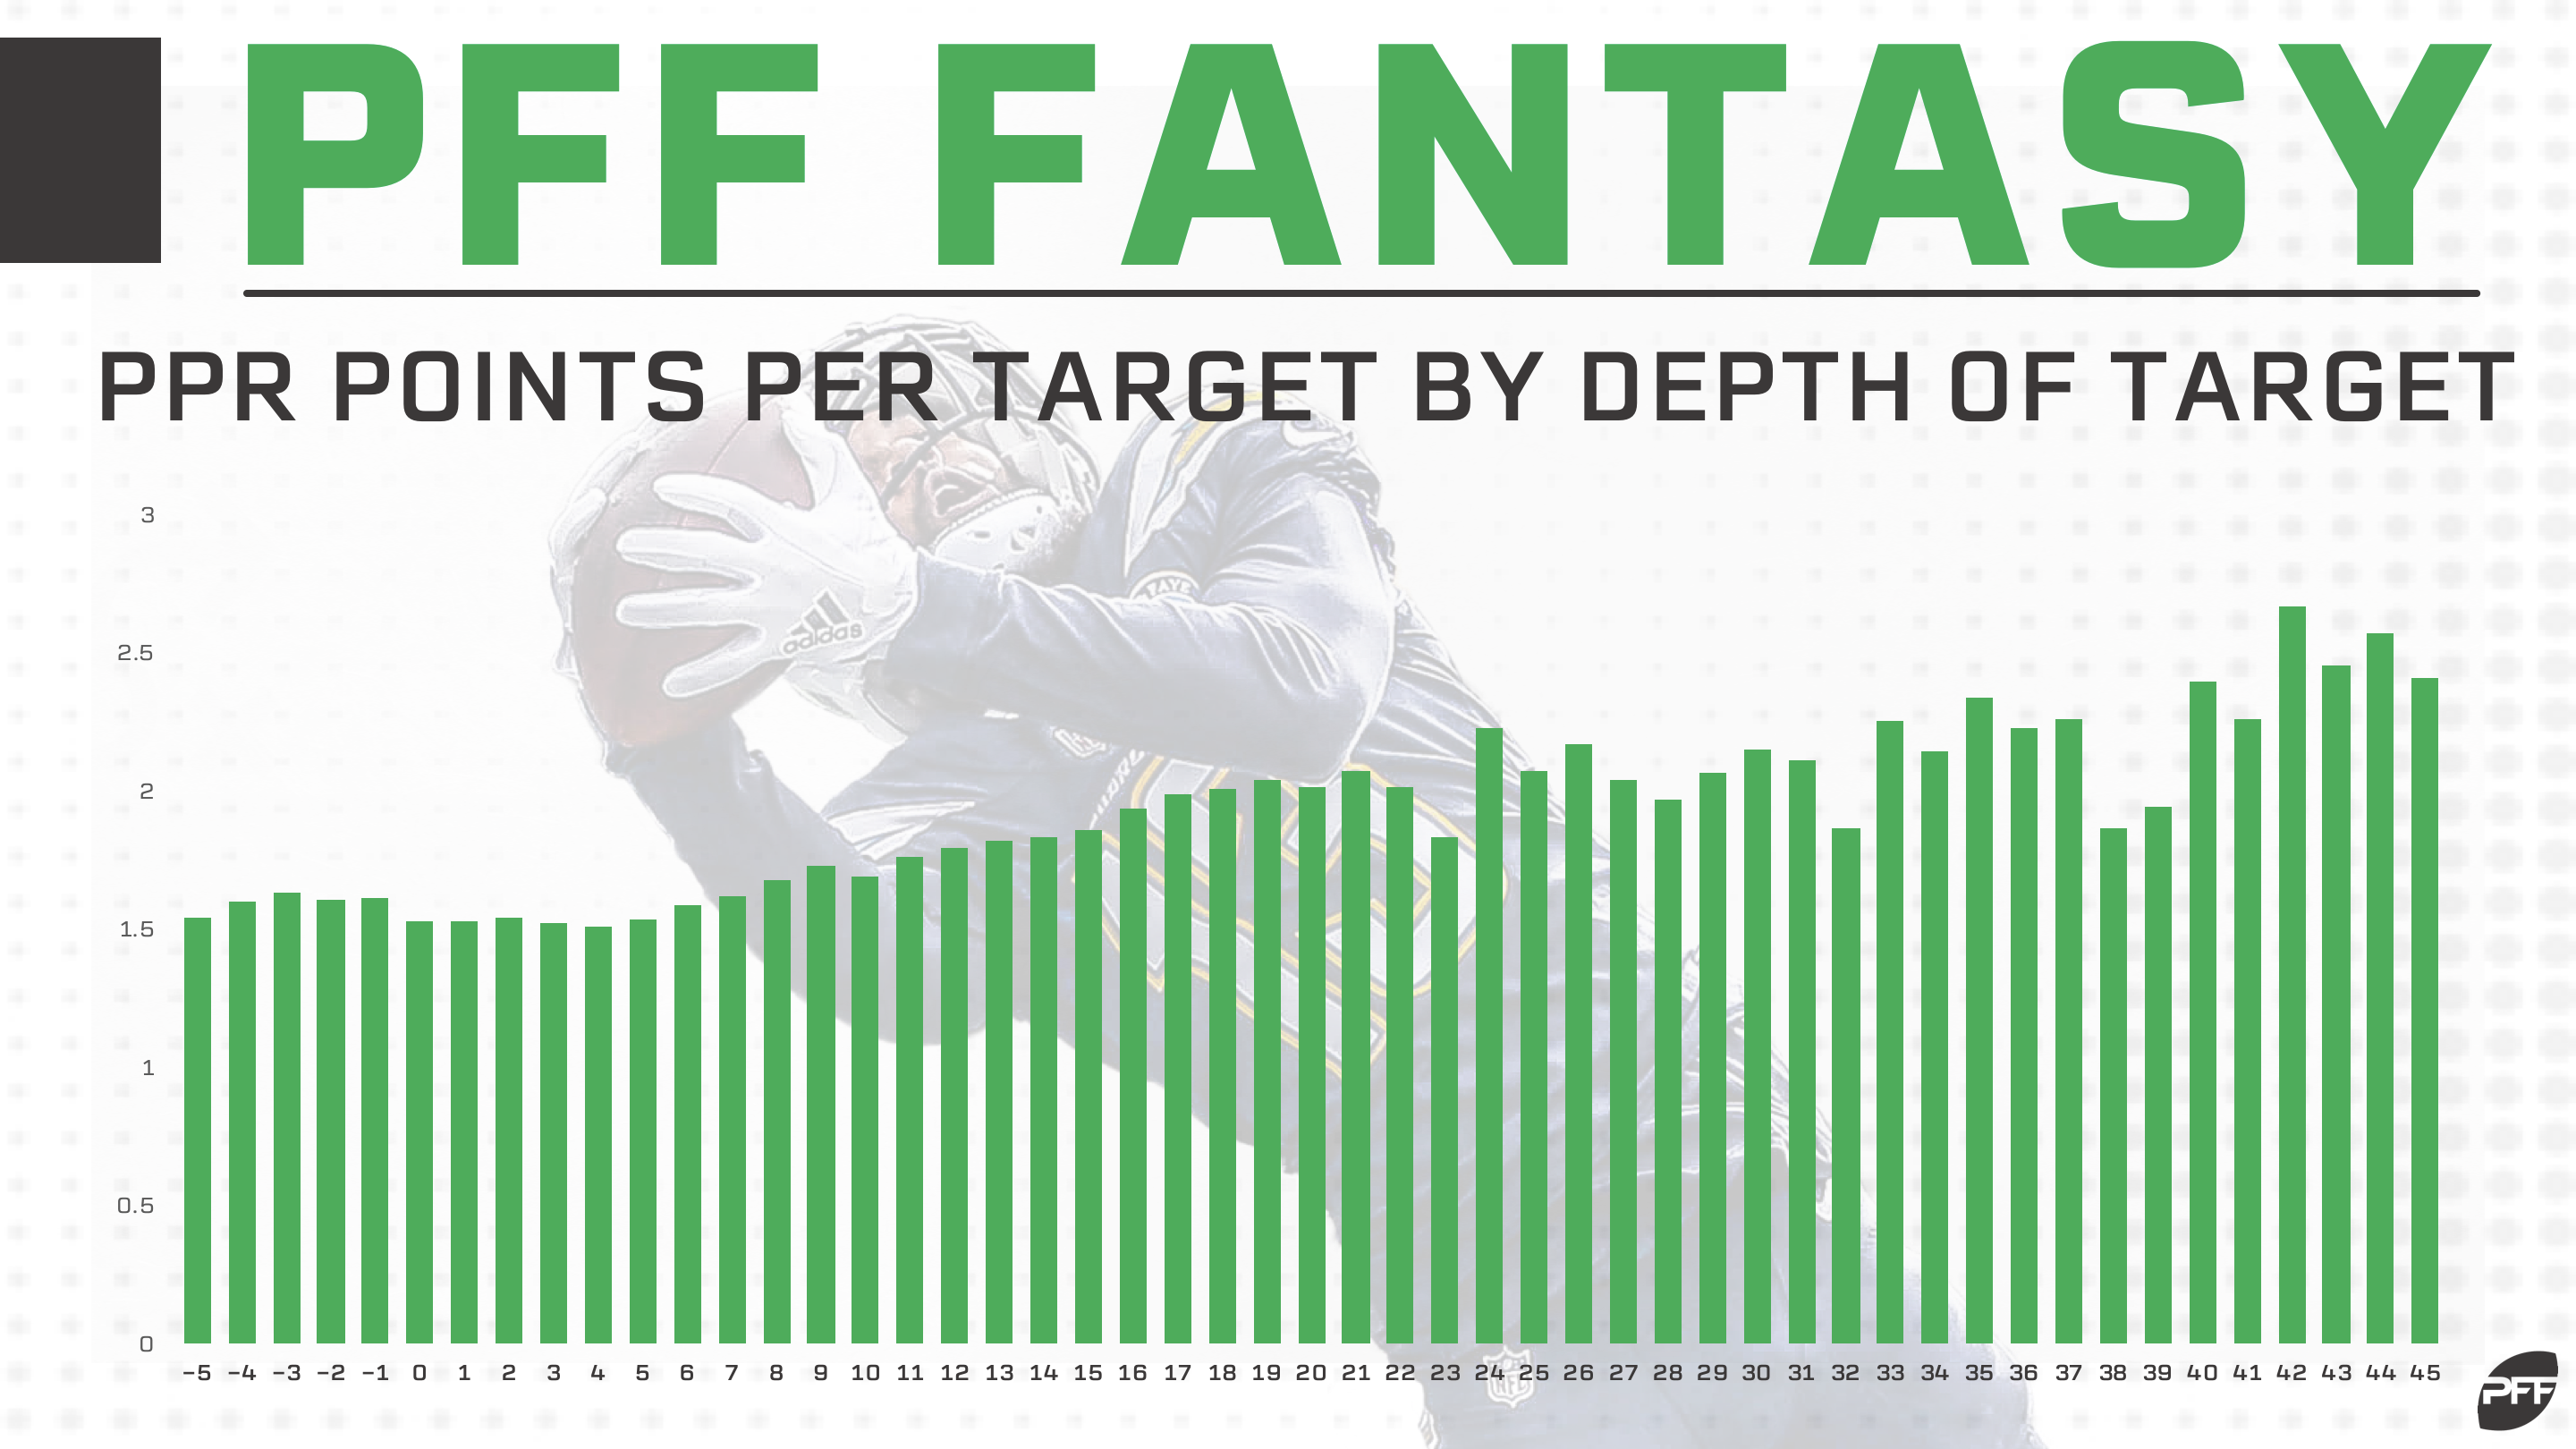
Beyond this, not all targets at the same line of scrimmage are actually worth the same. Targets with a higher depth of target have a higher expected value. For two important reasons, a ball thrown three yards from the line of scrimmage is worth less than one thrown 25 yards through the air. Although the expected catch rate is lower the farther the quarterback has to throw the ball, if caught, this receiver will have a 22-yard advantage (2.2 PPR fantasy points) and will be 22 yards closer to the end zone than the receiver seeing a target three yards out. This advantage outweighs the lower expected catch rate.
With running backs too, not all carries are worth the same. Like with receivers, the closer you are to the end zone when granted a carry, the more fantasy points you’re likely to score.
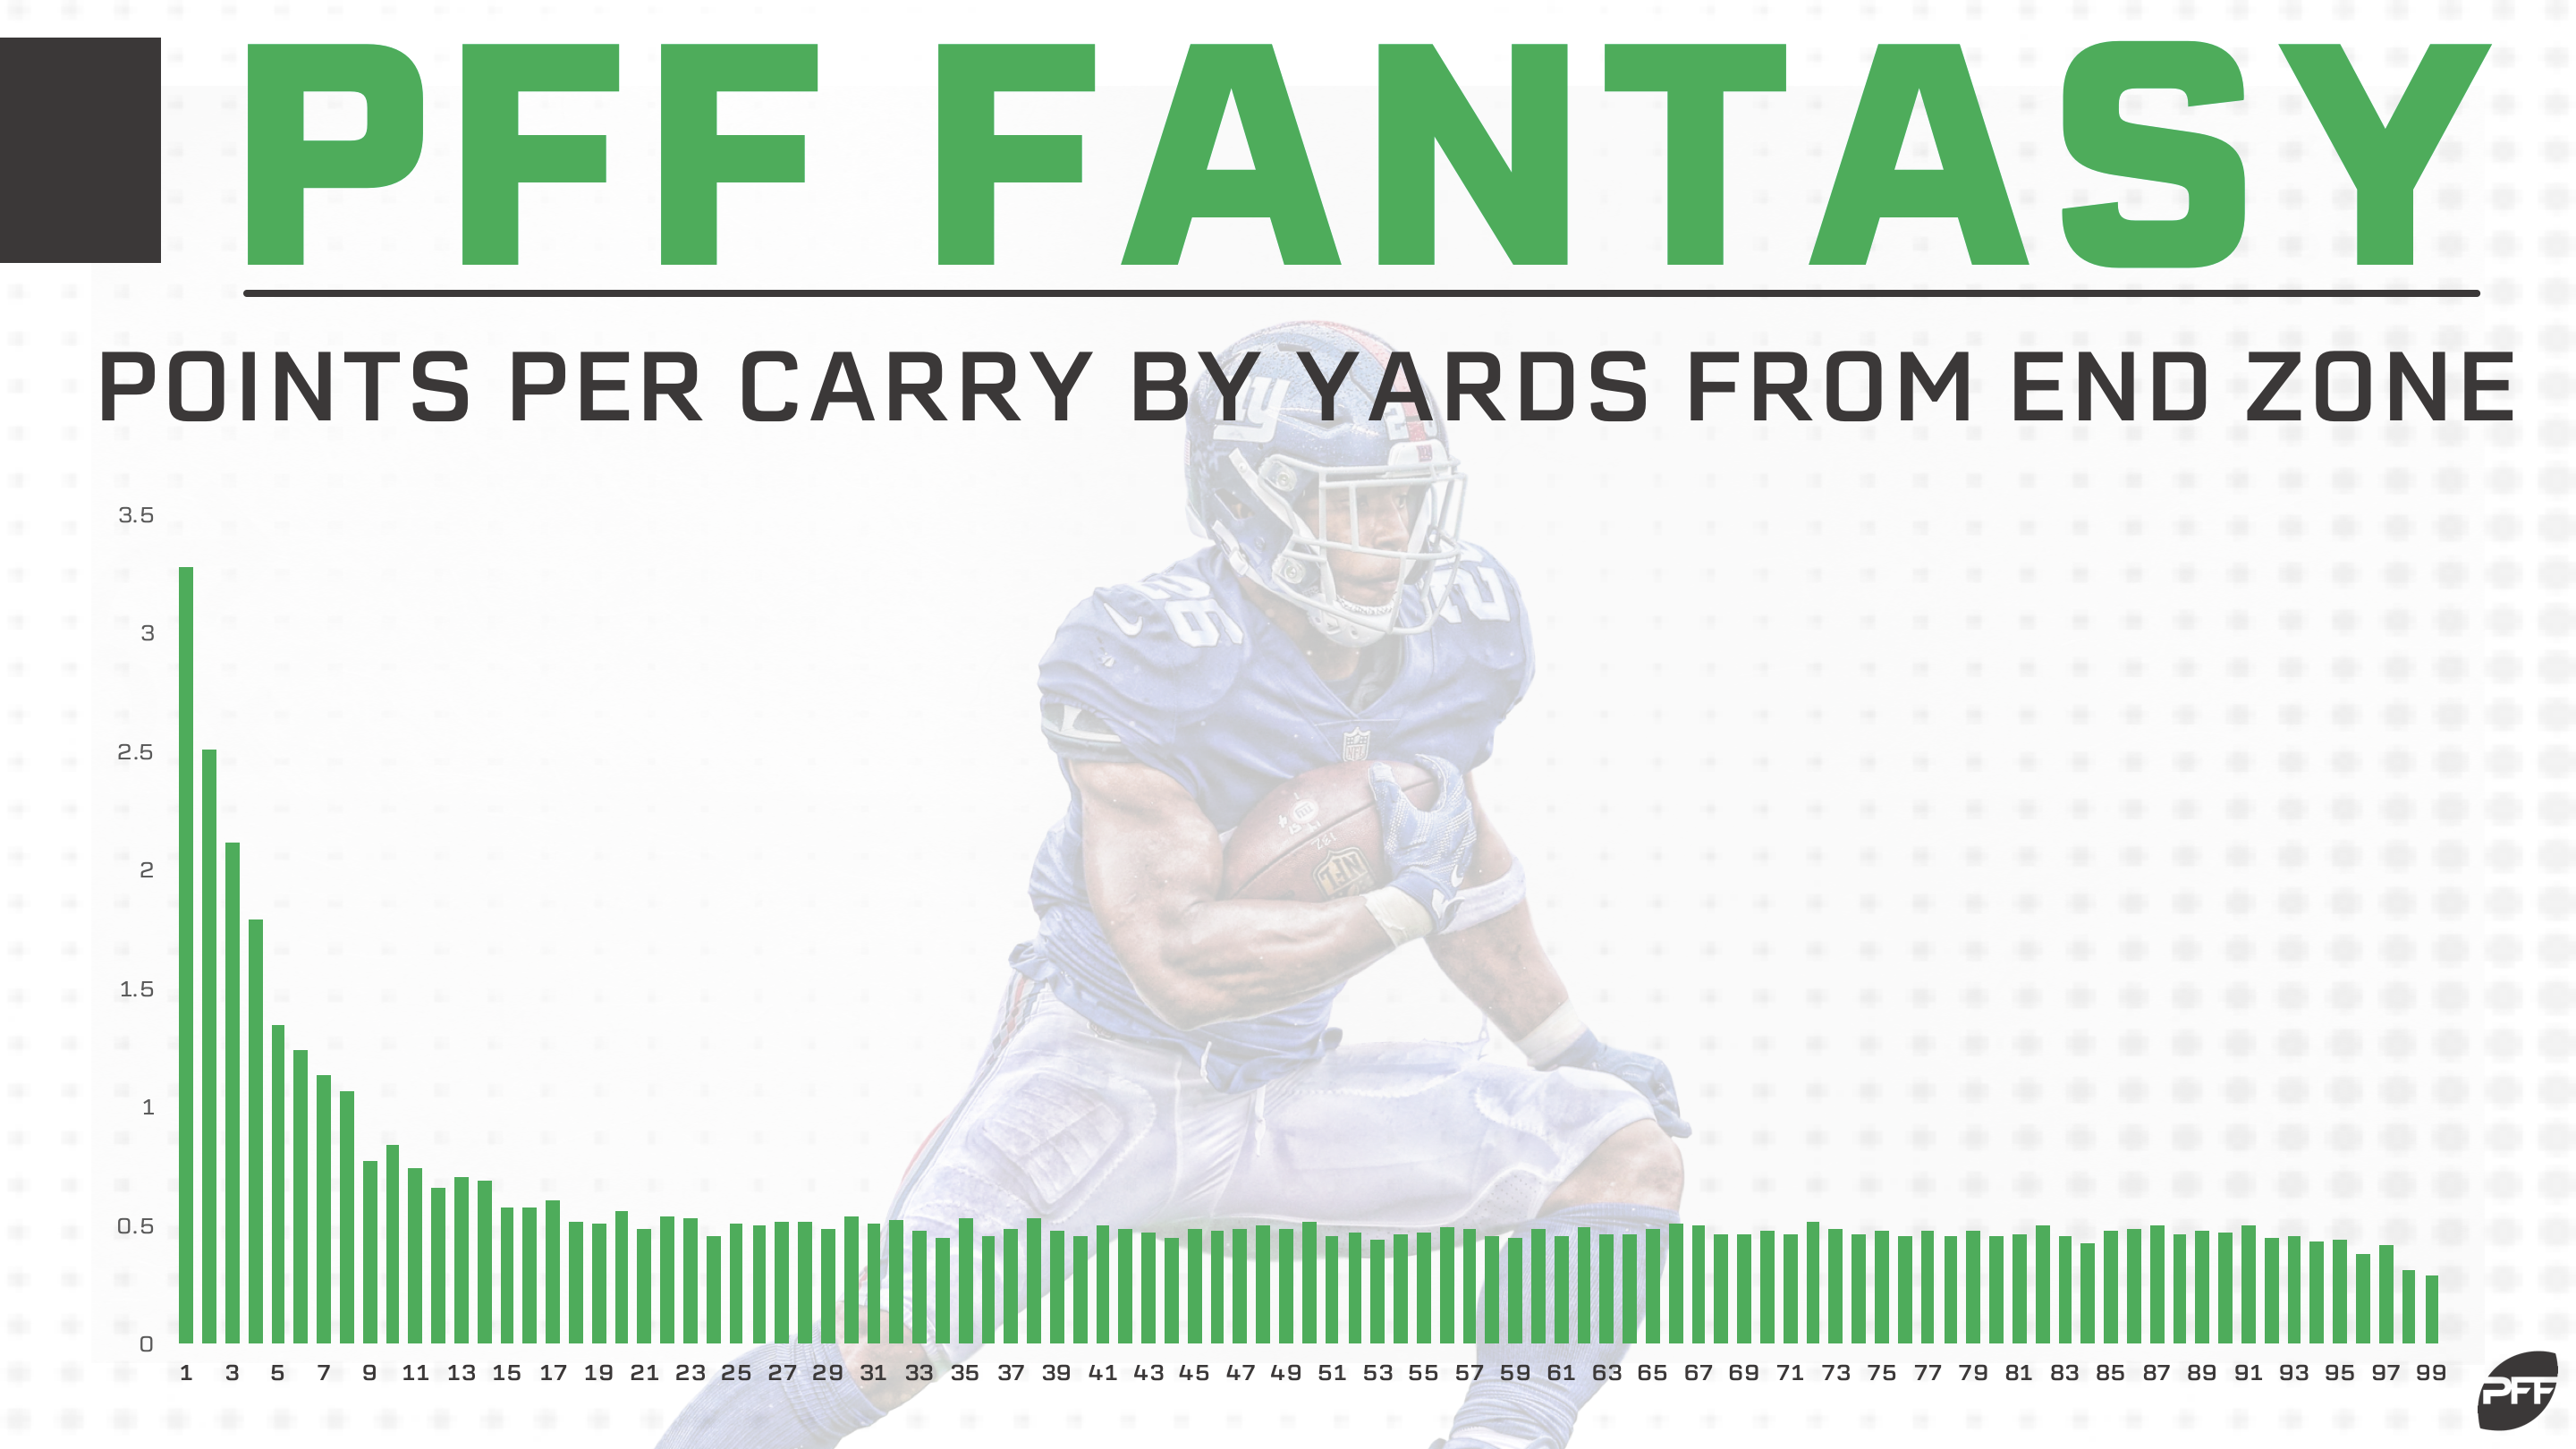
Yes, you’re reading this chart correctly. Red-zone rushing attempts, when that carry is between 10 and 20 yards from the red zone, are almost wholly irrelevant. This is why you’ll frequently see me referring to “expected touchdowns” (more stable and more predictive than actual touchdowns) rather than red-zone opportunities when measuring a particular player’s scoring potential.
Furthermore, a runner’s down and distance play a major role in expected fantasy points. If two running backs get the ball on the 50-yard line, the one rushing on first-and-15 will be more likely to outscore the running back rushing on fourth-and-1. The latter running back is at a disadvantage considering the opposing defense is likely predicting a run and will have more defenders stacked in the box.
Expected fantasy points calculates all of these important disparate factors to determine which players have the best workload for fantasy purposes over the course of a season or in any given week. We do this by looking at a 10-season sample and calculating the value of each target at each depth of target (air yards) and each line of scrimmage. For runners we look at each carry at each line of scrimmage at each down and distance. When we total these two numbers (rushing and receiving expected fantasy points), we can calculate any player’s total expected fantasy points for the season, or how many fantasy points a perfectly average player would have scored if given the same opportunity. We can also see how these players performed for fantasy purposes above or below their expectation.
As many fantasy football studies have shown, opportunity is more stable and predictive year or over year than any efficiency numbers. This will help us immensely for our 2019 redraft and week-to-week DFS projections — where we can project a player’s opportunity and then adjust it based on that player’s historical levels of efficiency. (As always, we’ll revisit this regularly in-season.)
Looking at raw expected fantasy point numbers, we can see which players — if we can expect similar roles in 2019 — are likely to finish atop fantasy leaderboards. If we look at expected fantasy points in terms of efficiency, we can see which players may be likely to fall back down to earth or might be due for some positive regression in 2019. Or, if a player was particularly bad, who to avoid.
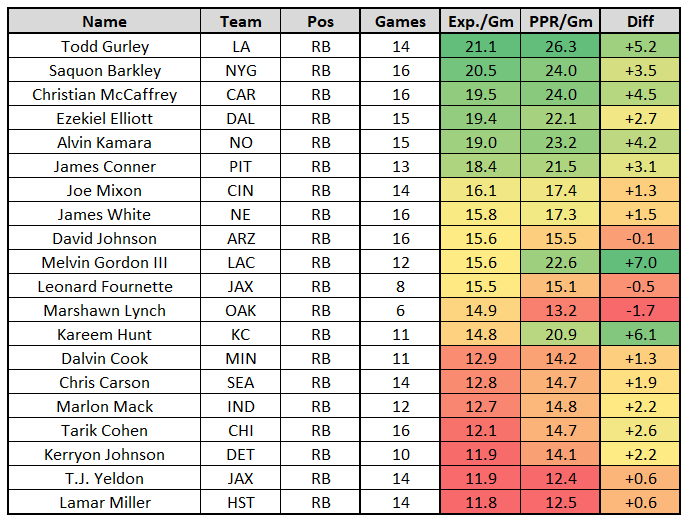
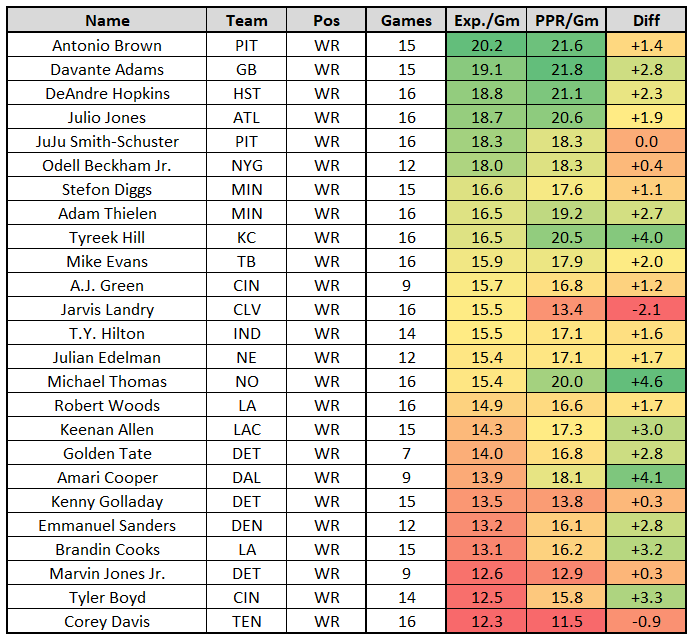
Without further ado, here are the leaders by each position in expected fantasy points per game last year. The charts below will be supplemented by a more in-depth writeup on each position and players who stood out most. These articles will go up live throughout this week.
(Notes: All references to expected fantasy points and actual fantasy points are in terms of PPR scoring.)
Running backs
Wide receivers
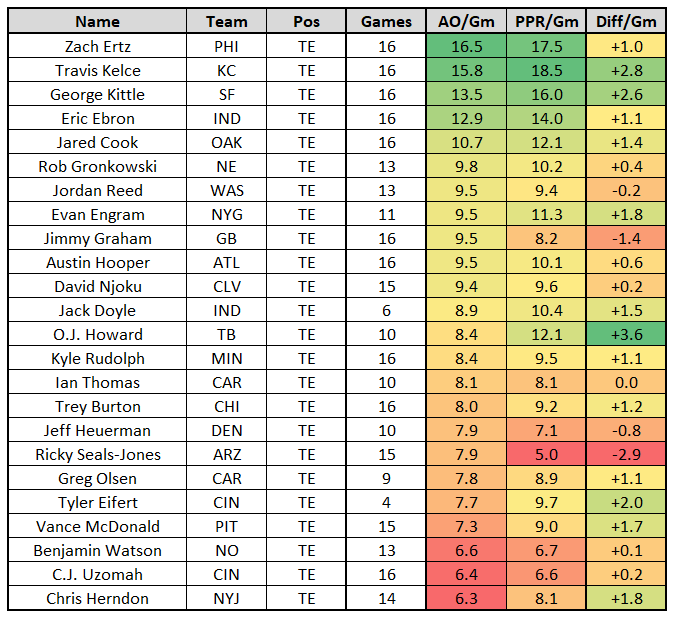
Tight ends