- How to utilize Bucs WRs: The projections assume Tampa Bay Buccaneers WRs Julio Jones and Chris Godwin will not play. If they end up being active, shift most of the CPT and FLEX allocation anyway from Russell Gage and Cole Beasley.
- CPT Value: The highest value in the CPT position is on Russell Gage while Jerick McKinnon is a low-probability and high-payoff selection.
- Flex Value: Mike Evans and Marquez Valdes-Scantling are the strongest value FLEX choices.
Estimated reading time: 6 minutes
We'll analyze all of the NFL’s “island” games (TNF, SNF and MNF) and playoff matchups this season for DFS purposes, utilizing PFF’s weekly projections, current betting lines and millions of simulated historical combinations to identify the best and worst values for an upcoming matchup.
There are five main components to this Showdown slate analysis that you’ll find below:
- A breakdown of methodology and the most similar historical matchup to this game: 2018 Week 8: Baltimore Ravens–Carolina Panthers, with Joe Flacco as Tom Brady and Cam Newton playing Patrick Mahomes‘ role.
- Optimal lineup allocations (CPT and total roster) for both teams based on the results of similar historical matchups.
- Comparison of player ownership projections for FLEX and CPT produced by a model trained on 2018-2022 Showdown contest results to optimal allocations.
- Recent CPT ownership trends are illustrated for both starting lineups.
- A table showing the most common players on optimal lineups for each player. This allows you to see which other players are commonly found on the same optimal lineups as a player you’re interested in rostering.
METHODOLOGY
To analyze this specific Showdown slate, I looked through thousands of NFL matchups from 2014 to 2022 and found the closest analogies to this contest according to the following parameters: Betting spread, over/under and average fantasy points scoring for the top-ranked positional players of both rosters (QB1, RB1, WR1, TE1).
I won’t detail every matchup that falls into the top 100 for this game, but for illustration purposes, let’s look at the most similar matchup:
| Historical | Current | ||||
| Player | Pos | Team | Player | Pos | Team |
| Joe Flacco | QB | BAL | Tom Brady | QB | TB |
| Alex Collins | RB | BAL | Leonard Fournette | RB | TB |
| John Brown | WR | BAL | Mike Evans | WR | TB |
| Mark Andrews | TE | BAL | Cameron Brate | TE | TB |
| Cam Newton | QB | CAR | Patrick Mahomes | QB | KC |
| Christian McCaffrey | RB | CAR | Clyde Edwards-Helaire | RB | KC |
| D.J. Moore | WR | CAR | JuJu Smith-Schuster | WR | KC |
| Devin Funchess | TE | CAR | Travis Kelce | TE | KC |
The spread and over/under are similar in these matchups (Ravens -2.5, 45.5 O/U versus this matchup at Chiefs -1, 45.5 O/U). All the players aren’t perfect matches, but that’s why we use 100 similar matchups and not just the single most similar.
The optimal roster for that historical matchup, assuming positional salaries equaled what they are for this showdown slate, would have been:
| Player | Team | Position | Roster Position | Fantasy Pts |
| Cam Newton | CAR | QB | CPT | 28.0 |
| Christian McCaffrey | CAR | RB | FLEX | 21.0 |
| Graham Gano | CAR | K | FLEX | 15.0 |
| Hayden Hurst | BAL | TE | FLEX | 10.9 |
| Curtis Samuel | CAR | WR | FLEX | 5.8 |
| Devin Funchess | CAR | TE | FLEX | 5.7 |
For this game and 99 other similar matchups, I calculated every possible combination that fits with Showdown rules (one CPT, at least one offensive player from each team) and would fall under the $50K salary threshold, assuming the salaries for the historical similar matchups are the same as those for this contest.
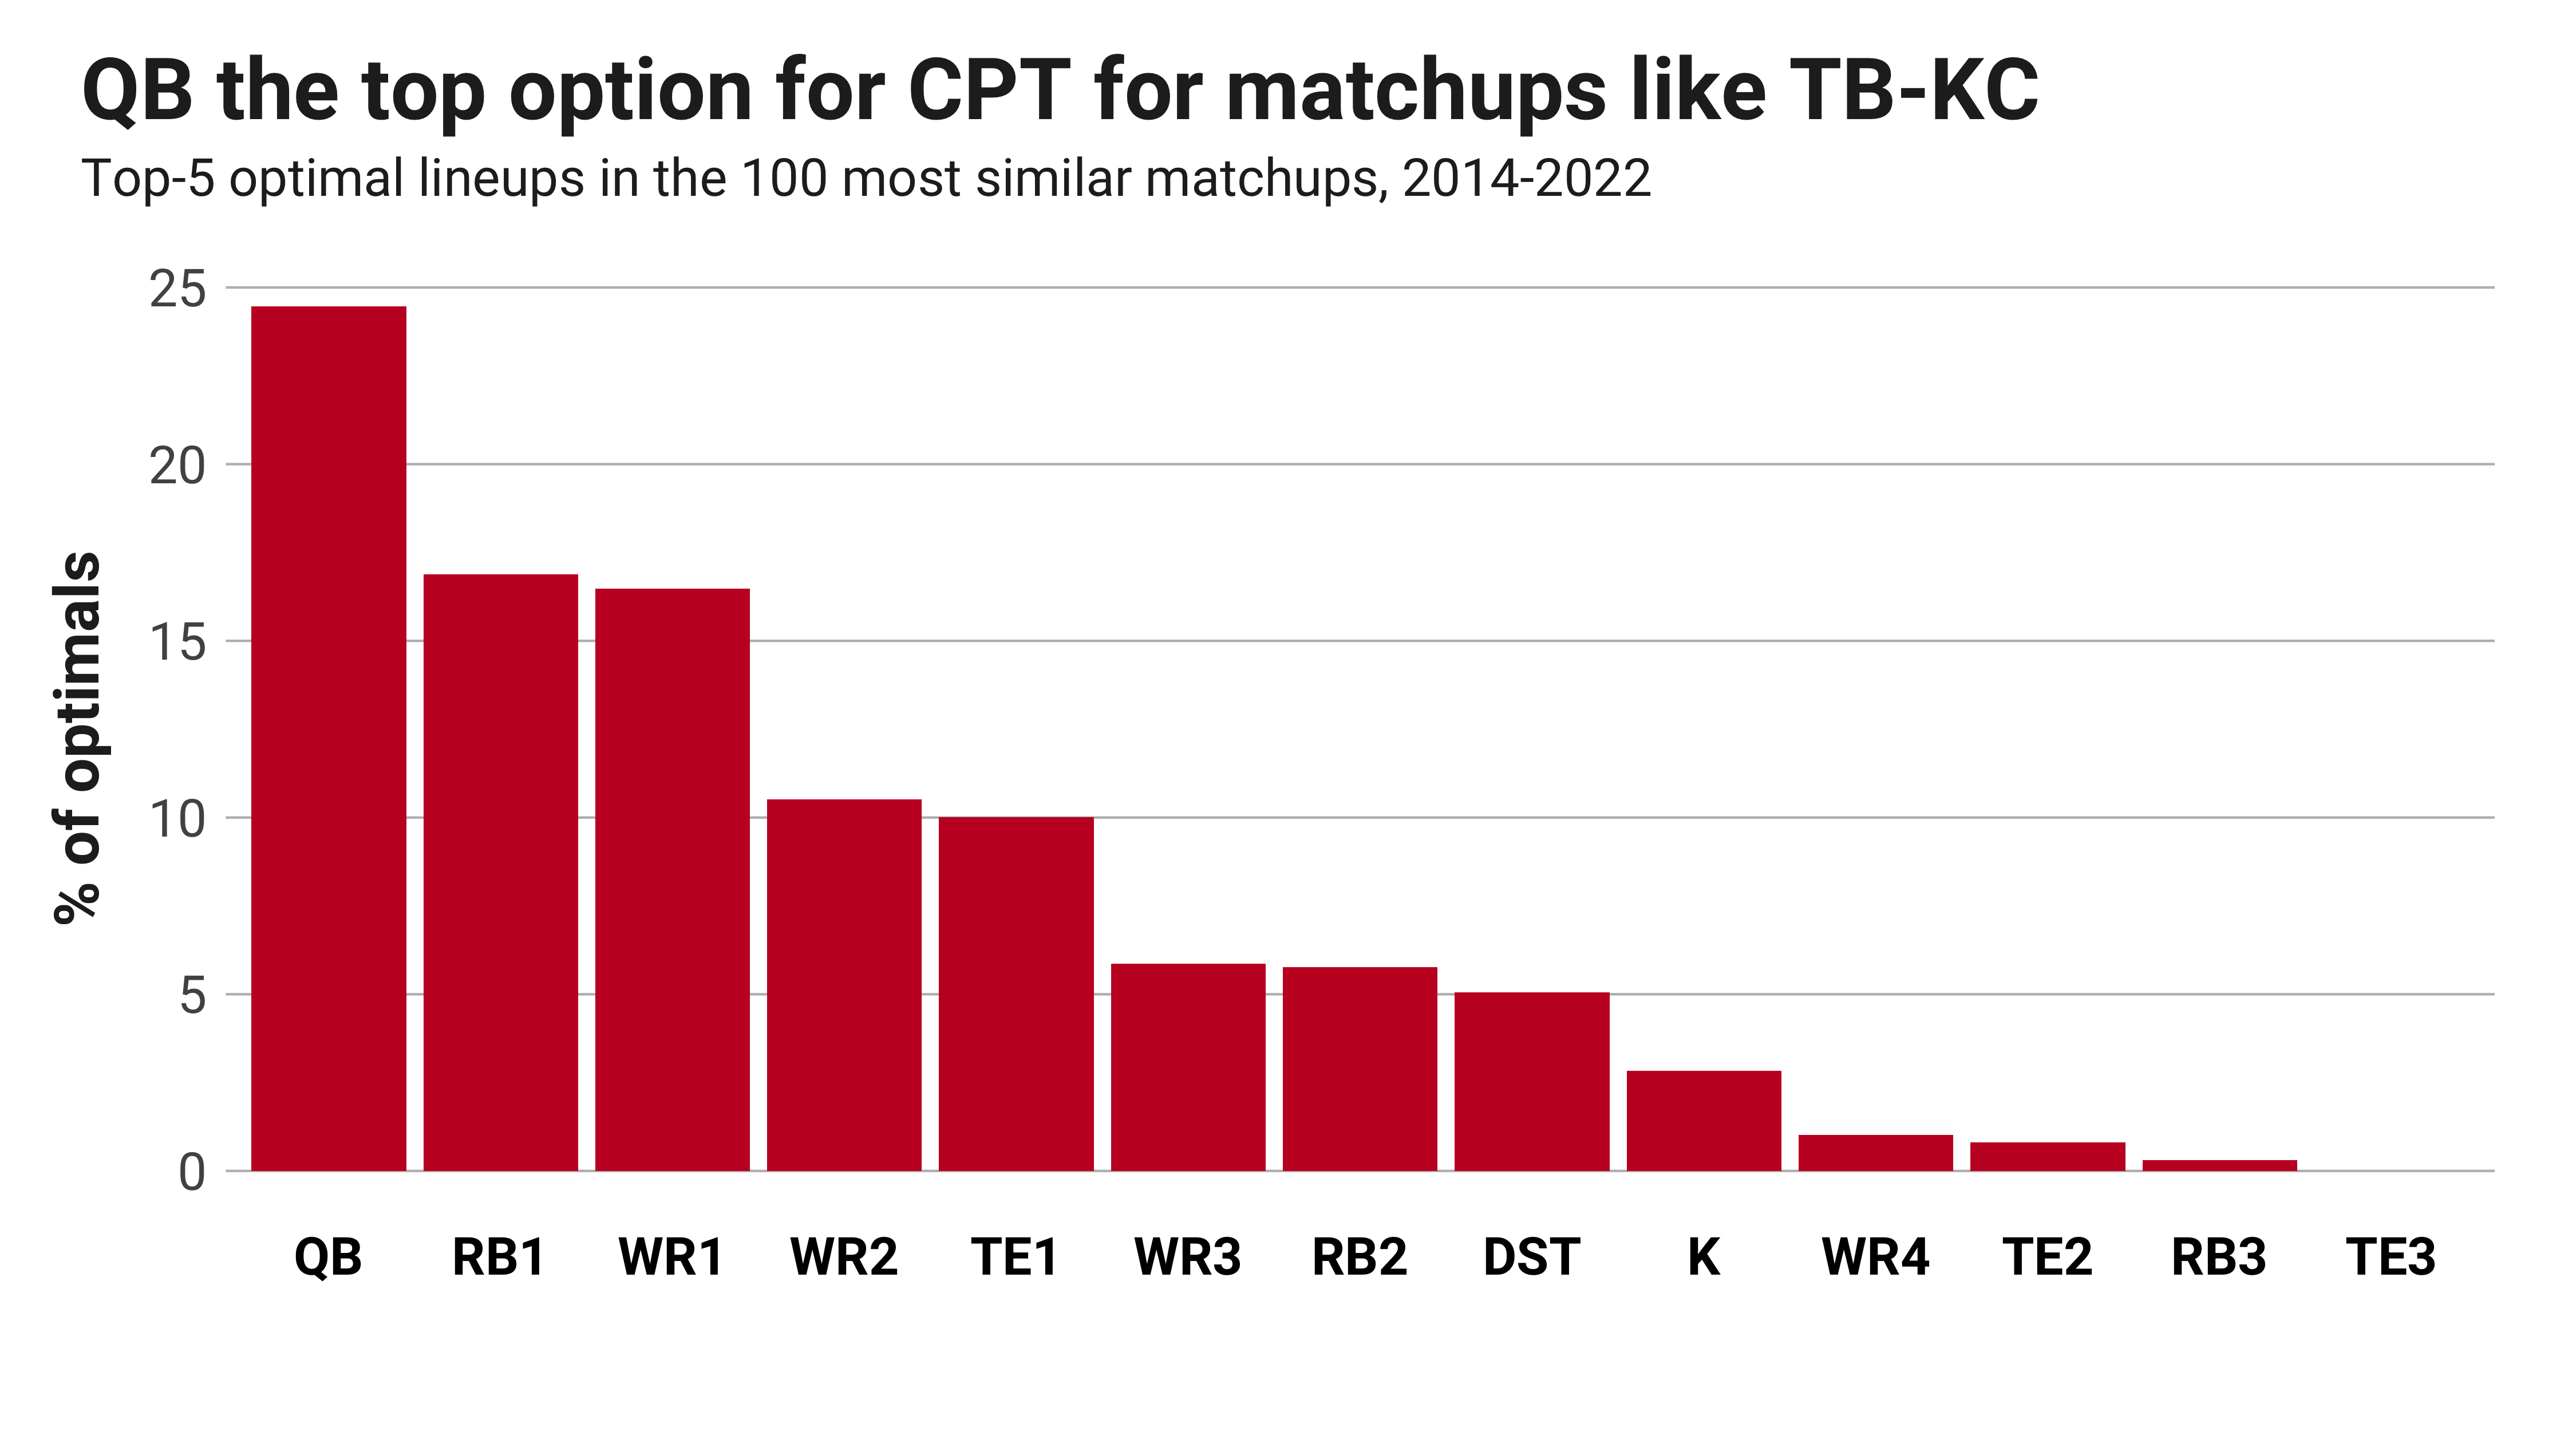
CHOOSING THE RIGHT CAPTAIN
The most unique part of the format, and therefore the biggest opportunity for a competitive advantage, is choosing your CPT. Should you always choose a QB who typically has the highest absolute fantasy scoring? Are defenses and kickers viable options? RB versus WR?
I went through the millions of possible lineup combinations for the 100 most similar matchups and found who the CPT selections were on the top-five scoring lineups for each matchup. Here are the 500 CPT choices from those matchups by position rank according to salary.
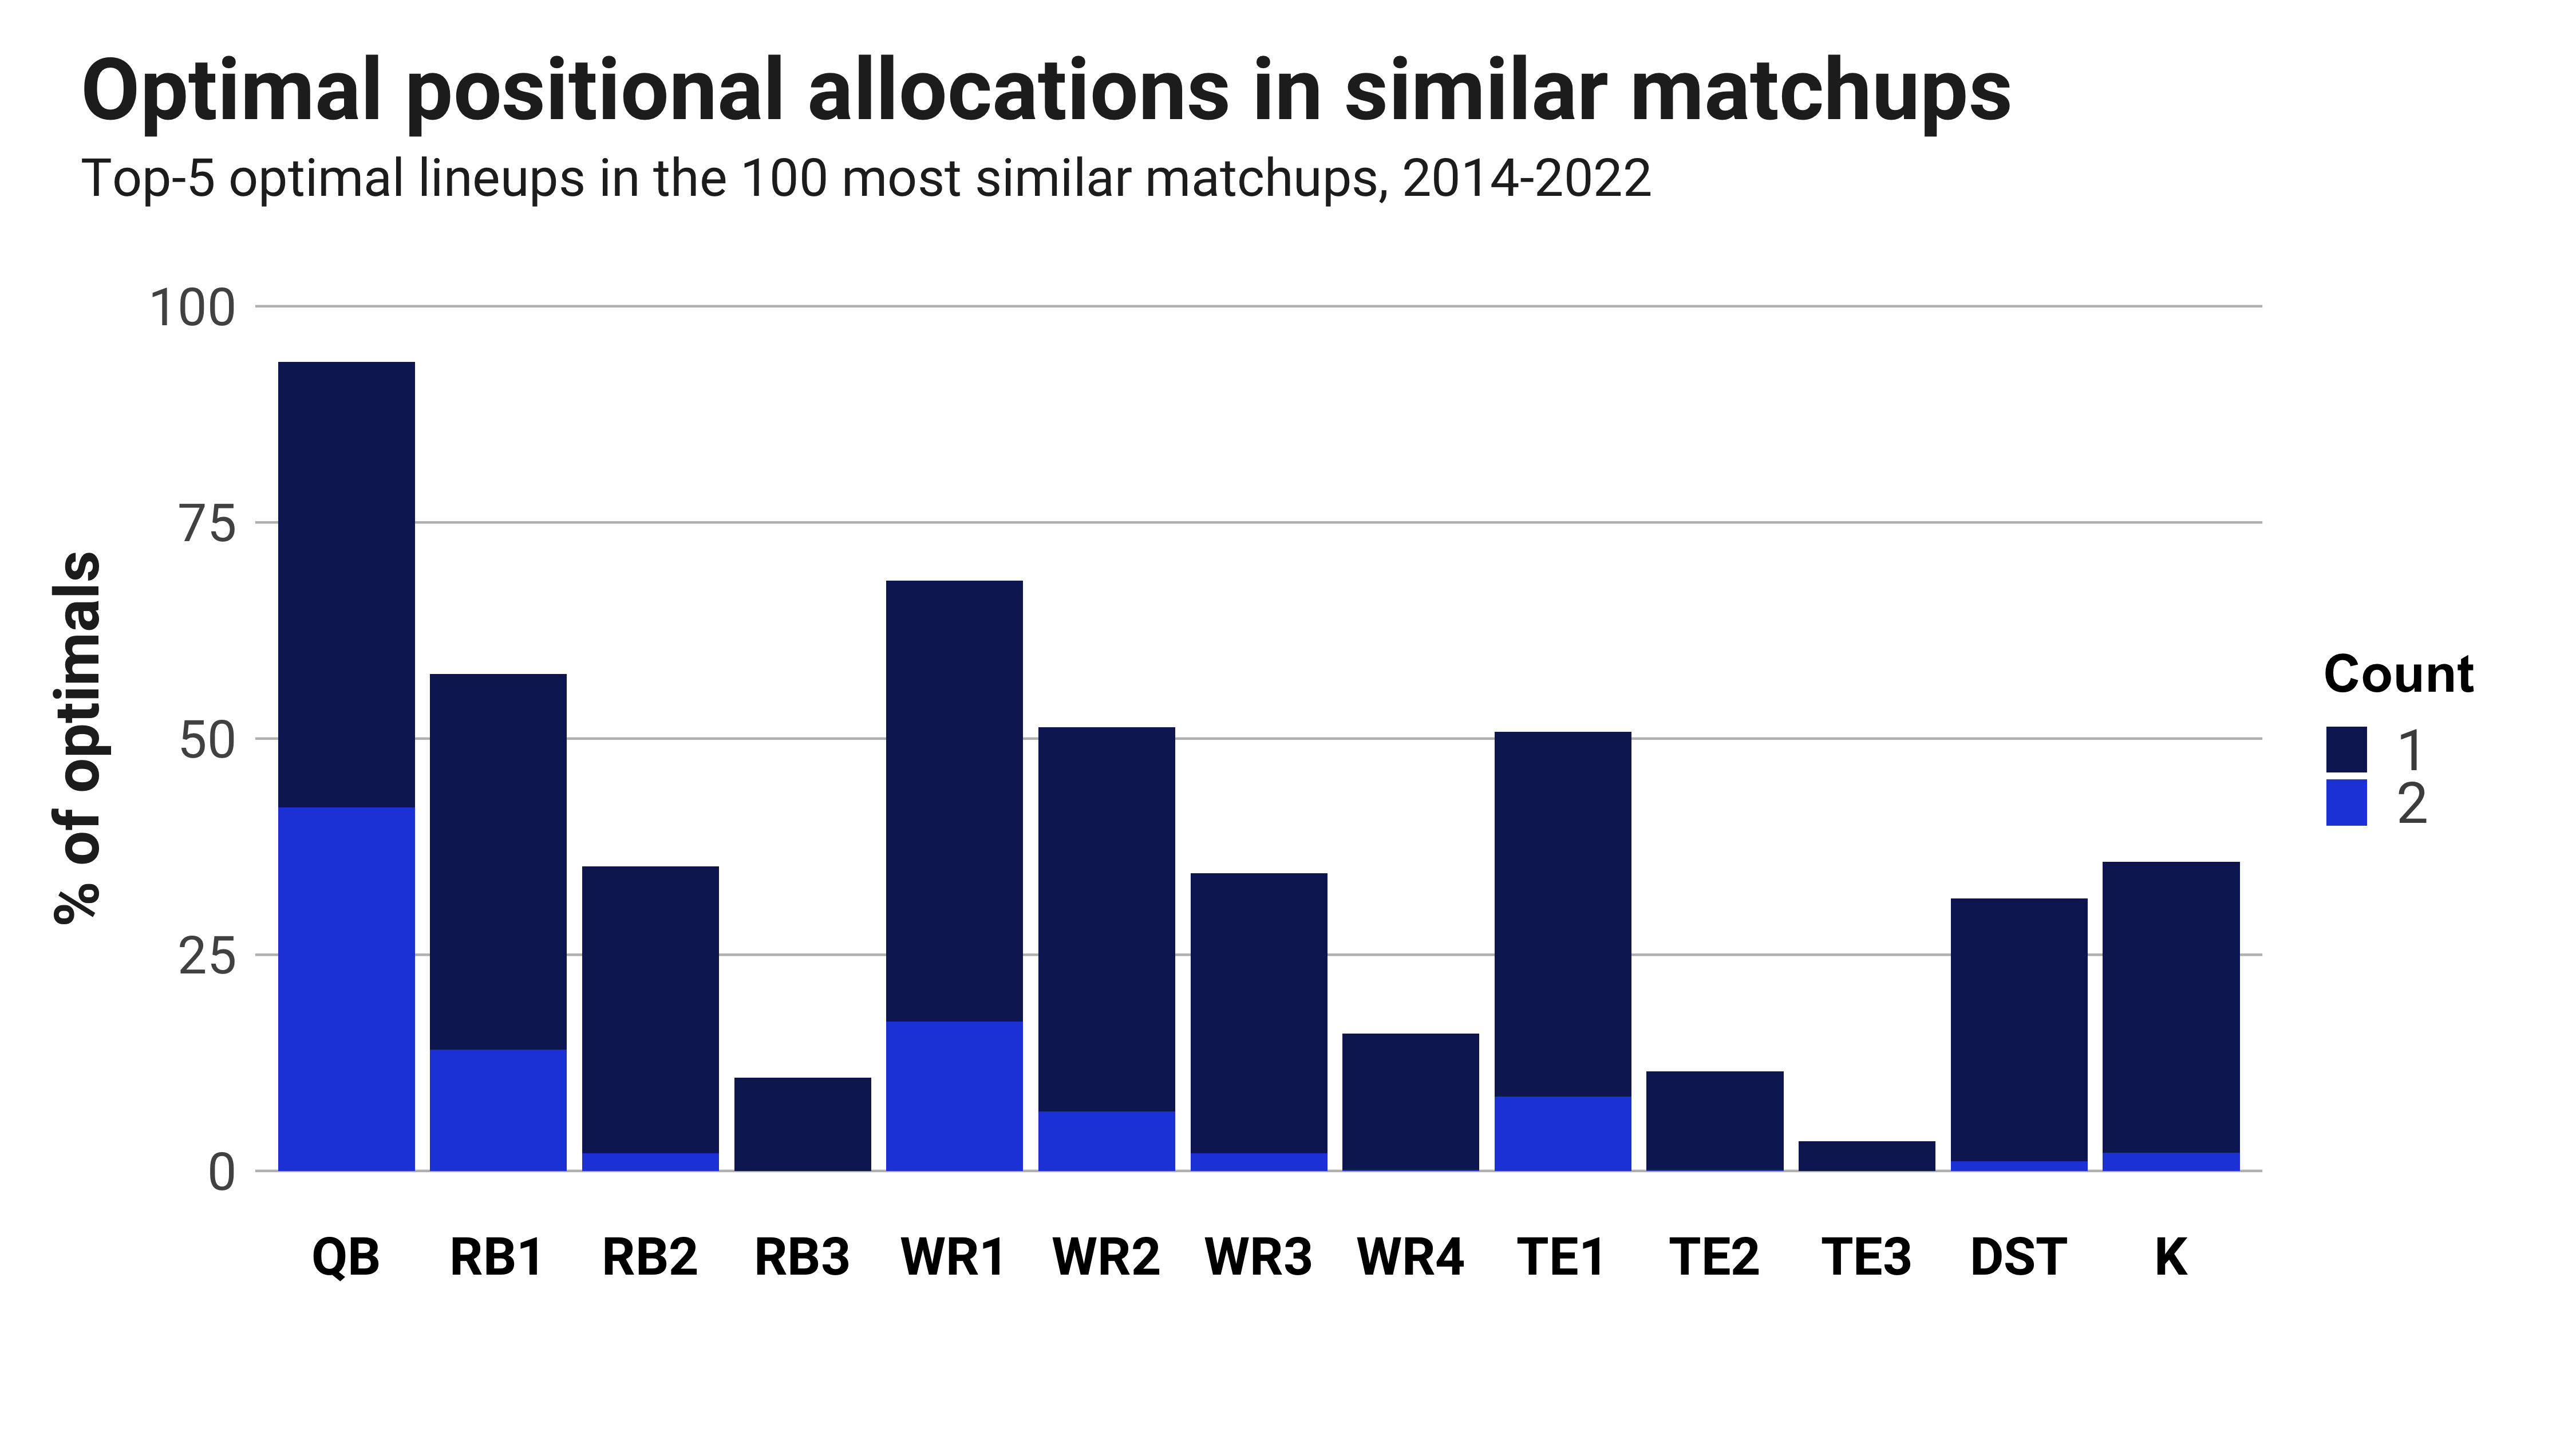
BREAKING DOWN TOTAL OPTIMAL ROSTERS
This graph illustrates the full range of allocations for the different positions to measure how many of the 500 optimal rosters had exactly zero, one or two of the given positions.
HISTORICAL OWNERSHIP
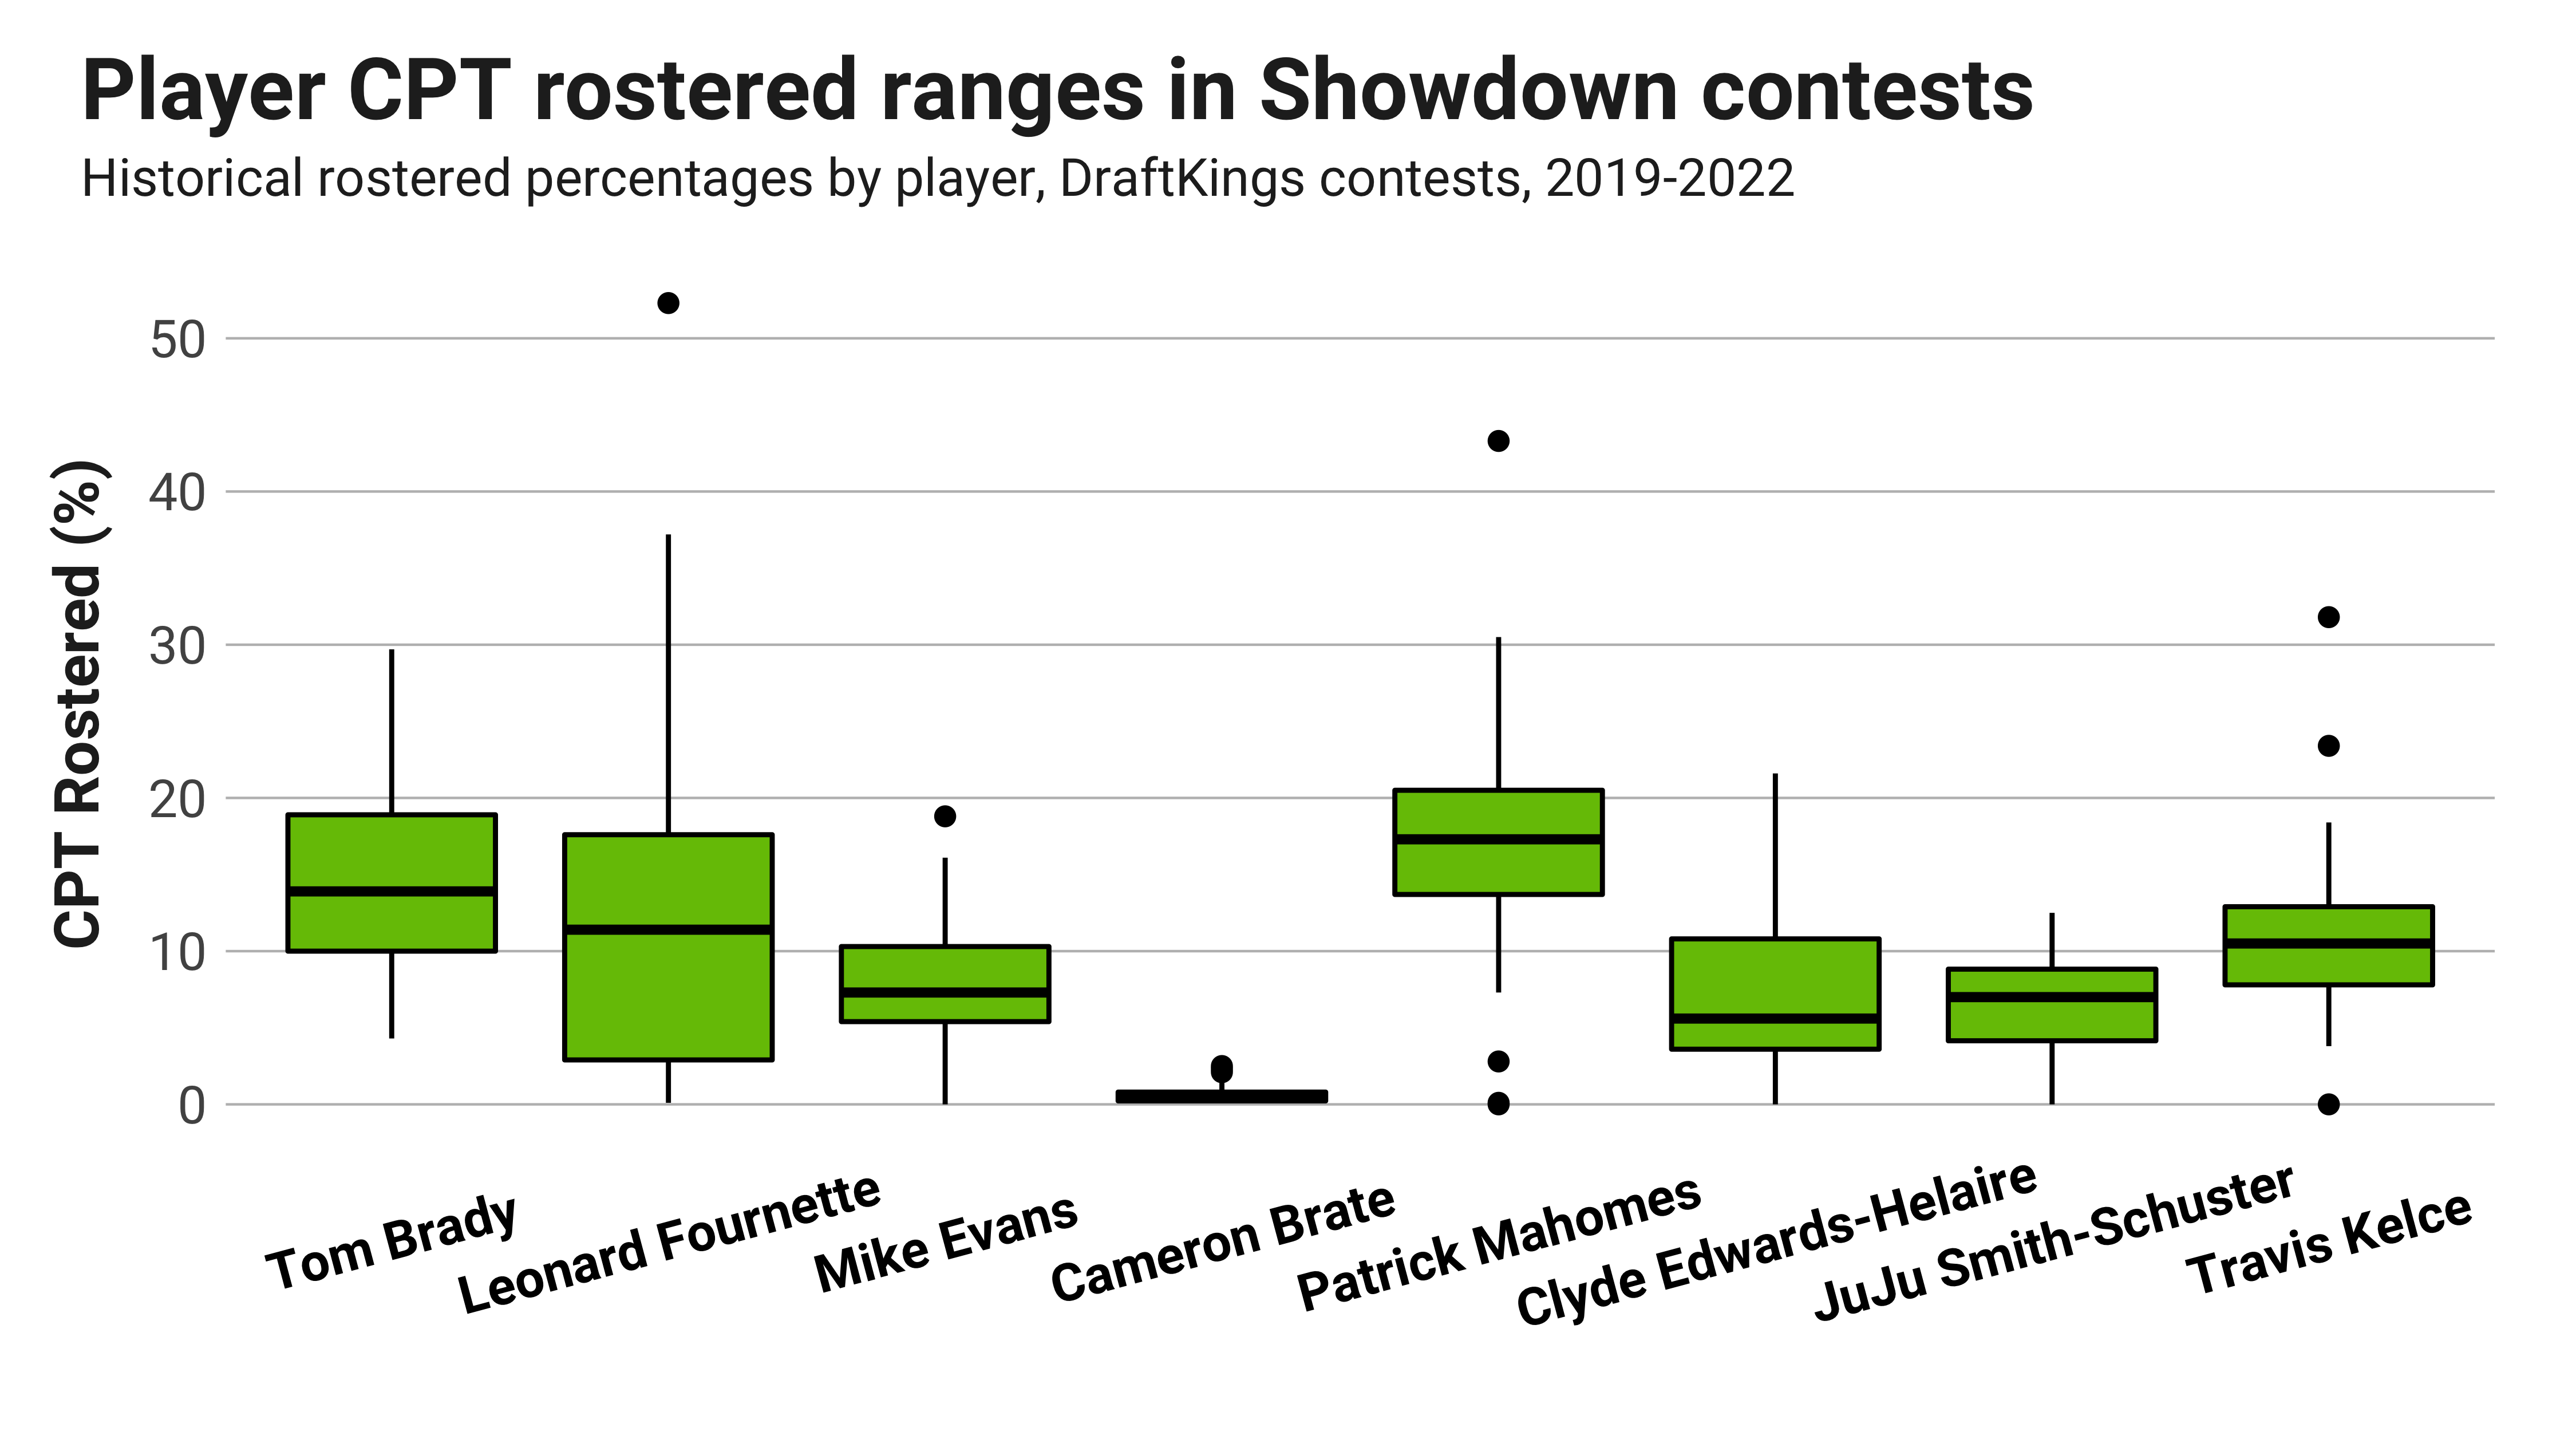
The boxplot above shows the ranges for CPT ownership for each starting player in contests since 2019.
PROJECTED OWNERSHIP VERSUS OPTIMAL
This is where the analysis comes together and becomes actionable. What’s most important when viewing these numbers is to contrast them to the optimal numbers taken from the analysis above for different positions. Then, we see where the leverage may exist.
The two tables below compare the optimal allocations above, with adjustments for the personnel of this particular matchup, to our ownership projections for CPT and FLEX.
DRAFTKINGS SHOWDOWN CAPTAIN
