(Metrics that Matter is a regular offseason feature that examines some aspect of fantasy through a microscope to dive into the finer details.)
I’ve spent a lot of time in this space critiquing some of the most commonly used metrics (e.g. passer rating, yards per carry, etc.) and arguing for other metrics as being unfairly overlooked by the sabermetric and fantasy communities. Of all these statistics, I’m not sure anything is as underutilized as “first downs.” First downs extend drives and have a real positive impact on the game, far more so than anything like completion percentage or catch percentage. In 2014, Chase Stuart and Brian Burke found that a first down is worth the equivalent of 0.55 expected points or 8.7 yards.
Leagues that award fantasy points for first downs are also widely becoming more popular in lieu of the now industry-standard PPR scoring. It makes sense too. PPR leagues improved on standard leagues in making scoring more predictable and less random, but it seems odd that a reception for -5 yards is still worth positive fantasy points though it has a negative impact on real NFL scoring. With the Scott Fish Bowl (a league of 720 players including many of the industry’s top analysts) adopting a 0.5-fantasy-points per first down scoring system this year, I wanted to spend some time looking at how this scoring system effects various players and positions. First, however, let’s look at which players were the most productive and efficient at racking up first downs.
Here’s a list of last season’s (flex-eligible) leaders in rushing, receiving, and total first downs per game.
Top-20 flex-eligible players in rushing, receiving, and total first downs per game (2017): pic.twitter.com/4Hr7nKM5vP
— Scott Barrett (@ScottBarrettDFB) June 10, 2018
Here’s a list of last season’s most efficient players by receiving first downs per target and rushing first downs per carry.
Chart 1: Top-20 most-efficient receivers by first downs per target (min. 50 targets) [2017]
Chart 2: Top-20 most-efficient rushers by first downs per carry (min. 100 carries) [2017] pic.twitter.com/BwFTNOdP04
— Scott Barrett (@ScottBarrettDFB) June 10, 2018
As you can see, all charts have a healthy representation of some of the league’s best, most efficient, and most productive players. I’ll highlight a few of these names from the latter posting, but before I do I should note that this is likely more so a “usage stat” than it is an “efficiency stat.” A player’s ability to rack up first downs efficiently is largely predicated on that player’s role. Receivers (typically slot wide receivers) with an average depth of target closer to the first-down marker and running backs used in goal-line and short-yardage situations are going to be overrepresented in the efficiency charts.
Rob Gronkowski, TE, New England Patriots
Gronkowski ranked first among receivers last year, but also top-five of 302 qualifying receivers in first downs per target over the past three seasons. He also ranks third of 333 qualifying receivers in yards per target over the past decade, is our most efficient touchdown scorer (among receivers) over the past decade, and the Tom Brady-to-Rob Gronkowski connection is the most-efficient quarterback-to-receiver connection of the past decade. Yeah, he’s really good.
Albert Wilson, WR, Miami Dolphins
It’s interesting to note Wilson ranking so highly here (second-best), as he continues to pop in a number of metrics I typically look at. Wilson also ranks first among all wide receivers in missed tackles forced per reception since joining the league in 2014. I want to push him up my rankings, but it’s hard to get too excited with Danny Amendola (who also ranked 10th-best by the same stat) competing for playing time in the slot in Miami.
Hunter Henry, TE, Los Angeles Chargers
Over the past three seasons, Henry ranks first of 302 qualifying players in first downs per target (53.0 percent) and third in touchdowns per target (10.4 percent). He’s out for the year with an ACL injury, but has a promising career ahead of him. Perhaps his injury means even more volume for Keenan Allen, who also ranked top-10 by the same metric.
Allen Hurns, WR, Dallas Cowboys
Hurns’ ranking of fourth-best among receivers also came as a surprise. The immediate reaction is that perhaps he is ready to be the target-hog we’re all hoping he can be in Dallas, after the team lost 242 combined targets from the departures of Dez Bryant, Jason Witten, and Brice Butler. Still, for similar reasons to Wilson, there’s some risk here. Hurns has scored 78 percent of his fantasy points from the slot throughout his career, which is also where Cole Beasley ran 87 percent of his routes last season. It seems likely Hurns will be playing out of position in 2018, and that’s not often a smooth transition for fantasy wide receivers (e.g. Nelson Agholor).
Alvin Kamara, RB, New Orleans Saints
Mark Ingram had 23 more carries than Kamara when there was fewer than four yards to go for a first down. Despite this, Kamara ranked first among all running backs in rushing first downs per attempt. This was likely a product of his historic efficiency numbers, ranking fourth of 2,173 qualifying running backs since 1970 in yards per carry. Due to his effectiveness as a runner and Ingram’s four-game suspension, it’s possible, but maybe not likely, he serves in more of an every-down capacity next year.
Dion Lewis, RB, Tennessee Titans
For similar reasons, maybe we’re overlooking Lewis’ potential as an early-down running back. Derrick Henry certainly fits the profile as a workhorse and short-yardage running back better than Lewis (Henry is seven inches taller and 52 pounds heavier than Lewis), but Lewis ranked third on this chart while Henry ranked 13th. As alluded to here, it’s unlikely Henry commands the majority of DeMarco Murray’s lost targets, but maybe Lewis also receives more carries than I was initially projecting. Murray leaves behind 184 carries and 47 targets in his wake. At ADP, I greatly prefer Lewis (RB28) to Henry (RB18).
With point-per-first-down fantasy leagues gaining in prominence, I wanted to look at how that scoring system compares to PPR leagues. With the Scott Fish Bowl as the template (half-point per rushing and receiving first down), here’s the impact it had on each position.
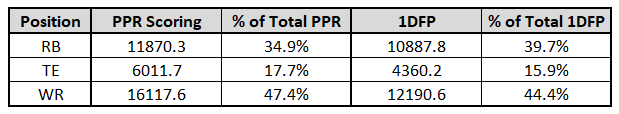
As you can see, wide receivers and tight ends benefited more from PPR scoring, but running backs rose in half-point-per-first-down leagues. This makes sense. Last season, running backs totaled 40 percent of all first downs, while wide receivers totaled 44 percent and tight ends totaled 15 percent. Last year, wide receivers totaled 54 percent of all receptions, while those numbers sat at 25 percent for running backs and 21 percent for tight ends.
So who specifically benefited the most and who was hurt the most when scoring changed from PPR to half-point per first down?
Chart 1: Top-20 most-efficient receivers by first downs per target (min. 50 targets) [2017]
Chart 2: Top-20 most-efficient rushers by first downs per carry (min. 100 carries) [2017] pic.twitter.com/BwFTNOdP04
— Scott Barrett (@ScottBarrettDFB) June 10, 2018
The takeaways here are fairly self-explanatory. Of the 15 players that most benefited, all were running backs. Of the 15 players who fell the most, all were receivers. The running backs who gained the most were those who rarely saw targets but were used extensively in short-yardage situations. Of the receivers most at a detriment, we see, basically, a list of the receivers ranking near the bottom in first downs per reception.
