In fantasy football, volume matters far more than efficiency for running backs, wide receivers, and tight ends, as evident by the correlations we found here. The quarterback position, however, is an entirely different story. Since 2007, among all 16-game quarterback seasons, raw pass attempts had a 0.41 correlation to fantasy points – much lower than the correlation between passer rating and fantasy points (0.73) or yards per pass attempt and fantasy points (0.63).
One of my favorites reads of this offseason was from the hosts of the PFF Forecast podcast, Eric Eager and George Chahrouri, who looked at a metric they called Adjusted Quarterback Rating. You can read that article here.
Essentially, not all interceptions are the fault of the quarterback. A ball could be placed perfectly within the frame of the receiver, only to have that ball deflected off of the receiver’s hands and into the arms of a willing defender. The quarterback is then undeservingly credited with a negative play. The same can be said for touchdowns. A quarterback could throw an inaccurate ball only to have a wide receiver make a highlight-reel catch and then break three tackles on his way to a 63-yard score. The quarterback’s positive impact on this play was minimal, but they are still awarded full credit for the touchdown.
Eager and Chahrouri attempted to help solve this problem and improve upon traditional passer rating by using PFF’s grades to better isolate a quarterback’s performance independent from the rest of his team. Rather than crediting quarterbacks with positive and negative throws using two of the primary variables in the passer rating formula (touchdowns and interceptions), they added more clarity by replacing these components with “big-time throws” and “turnover-worthy throws” – two PFF-exclusive metrics that were explained in greater depth here.
In their conclusion, they write, “Touchdowns and interceptions tell you what happened, while big-time throws and turnover-worthy throws tell you more about how good a player is (and likely will be in the future).” That latter point is true and backed by their data – adjusted quarterback rating is far more stable than traditional passer rating, with a year-to-year correlation of 0.48 to traditional passer rating’s 0.39.
Since we already established efficiency is more important than volume for fantasy quarterbacks, and this new metric is more stable than traditional passer rating, I wanted to see what sort of utility it had from a fantasy perspective.
What does this mean for fantasy?
In this article, my focus is primarily on the differential between adjusted passer rating and traditional passer rating, to highlight potential ADP values. If the public perception is that a quarterback disappointed as a passer last year (perhaps caused by analysts focusing too much on traditional passer rating), but they ranked much higher by adjusted passer rating, perhaps we should be targeting them at their now-depressed ADP.
Indeed, since 2007, of all 200 quarterbacks to attempt at least 300 passes in back-to-back years, 67 percent of all quarterbacks with a positive differential (between traditional and adjusted passer rating) improved in traditional passer rating in the following season. Only 40 percent of all quarterbacks with a negative differential improved in the following season.
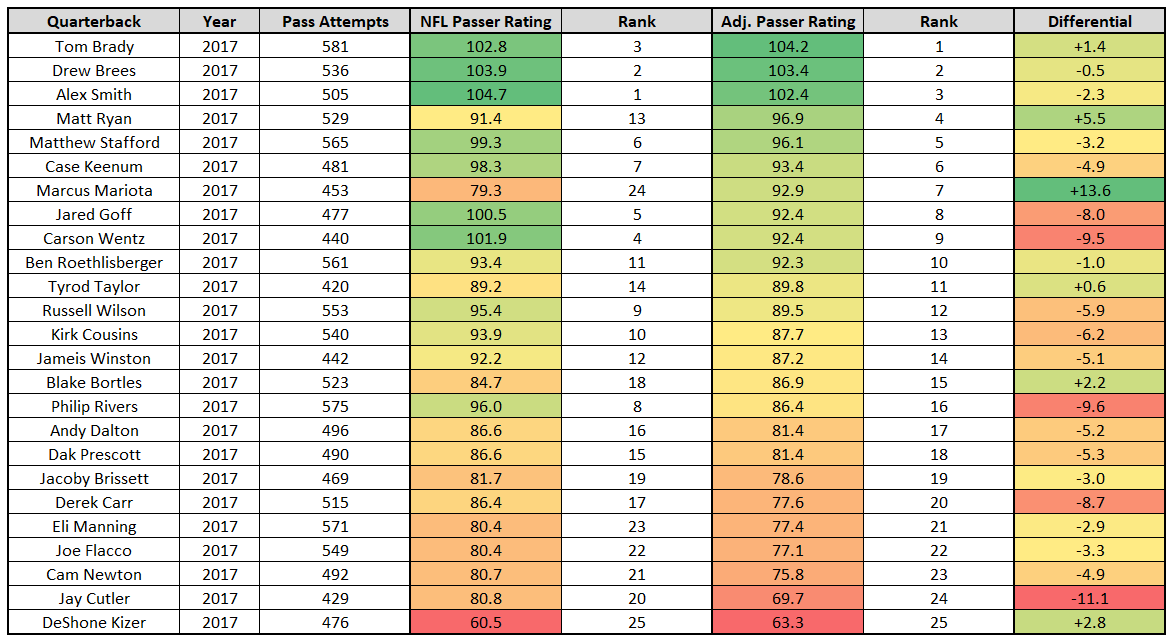
Here’s the list of all quarterbacks with at least 400 pass attempts last season, sorted by adjusted passer rating:
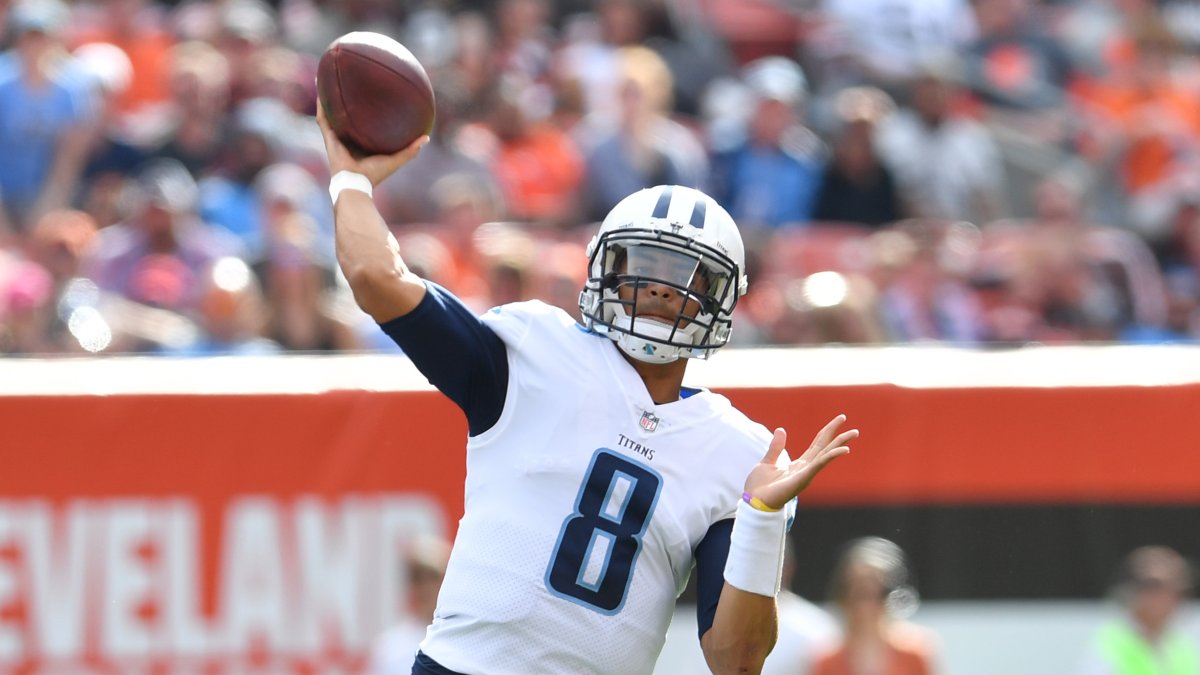
Marcus Mariota, Tennessee Titans
Mariota had the largest positive differential of any quarterback on this list (+13.6) and jumped a whopping 17 spots in our rankings, from second-worst to seventh-best. This was primarily influenced by the fact that Mariota had two more interceptions than turnover-worthy throws and that three of his big-time throws were dropped by receivers.
Mariota was already a prime positive regression candidate for a few other factors as well. By traditional passer rating he fell 14.5 points from his prior career average (93.8 to 79.3) in 2017, though by adjusted passer rating he actually improved by 8.0 points (84.9 to 92.9). He was also one of our top positive touchdown-regression candidates this season, posting a 2017 touchdown rate well below his prior-career average.
Keep in mind, with Corey Davis fully healthy and now in his second year, Mariota might now have the best supporting cast of receivers he’s ever had. Throughout his short career, his most targeted wide receivers have been (in order) Rishard Matthews, Kendall Wright, Eric Decker, Tajae Sharpe, and Harry Douglas. Despite actually playing better in 2017 than in any other year of his career (per our data), Mariota is now being drafted as the 18th quarterback off the board – 10 spots lower than a season ago.
Matt Ryan, Atlanta Falcons
After Mariota, Ryan sported our second-highest differential (+5.5), jumping from 13th- to fourth-best. The most significant reason for this was that he threw 12 turnovers compared to only five turnover-worthy throws – the largest differential of the past decade. We already highlighted Ryan in a previous article as a positive regression candidate, for ranking third-best in depth-adjusted completion percentage and for being atypically inefficient at scoring touchdowns.
Keep in mind, Ryan is just one year removed from his historic MVP-winning 2016 season, and his performance last season was actually better (by adjusted passer rating) than his trailing three-year average (96.9 to 94.9). Like Mariota, he’s another tremendous ADP value, typically being drafted 12th among quarterbacks – eight spots lower than his ADP last year.
Philip Rivers, Los Angeles Chargers
On the other end of the spectrum, no quarterback fell further in these rankings than Rivers, who ranked eighth in traditional passer rating and 16th in adjusted passer rating. He seems like a top (negative) regression candidate at the position, and especially so after losing tight end Hunter Henry to a torn ACL. Over the past two seasons, Rivers' passer rating would have dropped from 91.9 (13th-best) to 86.6 (23rd-best) if we removed all of his throws when targeting Henry. Rivers is not someone I’m particularly interested in at ADP (QB15).
Carson Wentz, Philadelphia Eagles
After Rivers, Wentz saw the second-biggest dropoff (five spots) falling from fourth-best in traditional passer rating to ninth-best in adjusted passer rating. Obviously, these numbers imply a looming regression, but he was already on our regression radar for a different reason. Passing touchdowns accounted for 46 percent of Wentz’s fantasy points last year, the highest rate of 30 qualifying quarterbacks. As outlined here, Wentz’s touchdown rate of 7.5 percent was historically high (top-30 all-time) and highly unstable (quarterbacks in the top-30 declined considerably by this metric in the following year). Wentz also feels like a risky investment in that he’s still rehabbing from a torn ACL suffered in December.
Jay Cutler, free agent
Cutler posted our worst differential of all quarterbacks (-11.1) and played far worse than traditional metrics might have suggested – but probably just about as poorly as Miami fans would have guessed. I suppose it doesn’t really matter for Cutler, but it might for Miami’s receivers and fantasy players looking to draft them. Ryan Tannehill’s career adjusted passer rating is far higher (86.9) than Cutler’s, and this should lead to improved efficiency for his supporting cast.
