Of our Signature Stats at PFF, I’m particularly engrossed by a running back’s breakaway percentage — or, the percentage of a back’s rushing yards that come on runs of 15-plus yards.
I find it a fascinating number, not only because it’s open to interpretation. If a percentage is high, is the back so explosive that you want to invest in him, or did he stumble into a handful of runs that aren’t repeatable? If it’s low, is he a plodder who relies on quantity over quality, or does that prove that his team trusts him even if an offensive line isn’t giving him great lanes?
The truth is that it depends. Leonard Fournette had the longest run of 2017, at 90 yards, and tied for the third-longest, at 75. His third-longest run? 28 yards. Fournette had a productive rookie year, finishing as the No. 10 PPR back even having missed three games, but he only topped 4.0 yards per carry in three of his 13 games, and two of those were only on the backs of those two longest runs. By contrast, Kareem Hunt’s rookie year featured 16 games — and more than 4.0 yards per carry in 11 of them.
Below, I’m just having some fun with the history of breakaway percentage, back to 2006. Some tidbits and interesting takeaways:
- In 2007, Chris Johnson had 30 runs of 15-plus yards. That’s the second-most since 2006. The most? Adrian Peterson in 2012, with 40. He had a full 10 breakaway carries more than the second-best of the last 12 years. By contrast, Hunt had the most 15-plus-yard carries in 2017, at only 19.
- Year-over-year changes: In 2016 with the Bills, Mike Gillislee had 100 carries, including 10 of 15-plus yards. In 2017 with the Patriots, he had 104 carries, including one of 15-plus yards. Of Gillislee’s 383 rushing yards, 16 came on that single “breakaway” run. The only qualified running backs with fewer breakaway yards since 2006 were:
- Fred Jackson, 2012 (1 run for 15 yards)
- Danny Woodhead, 2013 (0 breakaway runs)
- Kevan Barlow, 2006 (0 breakaway runs)
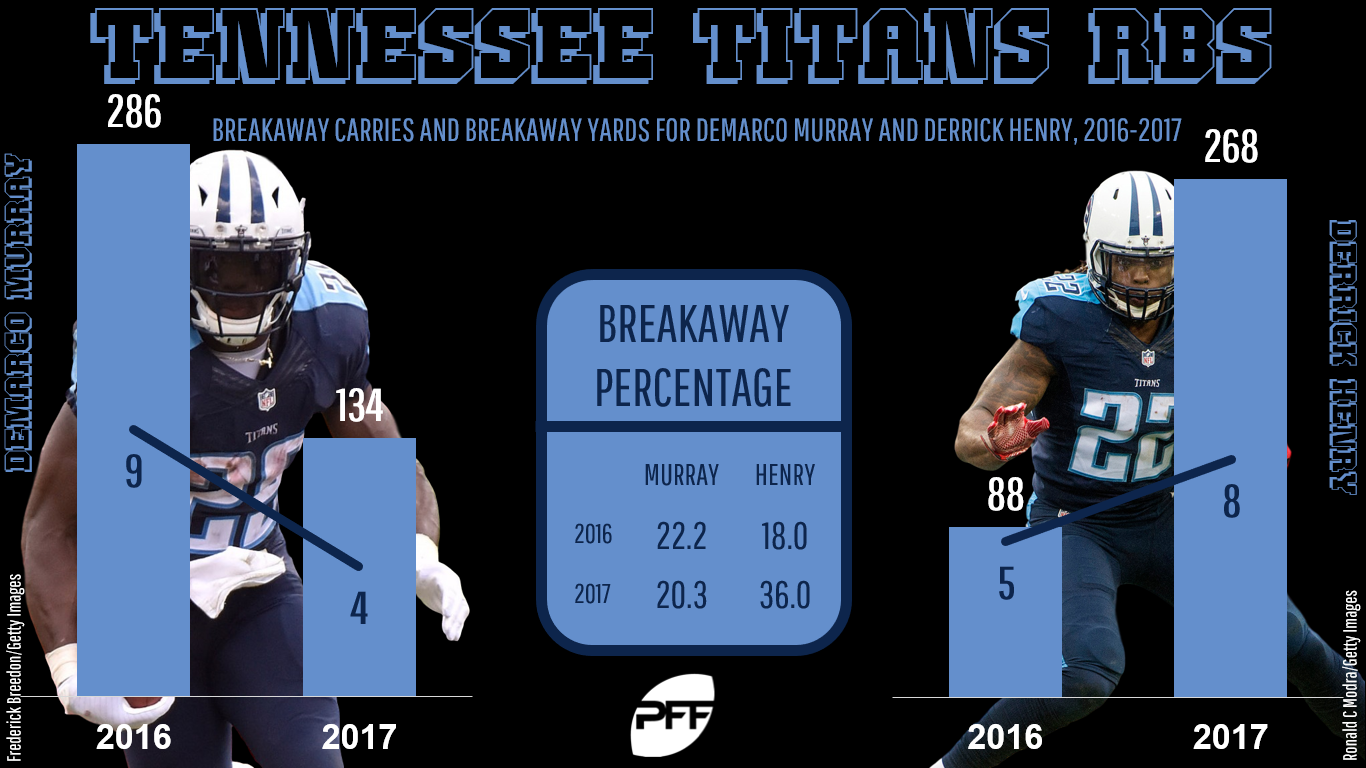
- As a combined entity, DeMarco Murray and Derrick Henry were fairly steady from 2016 to 2017. Together, they had 14 breakaway carries for 374 yards in 2016, then 12 for 402 last year. But how they got there really helps illustrate why Henry is now the Titans starter and Murray is unemployed:
- Murray, 2016: 9 breakaway carries for 286 yards
- Murray, 2017: 4 breakaway carries for 134 yards
- Henry, 2016: 5 breakaway carries for 88 yards
- Henry, 2017: 8 breakaway carries for 268 yards
- Interestingly, they both averaged exactly 33.5 yards on those carries in 2017.
- Le’Veon Bell had the second-most breakaway carries of his career, at 14. Despite that, he put up only 244 breakaway yards, 17.4 yards per breakaway carry. Bell’s longest carry of the season was only 27 yards; his second-longest was only 22.
- Not that Matt Forte’s end-of-season retirement was a huge shock, but the signs were there: He had had at least six breakaway runs and at least 123 breakaway yards every year of his career before 2017, but had only 3 and 51, respectively, in his final season.
- We’ve discussed in the past how Todd Gurley’s offensive line gave him a whole extra yard per carry before contact to work with in 2017 compared to 2016, but the added effect of that is more freedom to break off big runs: Gurley had 15 breakaway carries for 377 yards in 2017 after 7 for 129 in 2016.
- With Miami in 2017, Jay Ajayi had 7 breakaway carries for 125 yards, 17.9 yards per carry and a breakaway percentage of 26.9. With Philadelphia, he had 5 breakaway carries for 188 yards, 37.6 yards per carry and a breakaway percentage of 46.1. Combined, that’s 26.1 yards and a 35.9 breakaway percentage … or roughly the same as his 30.1 and 35.4 from 2016.
- Breakaway yards per breakaway carry: By definition, this is a yards-per-carry statistic that starts at 15.0 and goes up from there. It’s one that can be maddeningly influenced by small samples (i.e., a running back who has four 15-yard carries and one of 90 yards suddenly has a 30-yard average), so it’s best viewed not in a vacuum:
- Frank Gore is the leader in yards-per-breakaway-carry in a season since 2006 with 10 or more breakaway carries: in 2009, he ran for 506 yards on 13 breakaway carries, 38.9 yards per carry. That’s the same Gore who has averaged 17.5 yards on 13 breakaway carries the last two seasons combined. Father Time remains undefeated.
- Bell’s 17.4-yard average in 2017 is the lowest YPC average with double-digit breakaway carries since 2006, and only Andre Ellington’s 2014 (18.3) is even with a yard of his average.
- Bilal Powell had only nine breakaway carries in 2017, but they included runs of 51, 57, and 75 yards, giving him a breakaway YPC of 38.7. Fournette had a similar story: He only had eight breakaway carries, but with two of the longest single carries by any back all season among them, his 35.4-yard average was second-best in 2017.
Yards per carry without breakaway numbers
I took every qualified running back's overall rushing numbers and took out all carries of 15-plus yards. I don't think this number means much of anything, but I found it interesting in a list. Here's the top 10:
| Yards Per Carry Without Breakaway Carries | ||||
| Name | Team | Carries | Yards | YPC |
| Alvin Kamara | NO | 107 | 426 | 3.98 |
| Matt Breida | SF | 101 | 393 | 3.89 |
| Wayne Gallman | NYG | 108 | 416 | 3.85 |
| Dion Lewis | NE | 169 | 640 | 3.79 |
| Aaron Jones | GB | 73 | 266 | 3.64 |
| Mike Gillislee | NE | 103 | 367 | 3.56 |
| Duke Johnson | CLV | 76 | 268 | 3.53 |
| Alfred Morris | DAL | 109 | 384 | 3.52 |
| Todd Gurley | LA | 264 | 928 | 3.52 |
| Jamaal Williams | GB | 152 | 531 | 3.49 |
