Last week, we dived into the PFF data to identify the NFL's best wide receivers by route type. As a part of this study, we were not only focused on ranking the league's best pass-catchers on each pass pattern, but we were also interested in finding out whether the ability to run a specific route is an inherent skill or whether overall ability is all that matters and the differences between individual routes is just noise.
We used a resampling method to work around the problem of small sample sizes and found that performance on individual routes is indeed a meaningful split. In other words, we discovered that we could better predict a receiver's performance on a corner route, for example, by using past performance on corner routes than by using past performance on all other routes.
Subscribe to PFF's EDGE or ELITE subscriptions to get access to the following tools, charts, etc.
– All Premium Article Content
– Fantasy Football Rankings & Projections
– Fantasy Football Draft Guide, Cheat Sheets & Advanced Stats
– Fantasy Football Mock Draft Tool (DraftMaster)
– Fantasy Football Strength of Schedule Matrix
– NFL Player Grades
– NFL Premium Stats
Today we kick off a series of articles called Splits That Matter, in which we will investigate different performance splits in the NFL with the same method. Today, we will continue to investigate wide receivers and start with red-zone performance.
Red-zone performance is very important to the result of a game, as polarizing red-zone splits can completely turn a contest upside down. This was observed in the AFC divisional-round matchup in January when the Baltimore Ravens generated more yards per play and almost twice as many first downs than the Tennessee Titans. Still, Baltimore lost the game by a considerable margin because they couldn't convert their scoring opportunities (1 of 4 in the red zone) while the Titans scored a touchdown on all three of their trips inside their opponent's 20-yard line.
Red-zone performance is crucial but noisy
Moving the ball in the red zone is much more difficult due to the lack of space and the limited opportunity to stress the defense vertically. Once inside the opponent's 20-yard line, teams convert a series of downs into a new series of downs 64.5% of the time as opposed to 70.5% of the time between their own 10-yard line and the opponent's 20-yard line.
However, red-zone performance is very noisy. On the team level, the rate at which a team converts a series of downs into another series of downs (called series-conversion rate) is very stable, with a year-to-year R-squared value of 0.27. When looking only at performance in the red zone, the R-squared value drops dramatically to 0.01. It is even the case that series-conversion rate outside of the red zone better predicts next year's series-conversion rate within the red zone (R-squared value of 0.09).
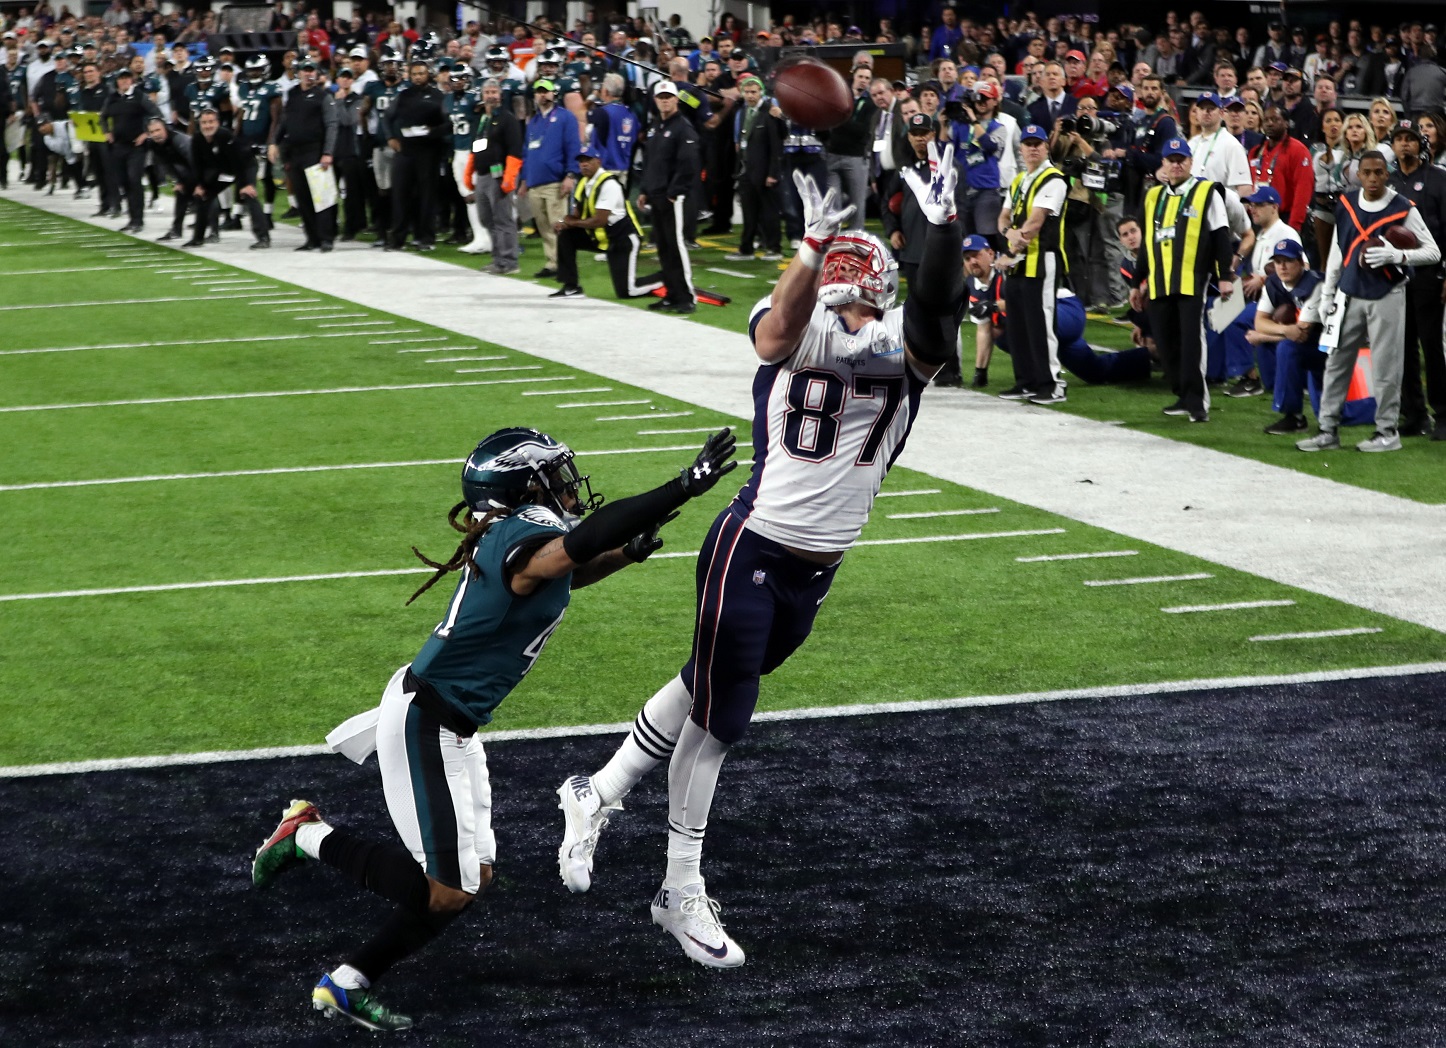
Nevertheless, we often hear the term “red-zone threat” when we speak about receivers, and that term is probably most often used for Rob Gronkowski.
And indeed, when looking at targets above expectation, it turns out that despite the much smaller sample size of plays in the red zone, the R^2-squared value when predicting next year's red-zone performance is 0.09, no matter whether we use last year's red-zone performance or last year's non-red-zone performance as the predictor.
These results already indicate that individual red-zone performance might be a more meaningful split than red-zone success on the team level, so calling some wide receivers red-zone threats might be justified.
Red zone threats exist
Let's take a deeper dive using our method, which adjusts for sample sizes. We compare two predictions for any team or wide receiver:
- Predict next year's red zone performance with last year's performance out of the red zone (out-of-sample prediction).
- Predict next year's red zone performance with last year's performance on a random sample of plays of the same sample size as the first prediction (random sample prediction).
For meaningful splits, we would expect the latter prediction to be better because the random sample includes plays inside the split. For non-meaningful splits, we expect both predictions to be of the same quality.
Since we are working with random samples, we iterate the process 500 times. We get the following result on the team level:
