The passing game is by far the most important facet of the modern NFL, and mastering it on the offensive and the defensive side of the ball is what drives winning football games. Different teams have different approaches toward the passing game, which is why understanding each team’s approach is fundamental to the preparation for a game, no matter whether you are a staff member of a team, an expert analyzing the matchup or a fantasy owner.
PFF has gone above and beyond to capture as much information on the passing game as possible. For every pass play and every eligible receiver on the play, we’ve gathered information on the route type that was run, the depth of the route, the horizontal alignment pre-snap, whether the player went into motion pre-snap, whether he blocked or chipped a pass-rusher before releasing into a route or whether a running back faked to receive a handoff on a play-action attempt and much more.
Route heat maps
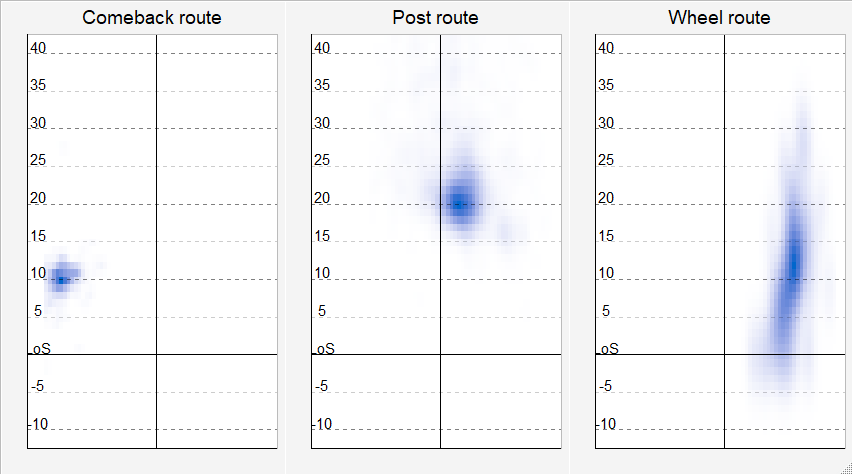
By looking only at the subset of targeted routes, we can predict where a non-targeted route was supposed to be targeted if it came open during the quarterback’s progression. The following are examples of a comeback route run from the left outside, breaking at 12 yards deep, a post route run from the right slot, breaking 16 yards deep, and a wheel route to the right out of the backfield.
The intensity of the blue color reflects the percentage that a target of the route would happen at a given location on the field. Naturally, the possible target zone of a comeback route is only a small spot on the field, whereas the possible target zone of a wheel route is much larger.
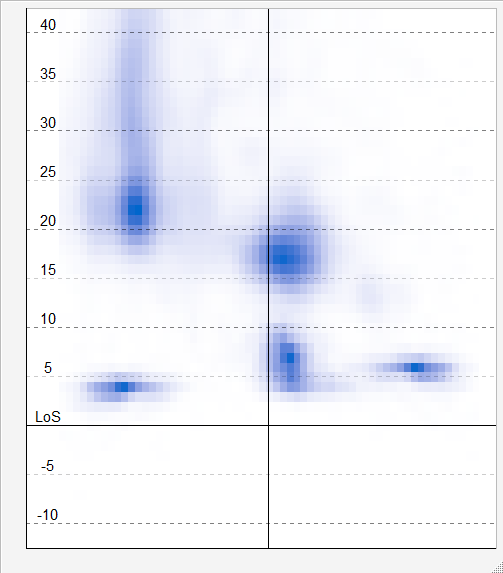
We can aggregate the data for single routes to a single play. Below is a visualization of the zones that the New England Patriots attacked on the drive that resulted in the game-winning touchdown that Tom Brady threw to Rob Gronkowski on second-and-three in the fourth quarter of last season’s Super Bowl.
The full power of this method becomes apparent when we aggregate the data for multiple plays. We can also filter to routes run by an individual receiver. To strengthen the visualization, we should always compare a set of plays with another set of plays (mostly NFL average). A league-wide trend in recent years becomes visible when we show all routes run in the NFL in each year from 2015-18 and compare each of the four seasons to the set of all routes run in these four seasons.
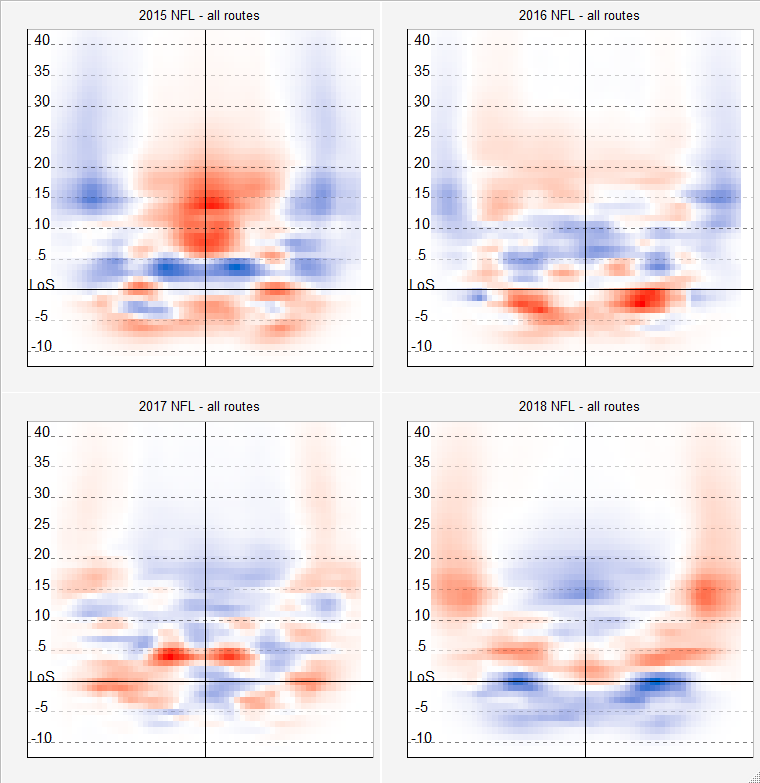
A blue area means that more routes were run toward this area than on average from 2015 to 2018, a red area indicates the opposite. We can see that in 2015 teams ran more routes outside, in 2016 they started attacking the deep middle at a higher rate and in 2017 they finally ran fewer routes at the sidelines. One can clearly see that teams started to use more very short routes in 2018, sending more running backs into patterns. Teams basically replaced the short middle with routes out of the backfield.
We should note that heatmaps have been used before to analyze the passing game in the NFL, as Sarah Mallepalle created a framework to scrape pass-location data from NFL tracking data and used that framework to create heatmaps that, as an example, illustrate completion percentage by target location.
We will illustrate the possibilities in the context of two examples.
The evolution of Tyreek Hill
A metric which describes the usage of a skill position player is more often than not among the most stable metrics we can find in football. In other words, the usage of a player tends to stay constant over time. This is why it’s interesting to search for players whose usage has changed. Tyreek Hill presents a very interesting on-field case study.
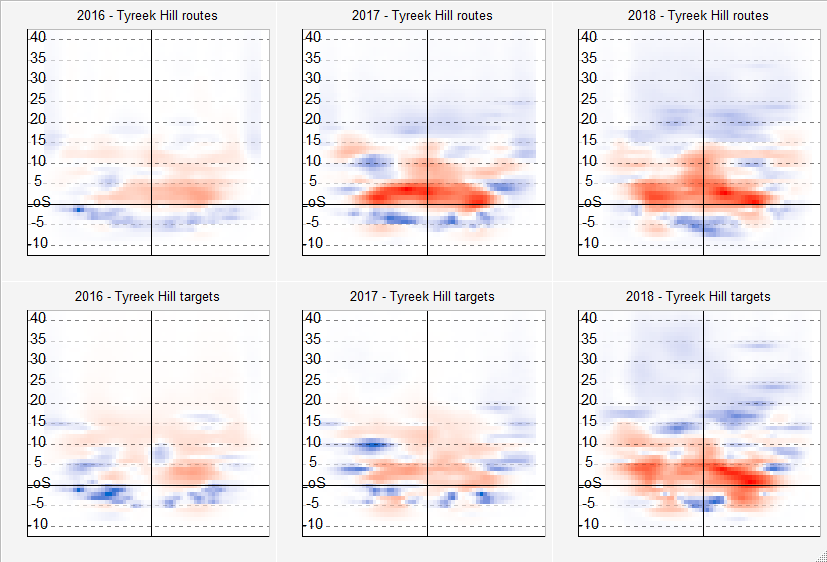
The graphic implies he always used to be a receiver who mostly either runs routes behind the line of scrimmage as part of a screen pass or jet motion or he runs deep routes. Both options properly utilize his speed. In each of his three seasons, he ran at least 54% of his routes either behind the line of scrimmage or at least 15 yards deep. The NFL average is 42%.
However, we notice that the rate at which he ran either of these two options changed over time, and his deep usage spread all across the field after he earned Andy Reid’s trust during his rookie season. In 2016, 21% of his routes were of the very short type and 35% of his routes were supposed to be targeted 15 yards or deeper. These figures moved to 14% and 40%, respectively, in 2017 and to 14% and 42%, respectively, in 2018.
Even more eye-popping are his targets. The graphic shows us that he earned much more targets down the field in 2018 compared to his first two years in the league. It’s natural to address this change to replacing Alex Smith with Patrick Mahomes, who seems to have unleashed the full potential of Tyreek Hill.
Expected targets
To further strengthen these observations with numbers, we have created a metric called expected targets. Based on the data we’ve charted for each route run in the league, we have created a model which assigns a target percentage to each route run. Among many, the most important features of this model are the numbers of routes that the team runs on this play, the depth of the route and whether the player himself runs a screen route (indicating a high target percentage) or a teammate of the player runs a screen route (indicating a low target percentage). Using the model we can take any set of routes run in the league, compute the number of targets we would expect these route runs to draw and compare it to the actual number of targets we observed.
This has been done before. However, we can now combine this with our heat maps to compute and visualize targets over expectation broken down by area of the field. There is even better news for the numbers crowd: If we break down targets over expectation into four basic areas via the binary distinctions middle or outside and more or less than 10 yards downfield, targets over expectation are still a sticky metric on the player level. This means that a player who tends to earn a lot or very little targets over the deep of the middle field is generally expected to continue this, especially when staying in the same system. The same holds for the other areas of the field.
Without further ado, here are the results for Tyreek Hill:
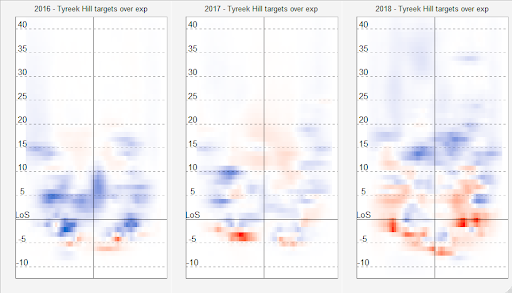
There is a lot of blue, suggesting that Tyreek Hill is a good player. While this is not news, the interesting part is that the blue areas have moved from short to deep over the course of the last three years. Through 2016 and 2017, Tyreek Hill was expected to earn 40 targets 15 or more yards down the field, and he was targeted 47 times on such routes. This is a fairly good start of a career, but there was still room for improvement. Leave it to Patrick Mahomes to realize this: In 2018, he was supposed to be targeted 43 times at a depth of at least 15 yards, and he ended up earning a whopping 63 such targets.
On routes behind the line of scrimmage, he started becoming more of a decoy in 2018. While being targeted over expectation when running these short routes in his first two seasons, he earned eight targets less than expected in 2018, suggesting that he functioned as someone who draws attention of the defense with misdirection while Patrick Mahomes threw the ball downfield to another receiving weapon like Travis Kelce, who himself earned 27 targets over expectation when running 10 yards or deeper. Since these throws are generally more valuable than very short throws, this reflects the near-to-perfect usage of Tyreek Hill in 2018 once Mahomes and Andy Reid paired up to take the league by storm.
Will Matt Stafford finally air it out in 2019?
Another feature of our analysis is that we can add additional context to a quarterback’s average pass depth. Based on all routes and the target percentage of these routes, we can give an estimate for the average depth we expect a quarterback to throw his passes at and compare it to the actual depth of target.
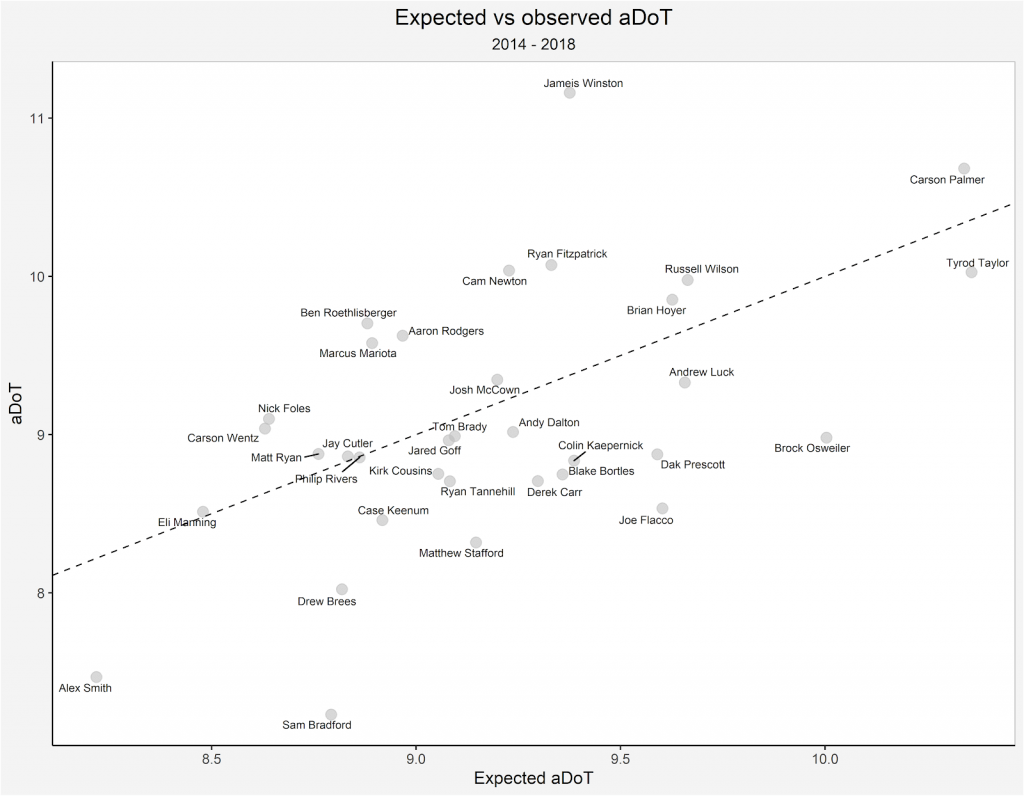
Safe to say nobody will be surprised that Alex Smith and Sam Bradford haven’t aired it out and it’s also well known that Drew Brees pivots to a precise, short-passing game that methodologically marches down the field. What might catch a few off-guard is that Matthew Stafford is among the most conservative passers when it comes to this measure, but the visualization of the Lions' routes and targets is striking. Stafford was expected to throw much more deep balls than he did, especially toward the valuable area 10-to-20 yards deep at the middle of the field. The routes run by the Detroit Lions suggested an aDoT of 9.2 — his actual aDoT was 8.3. While relying a lot on short throws, the Lions have to get credit for being good at what they did: Only the Falcons and Patriots gained more expected points added (EPA) per pass on passes not deeper than nine yards down the field from 2014 to Week 8 of 2018. They proceeded to trade away Golden Tate, and their short passing game fell off a cliff. From Week 9 going forward, they were among only three teams that gained negative EPA per pass on such passes.
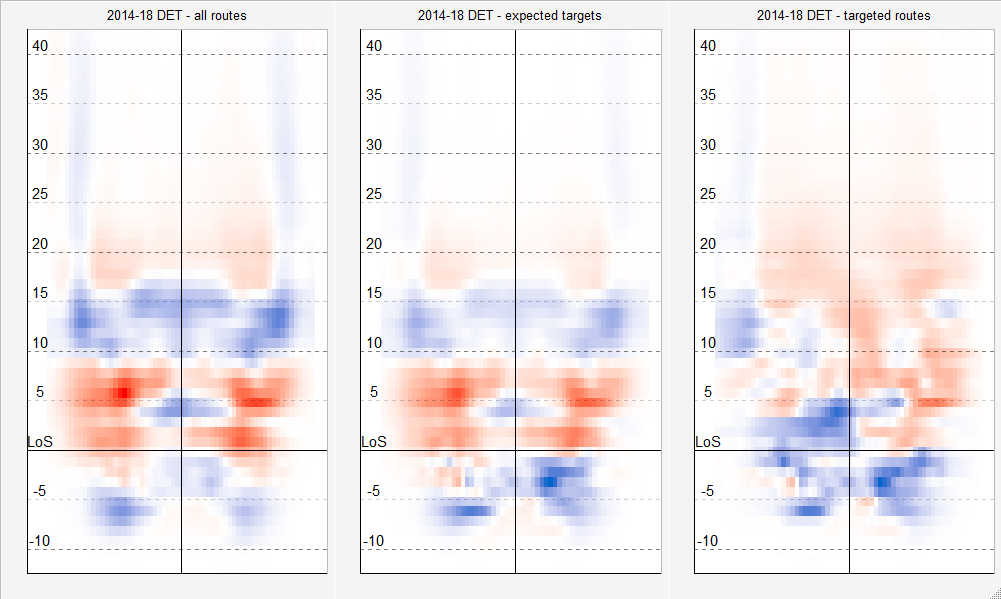
They also parted ways with Eric Ebron prior to last season and replaced him with Iowa standout T.J. Hockenson in this year’s draft. On average, Hockenson earned his targets 10.6 yards down the field in his last college season, compared to Eric Ebron’s 8.0 yards when targeted by Stafford. These moves leave the Lions with Marvin Jones Jr., Kenny Golladay and T.J. Hockenson as their premier weapons in the passing game, all of whom are primed to attack the defense down the field. If Matthew Stafford doesn’t rely too much on the newly acquired Danny Amendola, we could see him pushing the ball down the field more aggressively than in recent years.
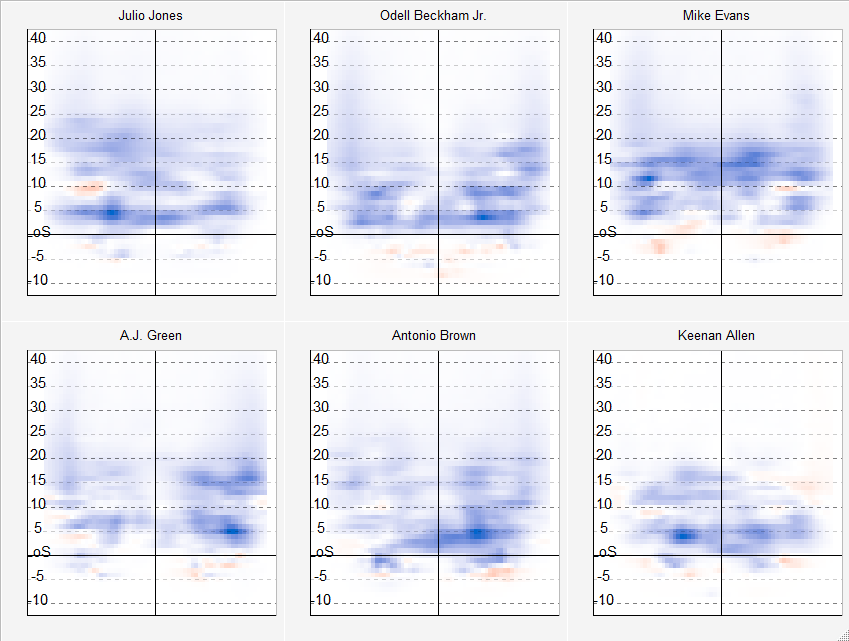
The best players at earning targets
Since we can now compute which players earned the most targets above expectation, we want to look at the best players by that measure.
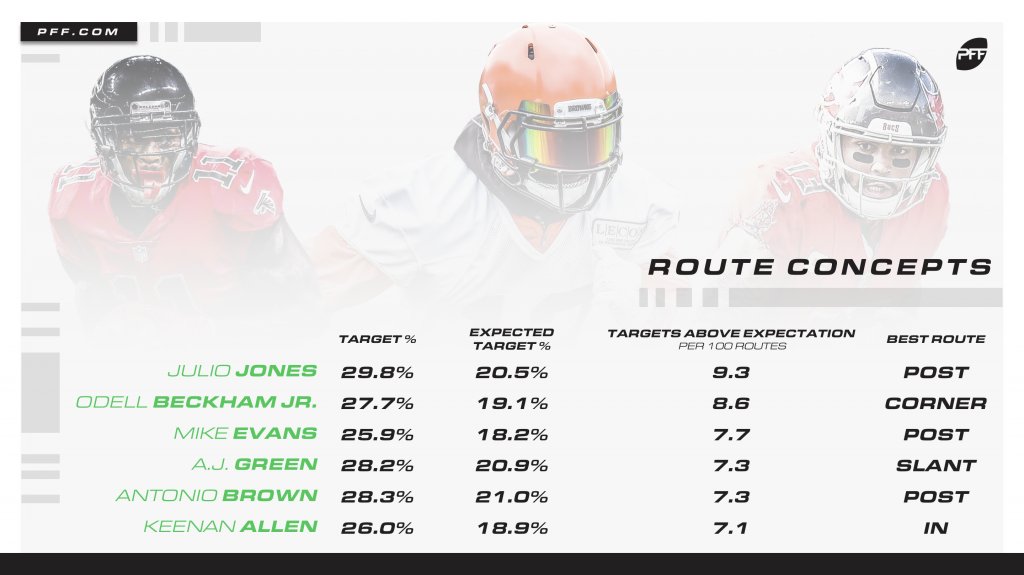
It is no surprise that Julio Jones, the perennial league-leader in yards per route run, also earns the most targets of all receivers in the league. It’s hard to find a weakness in his game, given that he earns 5% more targets than expected on every route type that he's run at least 100 times in his career. His post route still stands out — he averages a ridiculous 5.1 yards per route run on these.
Odell Beckham Jr. comes up second in this list, and we are thrilled to watch his ceiling once these targets come from a promising young quarterback. His best route is the corner route, on which he trails only Julio Jones in yards per route run.
Mike Evans is a target magnet, even though he's run the deepest set of routes among these receivers. Since coming into the league in 2014, nobody earned a greater share of his targets beyond the sticks, mostly because his post route is the most targeted receiver-route combination since 2014.
People forgot how good A.J. Green is after things went south for the Bengals post-2015. He still summons nightmares in opposing secondaries, especially with his prolific slant route, on which he leads all wide receivers in yards per route run since 2014.
Antonio Brown has been the most consistently dominant wide receiver earning more Wins Above Replacement than any receiver since he entered the league. He is averaging at least 2.2 yards per route run on each of the nine routes that he's run at least 100 times since 2014. No other receiver can boast this type of versatility.
Keenan Allen earns most of his targets on in-breaking routes — like in, slant and drag routes — while being not as dominant on the vertical part of the route tree. Subsequently, he has the lowest aDoT among this group. He is also the only player on this list with a real weakness: On go routes, Allen gets targeted below expectation and averages only 0.8 yards per route run.
Where did these players earn their targets? The answer is simple. The best receivers of the league earn their targets all over the field no matter where they are supposed to run.
The role of depth when putting value on a skill position player
FiveThirtyEight‘s Josh Hermsmeyer showed long ago that targeted air yards and average depth of target are invaluable metrics when predicting fantasy value. A player being targeted 20 yards down the field promises to get a lot more yards than a player targeted five yards down the field. However, in real football, we don’t measure the value by total yards. The value of a player has to be measured by answering the question of how much it would hurt the team if the player has to be replaced.
To get a measure of this, we simulated samples of 600 typical routes run by an outside receiver, a slot receiver (running mostly shorter routes) and a running back. We split each case again into three cases: A player earning targets at an above-average rate (one standard deviation), a player earning targets at an average rate, and a player earning targets at a below-average rate. For each simulation, we compute the total expected points added the receiver gains through targets on these 600 routes (roughly a season’s worth of workload) when playing with an average quarterback. These are the resulting distributions.
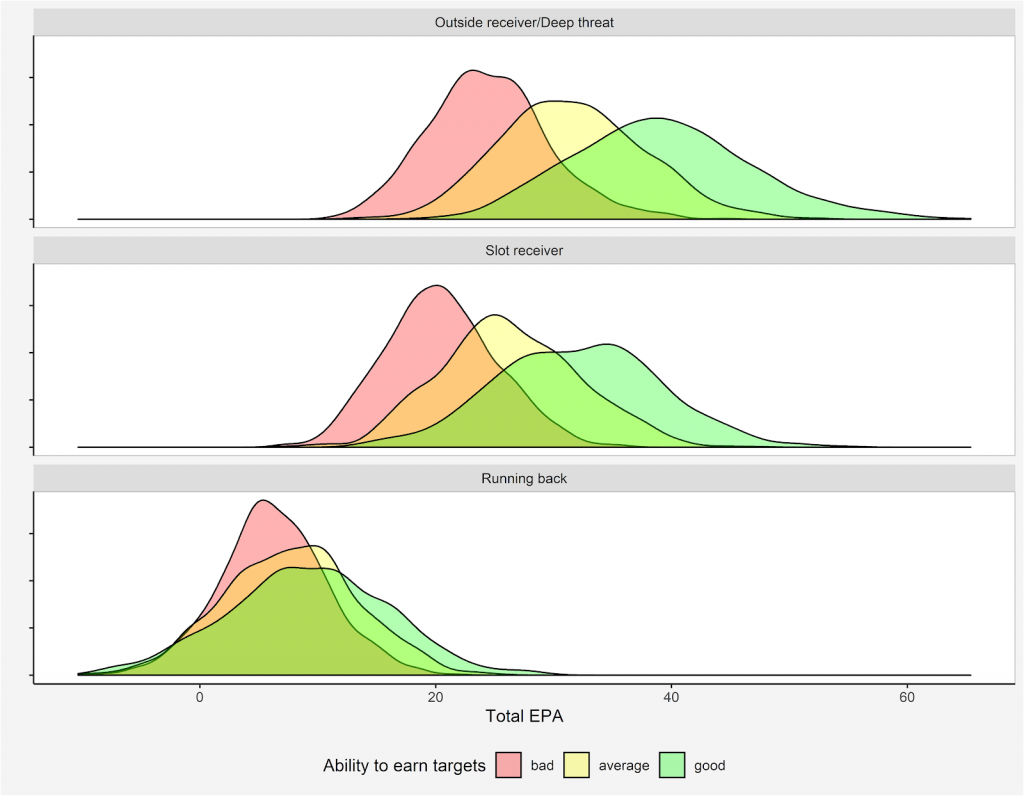
An outside or slot receiver is expected to produce more EPA, but the main point is the difference between a good and a bad player. For outside receivers, we expect a difference of 15 EPA, for slot receivers we expect a difference of 12 EPA and for running back we expect a difference of only 3 EPA. This difference is mainly driven by average depth of target, and the result is not surprising. A deep pass gains more EPA on average, so earning the same amount of additional targets deep down the field yields a higher difference in value than earning those targets near the line of scrimmage. While there is still a lot of research to be done, this suggests that even after getting rid of the volume discrepancies, losing a good outside receiver hurts a team's passing game more than losing a good running back.
[Editor's note: For more in-depth analysis, subscribe to the PFF Forecast, and to keep up to date with the latest from the PFF research and development team, follow @PFF_Moo, @PFF_Eric, @PFF_George and @KevinCole_PFF on Twitter.]
