One of the most useful elements of PFF’s play-by-play grading system is the route-charting process, which has recorded every route run by every eligible receiver on every passing play since 2014.
The data recorded allows us to do a number of things, from evaluating the performance of individual players to evaluating the schemes in which they play. In this article, we’re going to use the data to rank receivers on different route types. We’ll discover just who excels at running deep post routes, who is most productive when running hitch routes and much, much more.
Measuring wide receivers
We use three key stats to measure the ability of a wide receiver:
- PFF receiving grade — We grade every receiver on every play of every game, independent from the quarterback. Receiving grades can be found in PFF’s Premium Stats database.
- Production per route run — After all, the NFL is a production business. We’ll look at how many touchdowns, first downs and yards a wide receiver has recorded whenever he has lined up to run a route. We will count all yards, add 9 yards for each first down and add 20 yards for each touchdown — click here for an explanation of our method — and divide the total number by the number of routes the receiver ran. As we did before, we will refer to this as adjusted yards per route run (adj. YPRR).
- Target rate — We will also calculate how often a wide receiver is targeted when running a route. While this ignores whether the target was actually successful, it still carries a lot of signal for skill because receivers are rarely targeted if they can’t get open. However, not all routes are the same when it comes to how often receivers are targeted while running them. To address this oversight, we use a model that determines the probability that a given route is targeted based on the details of the route (route type, pre-snap alignment and route depth), the coverage scheme and other situational/playcall factors. Based on the results of this model, we created a targets above expectation metric. We will report this metric as targets above expectation per 100 routes run (TAE100), which is simply the number of targets a receiver gains above an average receiver whenever he runs 100 routes.
With year-to-year R-squared values of around 0.3, these three metrics are the most stable existing metrics that measure wide receiver performance.
To illustrate how earning targets carries a signal of skill, note that our targets above expectation metric predicts adjusted yards per route run in the next year with a very good R-squared value of 0.25. In comparison, what happens after the quarterback decides to target a given receiver — as measured by yards per target — predicts next year’s adjusted yards per route run only with an R-squared value of 0.08.
[Editor’s Note: PFF’s advanced statistics and player grades are powered by AWS machine learning capabilities.]
The Analytics: Does performance for one route type mean anything, or is it only noise?
At the very least, ranking receivers by route type yields interesting anecdotes, but a natural question when splitting a receiver’s performance by route type is whether this can tell us anything going forward. Like with all splits into smaller sample sizes, the concern is that we measure more noise than anything else.
Of course, performance on individual routes isn’t as stable as performance on all routes. However, individual routes are not as noisy as one might think.
The litmus test for whether a split has an inherent meaning or not is whether performance in the split is better predicted by performance out of the split (when this sample is larger). This is the case for many meaningless splits.
We can use the same test for individual route types because not even the most specialized wide receivers spend their time running just one particular route. Instead, receivers run a number of different routes over the course of the season (the “most specialized” receiver in our data set is Terrance Williams, who ran a go route on 40% of his snaps in route last year).
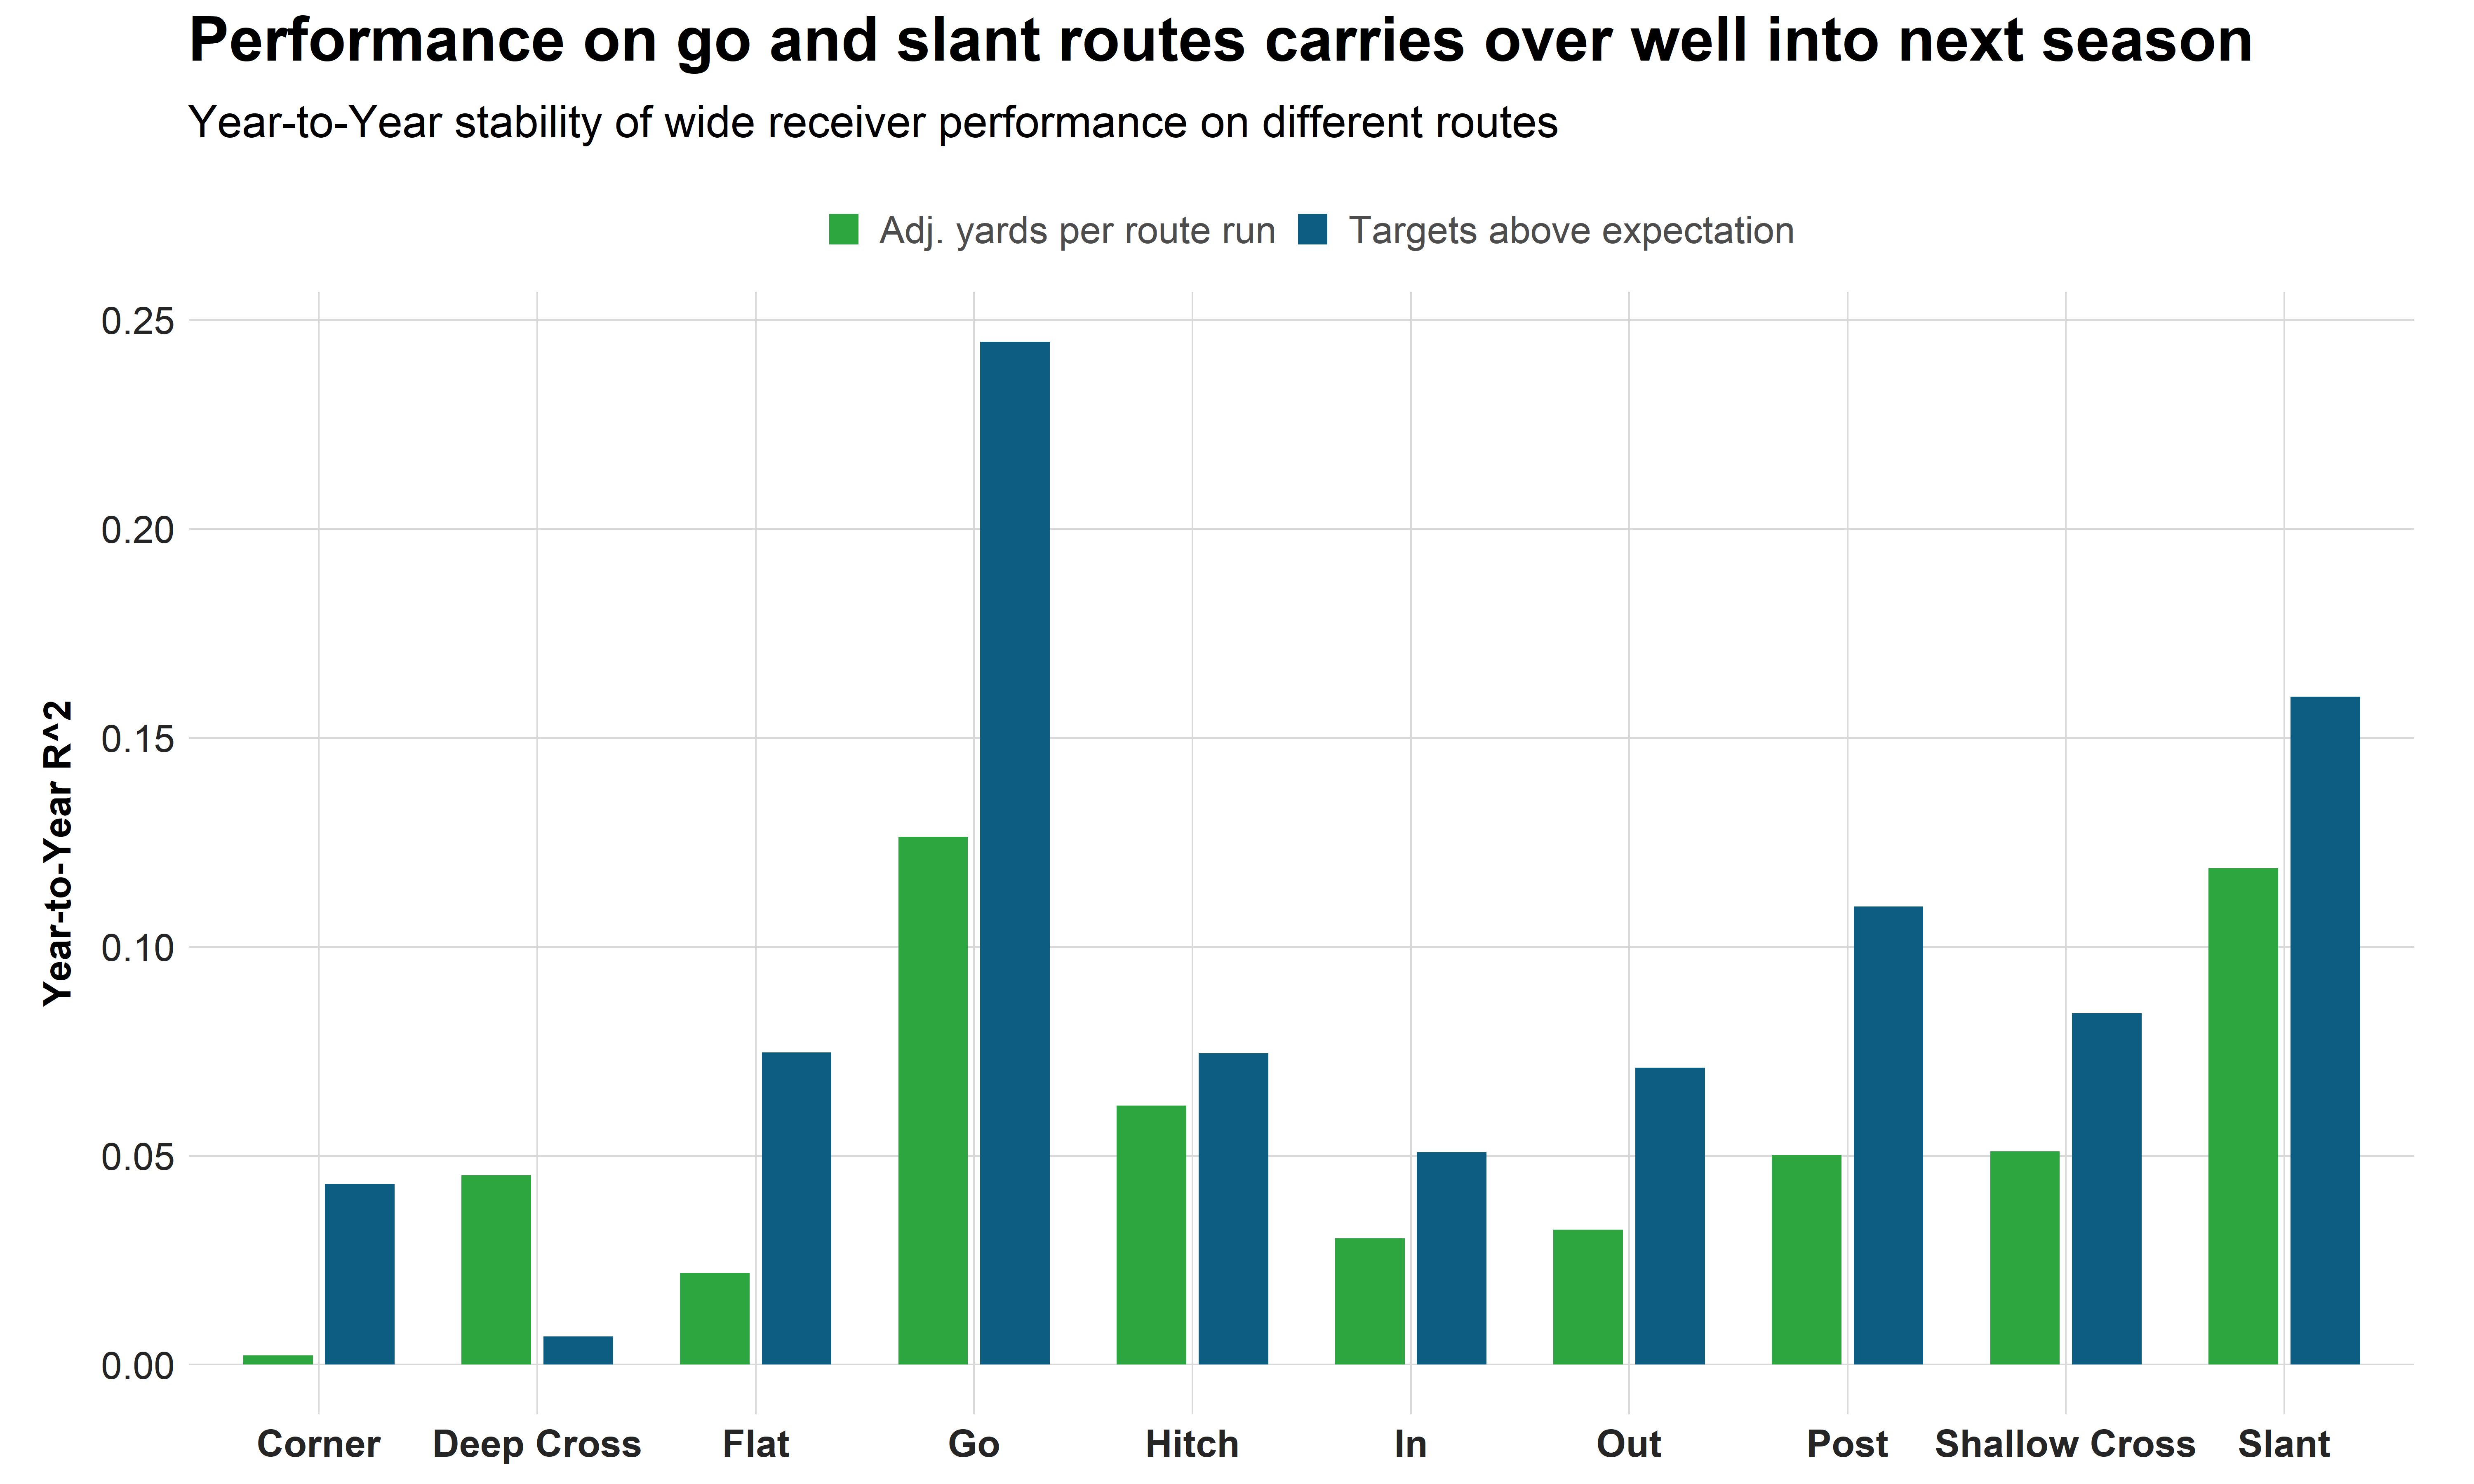
When examining go routes and slant routes, we find that the next year’s performance is better predicted by performance on these routes rather than the performance on all routes, despite the latter having a much larger sample size.
Why is performance on go routes and slant routes more sticky than performance on other routes? Sample size plays a role for go routes, as no route is run more often in the NFL, but slant routes are run less often than post routes, hitch routes, in-routes and out-routes. A potential reason for this is that slants are considered to be man-beaters — consequently, no route is run more often against man coverage. We have also found that a receiver’s performance against man coverage is more stable than against zone coverage, which yields a possible explanation for why performance on slant routes is more stable than sample size would suggest.
It is notable that while go and slant routes are evidently the most sticky routes, all other routes provide meaningful splits, too. For that matter, we need a more nuanced method and consider the example of performance on corner routes, which is one of the least sticky routes according to the chart above. We run the following analysis:
We predict a receivers’ performance on corner routes in Year N+1 with:
- His performance on all other routes in Year N.
- His performance on a random sample of routes with the same sample size.
If the split is meaningful, we expect the latter to yield better predictions. If the split is not meaningful, we expect both to yield the same prediction. In other words, since the sample sizes for individual routes are quite small, we find out whether performance on corner routes is meaningful by analyzing whether leaving them out has a higher effect on predictions than leaving a random number of routes of the sample size out.
After iterating the random sampling 500 times, we obtain the following results:
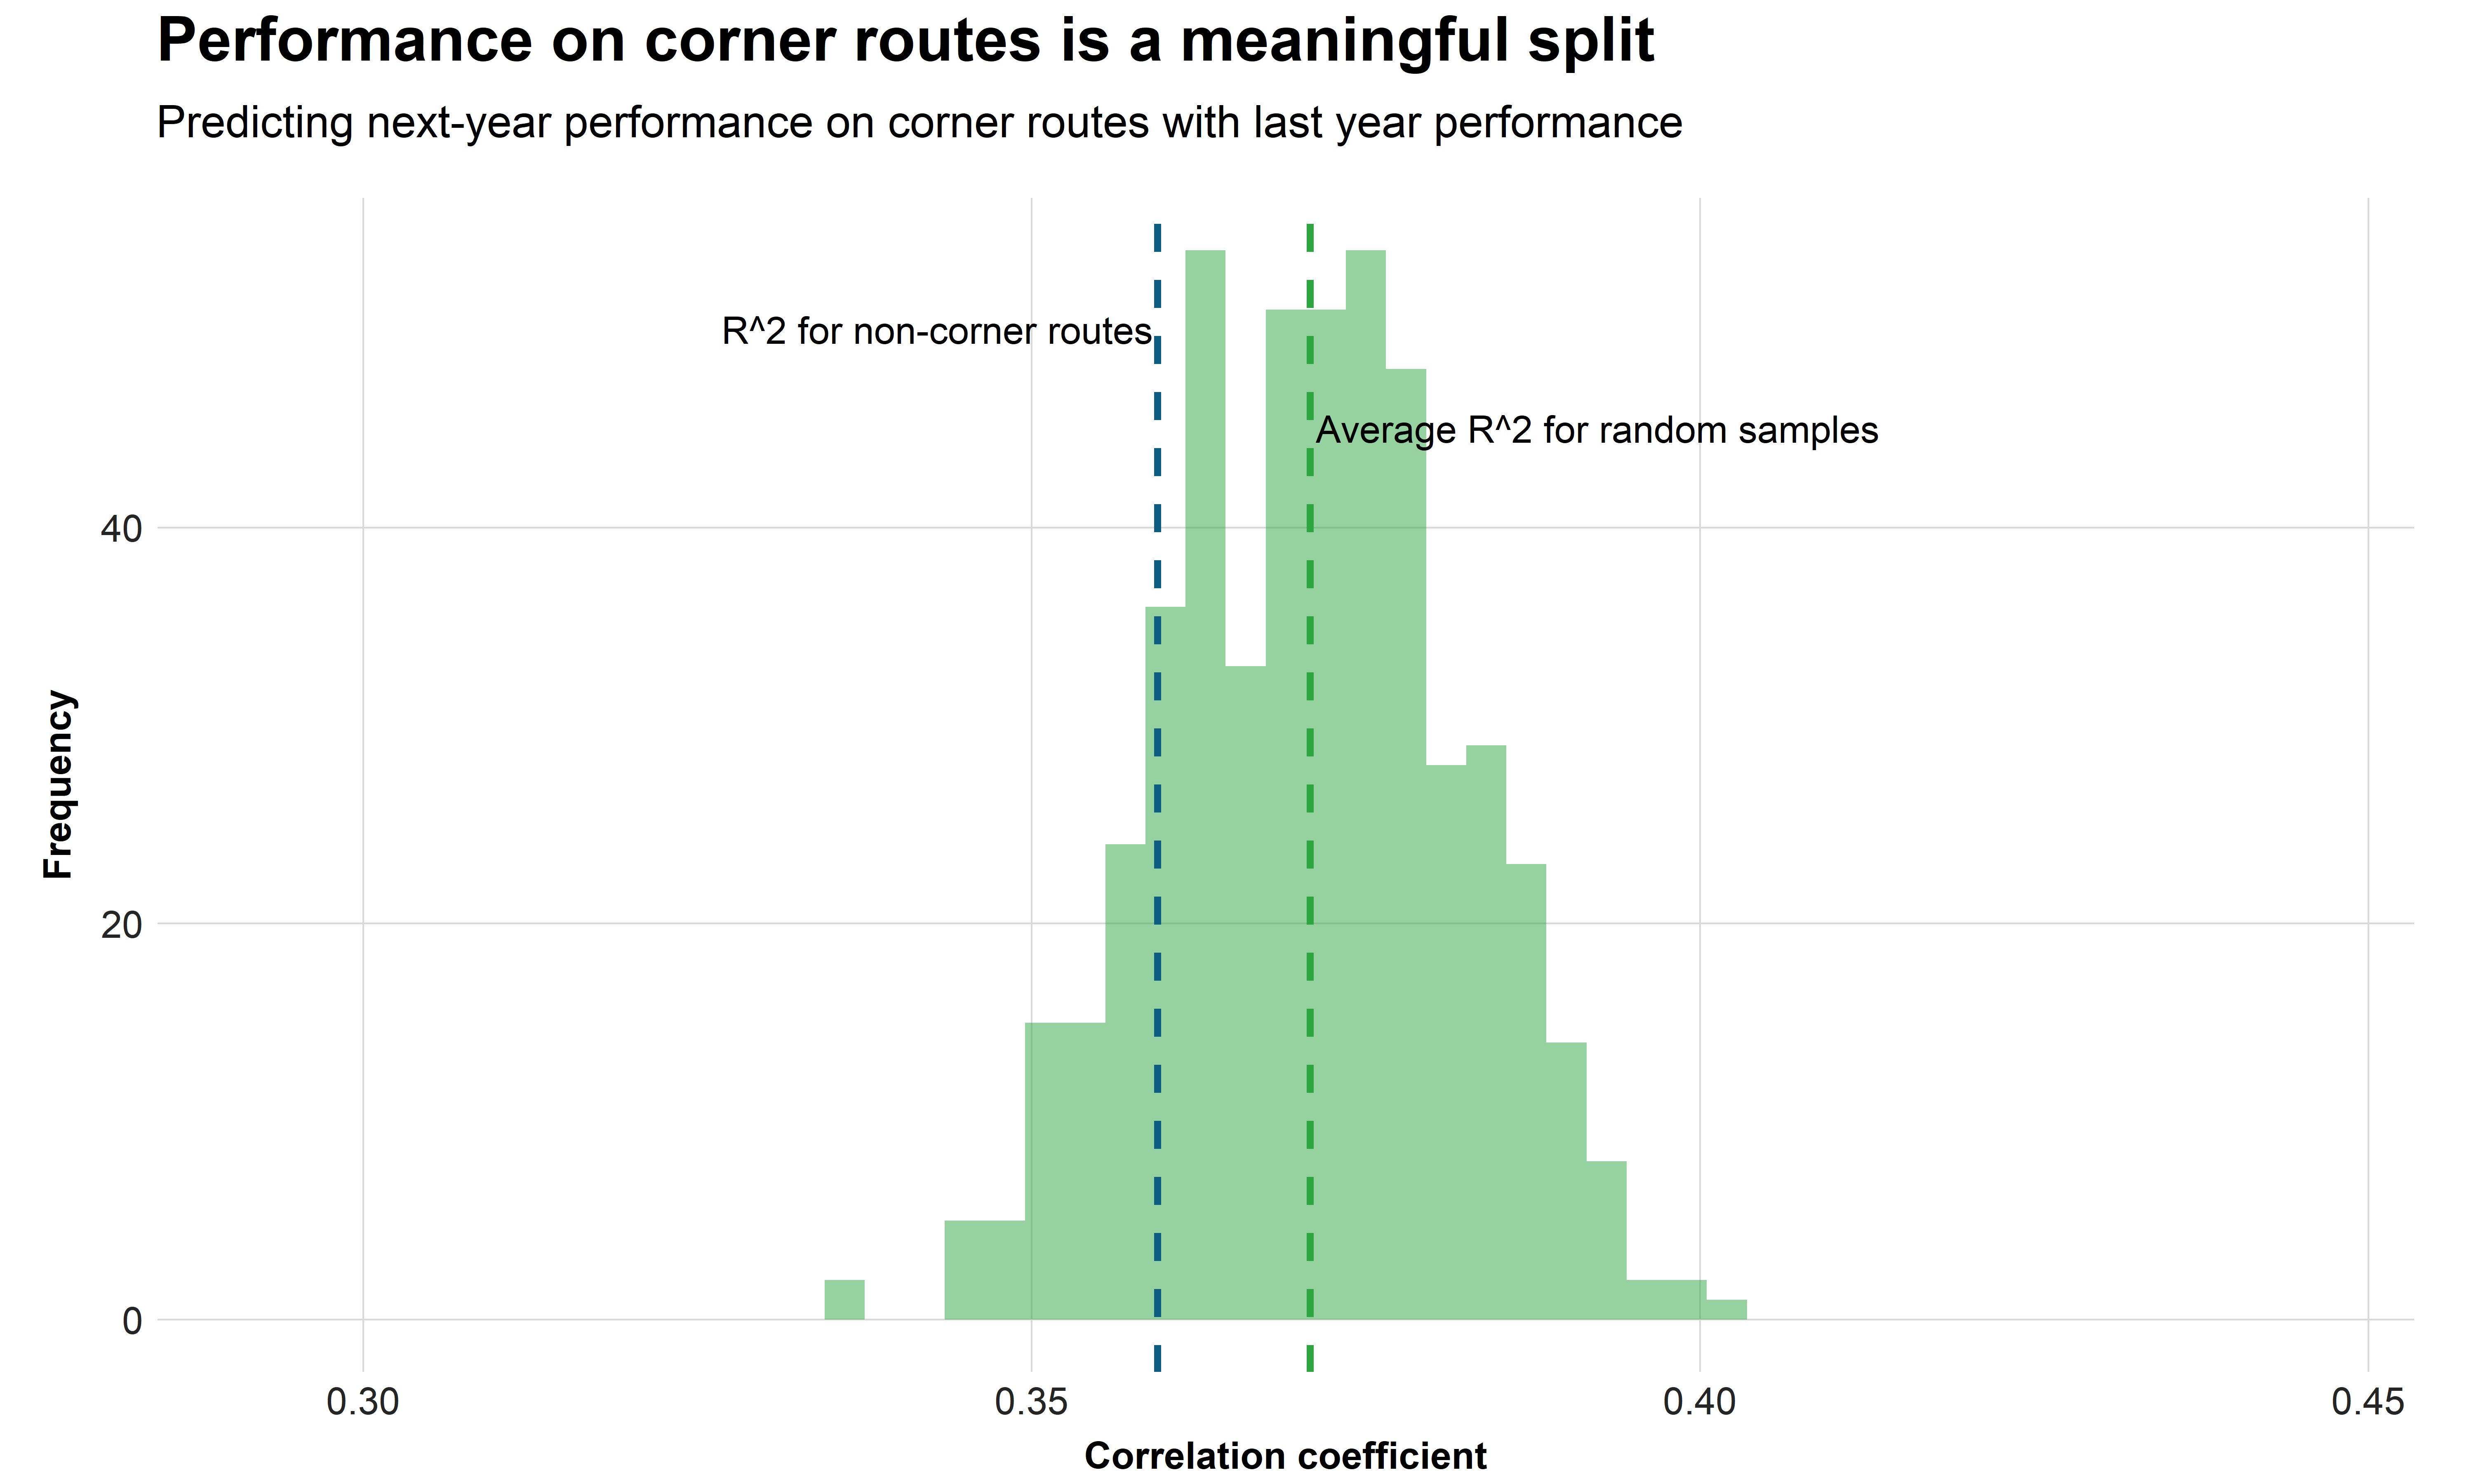
We find that in 85% of our iterations, predicting performance on corner routes with performance on other routes is worse than predicting it with a random sample (which includes some corner routes). In other words, after removing sample size discrepancies, we find that performance on corner routes is better predicted by performance on corner routes rather than by performance on other routes.
Given that all other routes turned out to be more sticky than corner routes on the first chart, it’s not surprising that we find the same for all other routes, particularly deep crossers. The effect is even larger for most other routes, as all of our iterations yielded better predictions for the random sample when looking at slant routes.
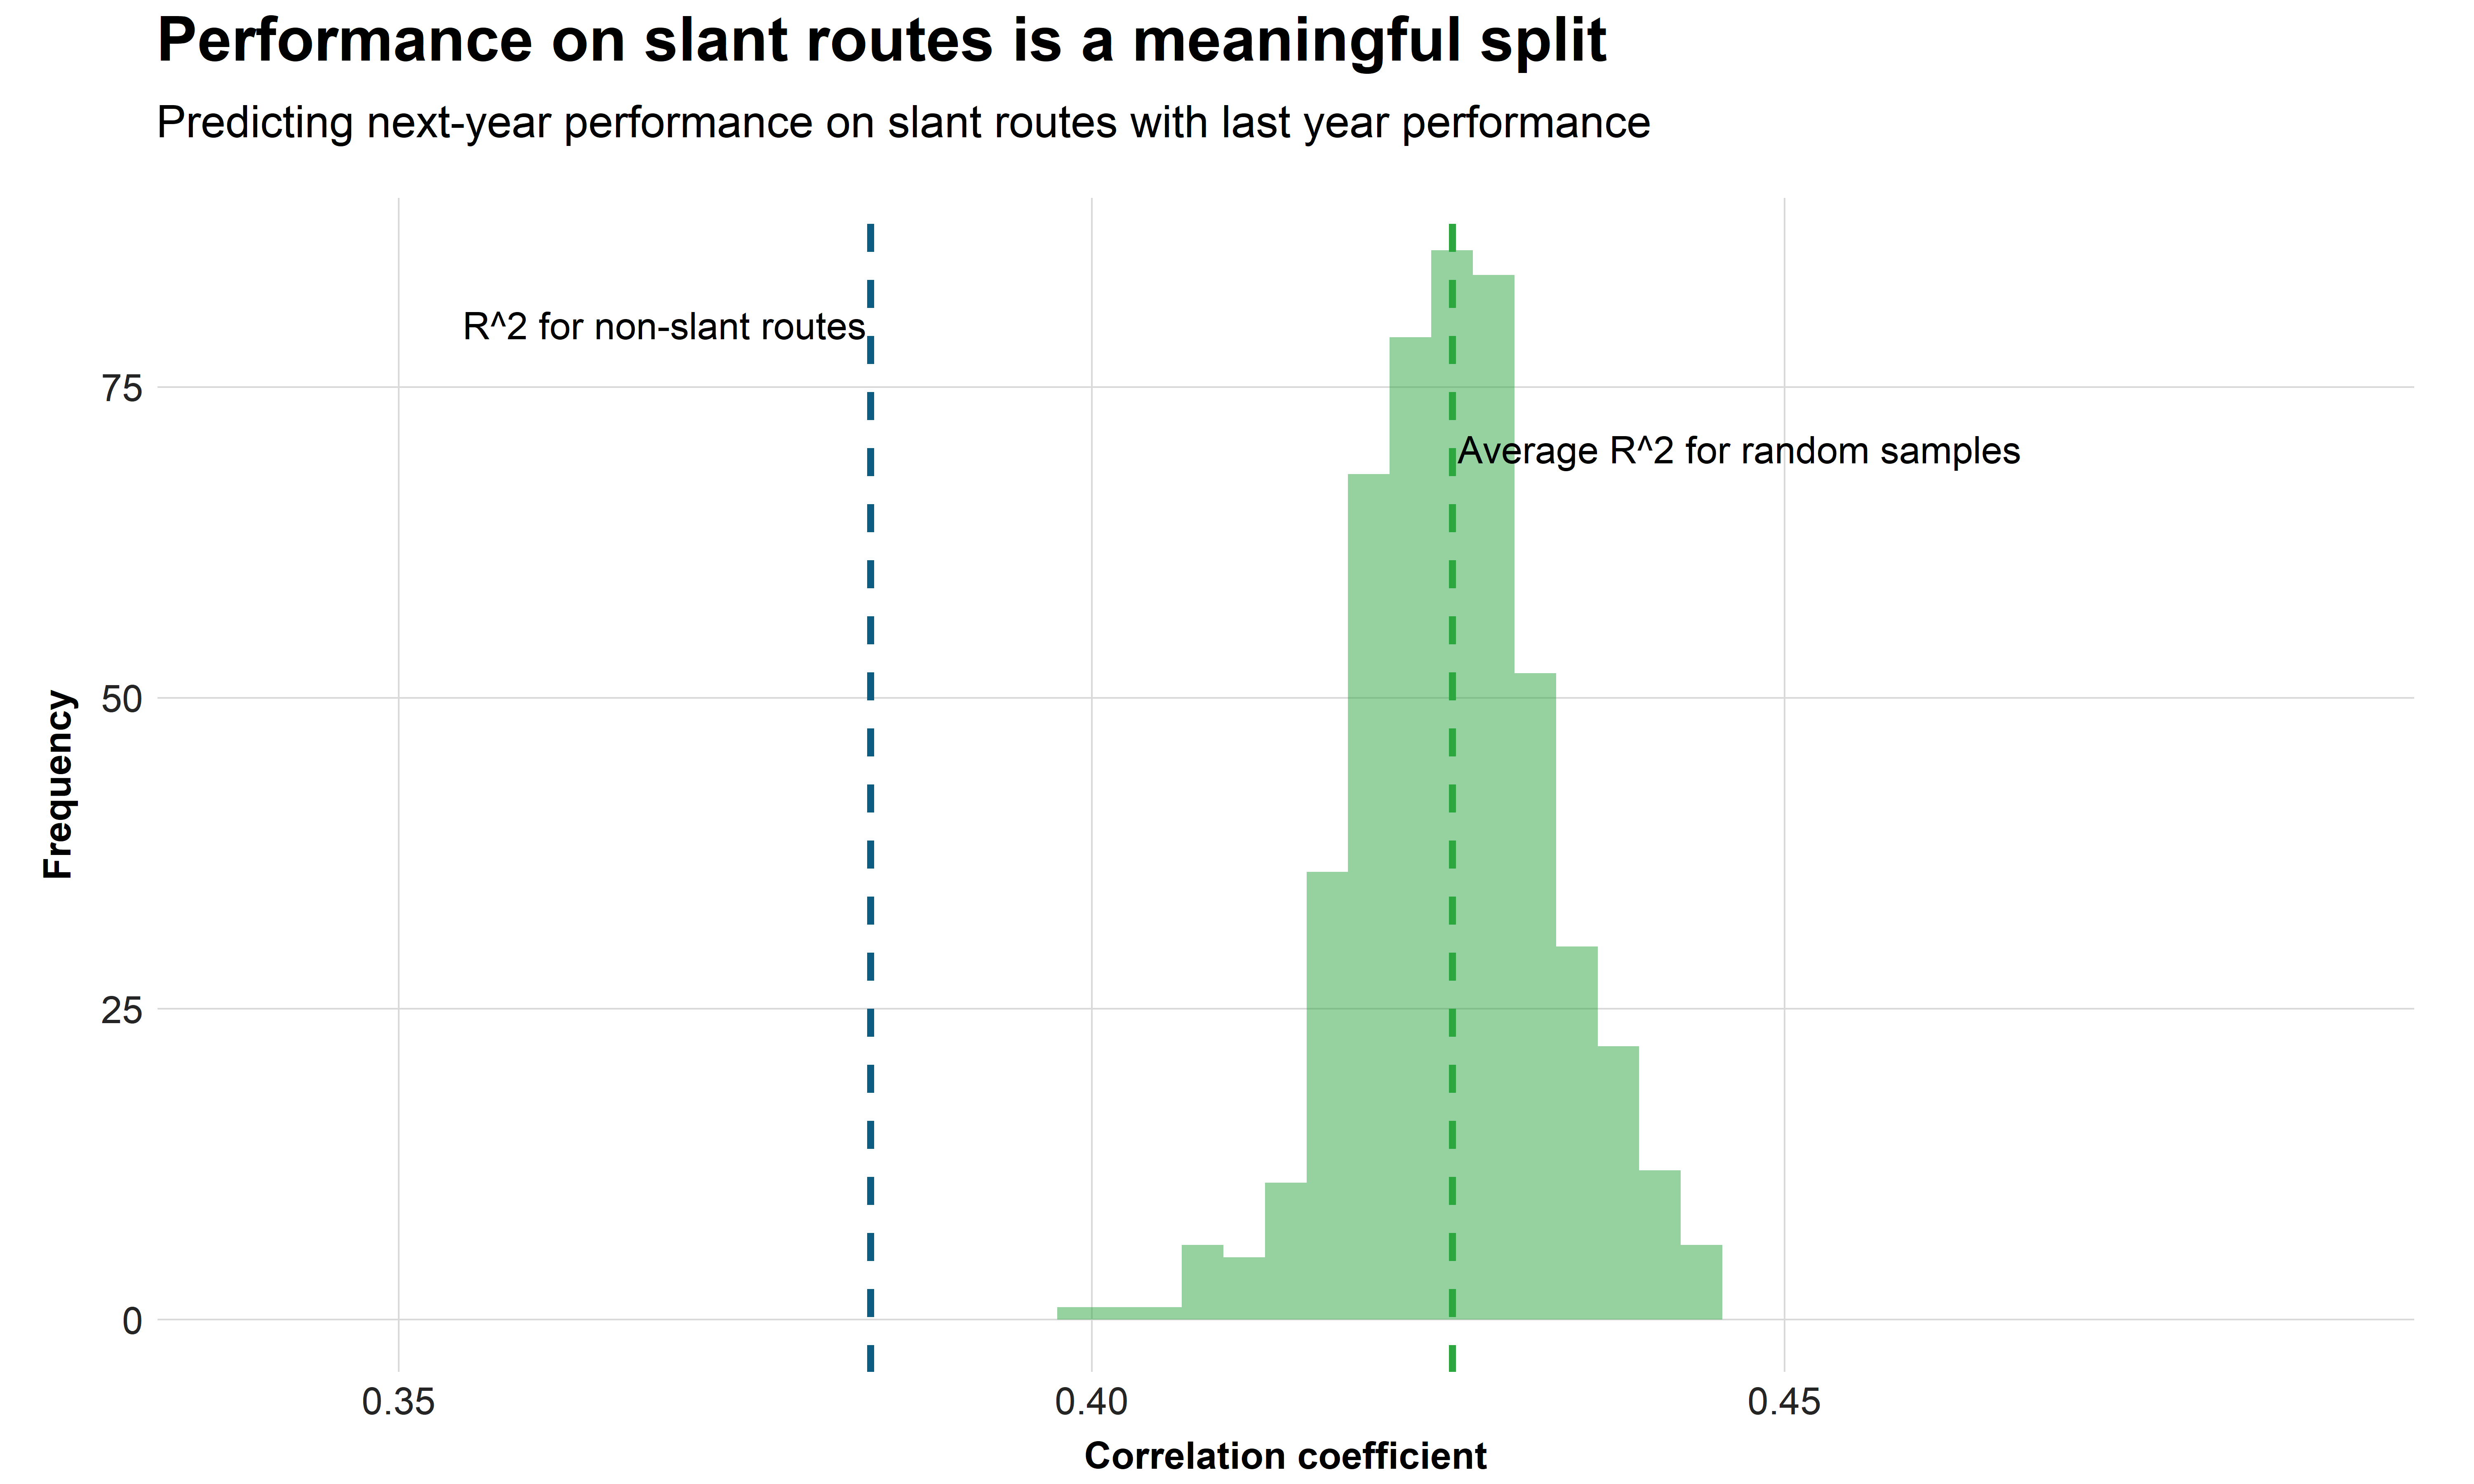
This sounds like a completely trivial statement, but given what we find with other splits in football, it is actually an interesting result — when a player excels on a given route type, we can expect him to continue to do this in the future.
Ranking NFL receivers by individual routes
With our method and reasoning now explained, we can now rank the best three receivers on individual routes. Alongside the measurements we’ve already discussed, we will also add the number of first-down receptions per route run to the tables. Of course, this rate is already included in adjusted yards per route run, but it can be considered to be a measurement of generating consistent value as it’s not affected by big plays like long gains and touchdowns.
While we did find that splitting into different routes gives us meaningful information, the sample size is still king. This is why we look at the last four seasons and consider only players who ran the route in question at least 100 times.
Of course, we don’t want to leave out any young players who might be deserving of a mention, especially if they have excelled across a smaller sample since coming into the league. So, whenever a young player would have made it into the top three (or came close) based on his stats in a smaller sample, we note him as a player to watch out for.
Just as a quarterback is taught to read his receivers from deep to shallow, we will do the same and start with the vertical routes of the tree — the go route, the post route and the corner route — and we’ll progress down the tree based on average depth of target.
