We discussed the PFF WAR draft chart in two recent articles; one saw us use it to examine the “surplus value” of draft picks, the other saw us use it to explain why spending the No. 2 overall pick on Chase Young might be a bad idea. However, up until this point, we had foregone maybe its most natural application, and that is to use it to see which teams have drafted the best in recent memory and to determine if any team was able to beat the draft by being uncharacteristically good.
[Editor's Note: PFF's Wins Above Replacement (WAR) metric is powered by AWS machine learning capabilities.]
Our draft chart yields an expectation for each pick of the draft, so by adding them up for each team, we obtain the draft capital for each team as measured by the expected four-year WAR of the selected players.
Since we care about draft success, we will eventually compare the draft capital to the actual four-year WAR value of the players. Therefore, we have to restrict ourselves to the drafts between 2006 and 2016, as the latter class is obviously the most recent draft class to complete four years in the NFL.
The following chart shows the draft capital for each team during those years along with a 90% credible interval (i.e., under the assumption no team is able to beat the draft, the actual value of the draft picks on the field will fall into the interval 90% of the time).
The first observation is that the uncertainty of the draft is so large that the expectation of the team with the least draft capital is contained in the credible interval for the team with the most draft capital.
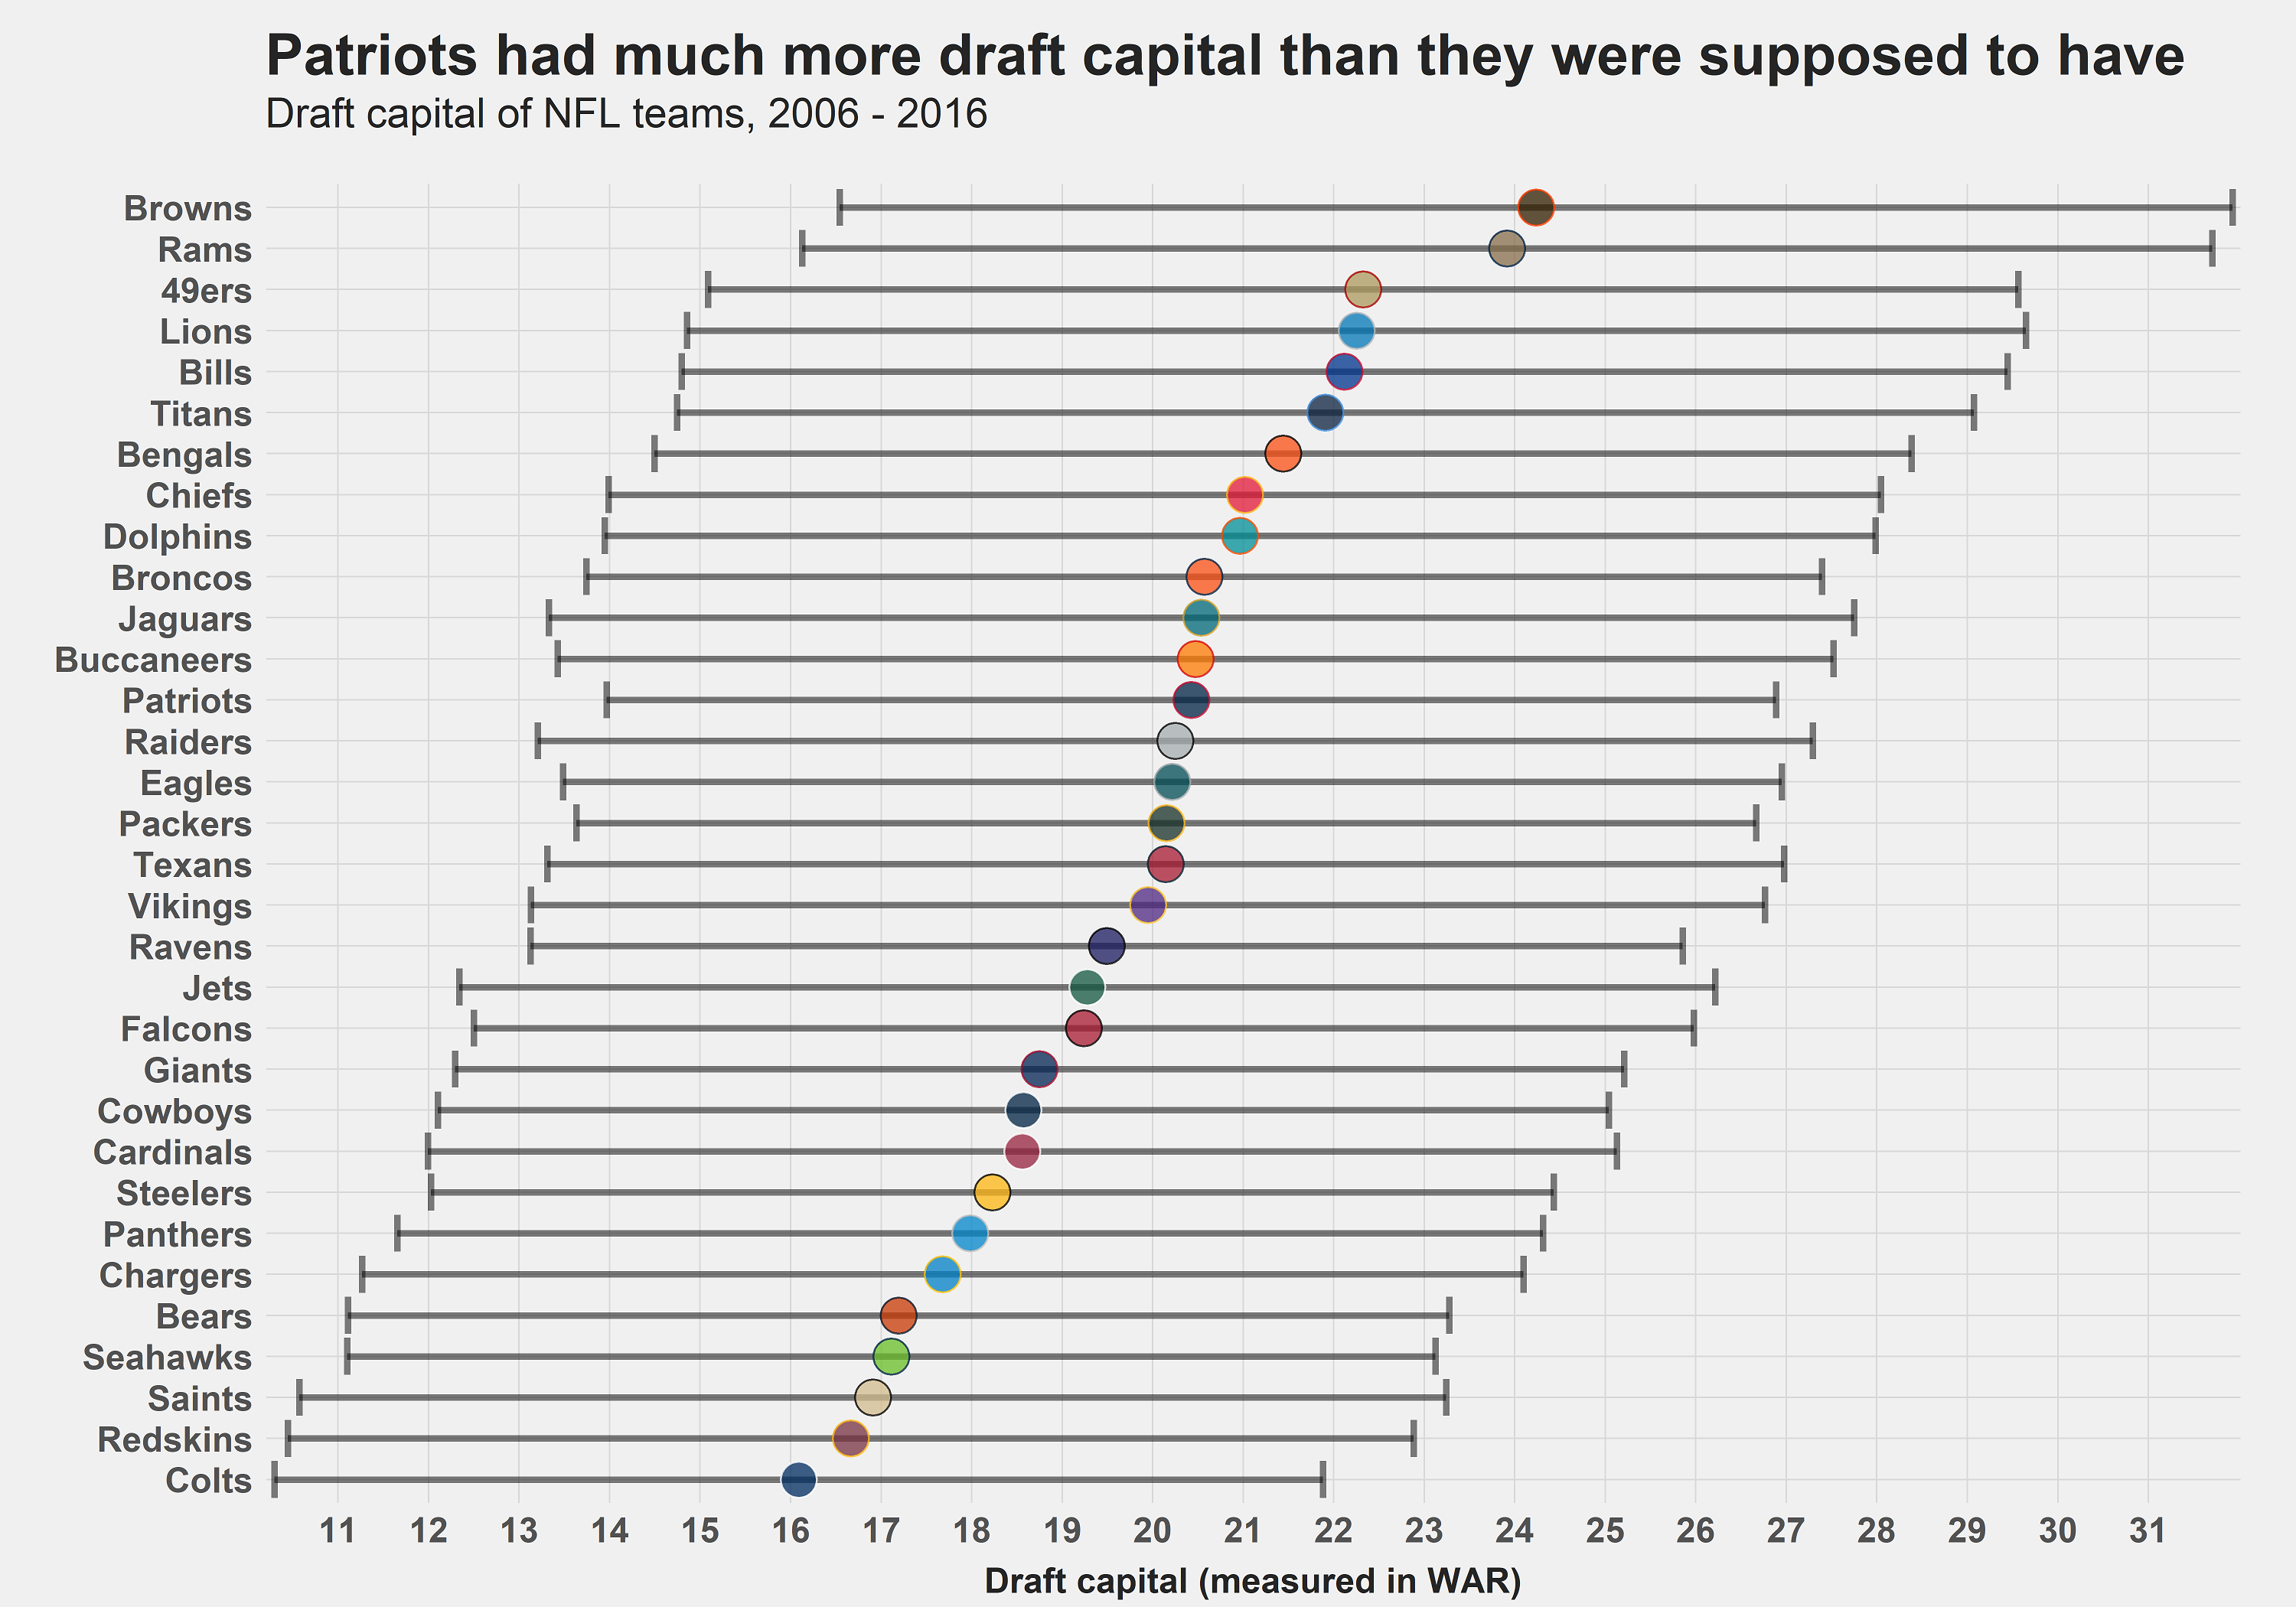
Between 2005 and 2015, the Oakland Raiders, Cleveland Browns and Los Angeles (then St. Louis) Rams won the fewest games, so it’s not surprising to see the Browns and Rams with the most draft capital among all teams. However, the Raiders apparently traded away a lot of draft capital, as they rank behind only the New England Patriots, who won the most games during that timeframe by a fairly wide margin (147 to the Colts' 127) yet still found themselves in the upper half in terms of draft capital.
The Patriots also had to forfeit their 2016 first-round pick due to the fallout from Deflategate, but if we hypothetically had them draft with the 29th overall pick that year, they would have had the eighth-most draft capital in the league despite starting with the lowest draft capital thanks to their sustained excellence on the field.
That was a remarkable effort of maneuvering through both the draft and the trade market, and they gained a competitive edge over other teams in the process.
In one of my previous pieces for PFF.com, I investigated the value of Tom Brady’s salary discounts and found that it was worth roughly 1.5 wins over 15 years when compared to being paid like Peyton Manning. Looking at the chart above, we’d say that their prowess in accumulating draft capital was indeed worth more than Brady’s discounts, as they gained five wins over the Indianapolis Colts simply through making smart moves before or during the draft (before accounting for whether the teams actually picked good players).
On the other end of the spectrum, the Washington Redskins ranked 25th among the 32 teams in terms of wins from 2005-15, yet they had the second least draft capital. Even if we forget about the trade to select Robert Griffin III — when they gave up two WAR in draft capital, which can be worth it when drafting a quarterback — they still had only marginally more draft capital than the Pittsburgh Steelers, who won almost 50 more games during that stretch. Other teams who gave up a lot of draft capital were the New Orleans Saints and the Chicago Bears.
The Saints found the most value
We are going to compare the draft capital to the observed four-year WAR of all drafted players for each team and obtain a first measure of draft success.
Since quarterbacks are extreme outliers (e.g., Matt Ryan, who is the most valuable player in terms of four-year WAR drafted since 2006, gained more than five WAR more than the best non-quarterback during the first four years in the league), we exclude quarterbacks from the equation. By doing this, we can see only the value gained to the draft capital for only non-quarterbacks (in the chart above, this is generally lower than for teams that were forced to pick more than one quarterback).
To avoid confusion, we are talking about three different numbers in the following section:
1.) The draft capital, as already discussed, is the expected WAR the draft picks were supposed to yield.
2.) The observed draft value is the actual WAR those picked produced on the field.
3). Draft success is the difference between those two numbers.
Without further ado, here are the results for all 32 NFL teams:
