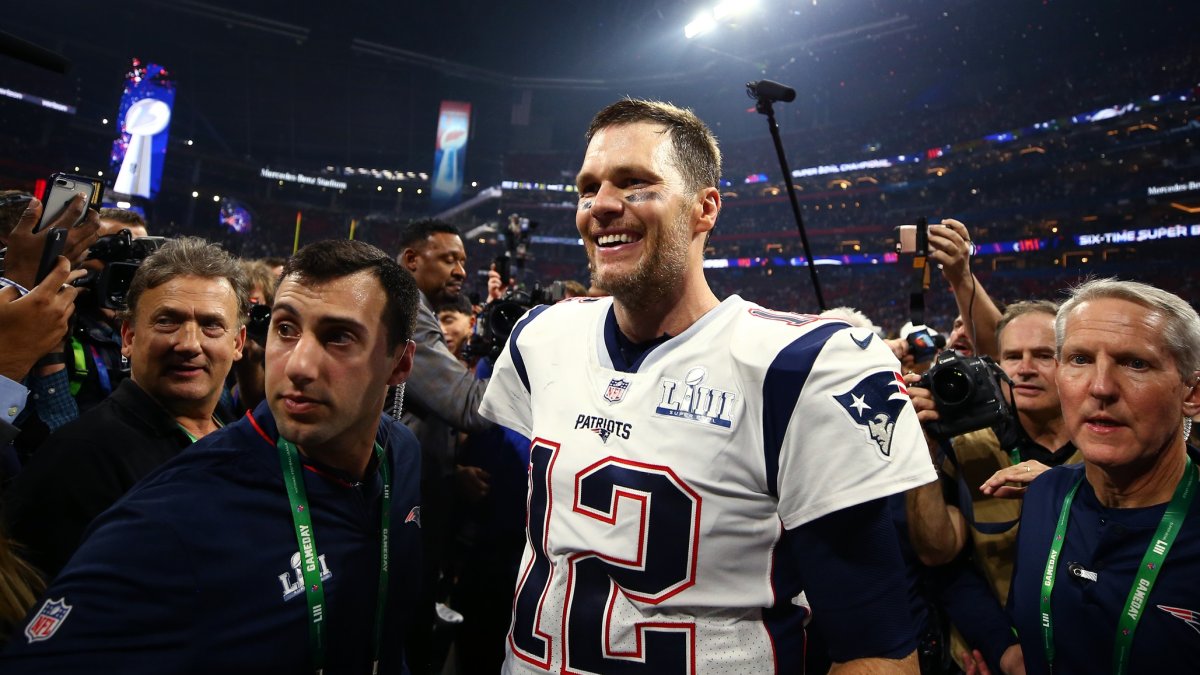
At this point, we still don’t know whether Tom Brady’s game-sealing pick-six against the Tennessee Titans was his last pass for the New England Patriots, as he has already stated that it's “pretty unlikely” he'll retire this offseason. However, the end of one of the greatest dynasties in NFL history has never felt more inevitable after New England’s streak of AFC Championship appearances ended on Saturday night when the Patriots' offense couldn’t score a point in the second half of their wild-card bout against Tennessee.
Along with head coach Bill Belichick, Tom Brady is connected to the Patriots’ unrivaled success over the last 19 years like no one else, and while his play has been analyzed in every detail over the years, he also added value to his team with the contracts he signed.
For a long time, we didn’t have the proper tools to assign a number to a player who some would call the MVP of the dynasty. However, thanks to the recent work of our data scientists Eric Eager (who developed the PFF WAR metric) and Kevin Cole (who worked with salary and contract data to translate cap hits into wins and vice versa) as well as the data from Jason Fitzgerald from OverTheCap.com, we can now come up with how many wins Tom Brady added to his team by signing contracts that underpaid him.
Brady routinely outperformed his price tag
Our PFF WAR values date back to 2006 — the year PFF started grading every player on every play of every game. Since then, Brady has averaged 0.4 WAR more than the fifth-most valuable quarterback in a given season, but his cap hit has been $1.9M lower on average than the fifth-highest cap hit among quarterbacks in each season.
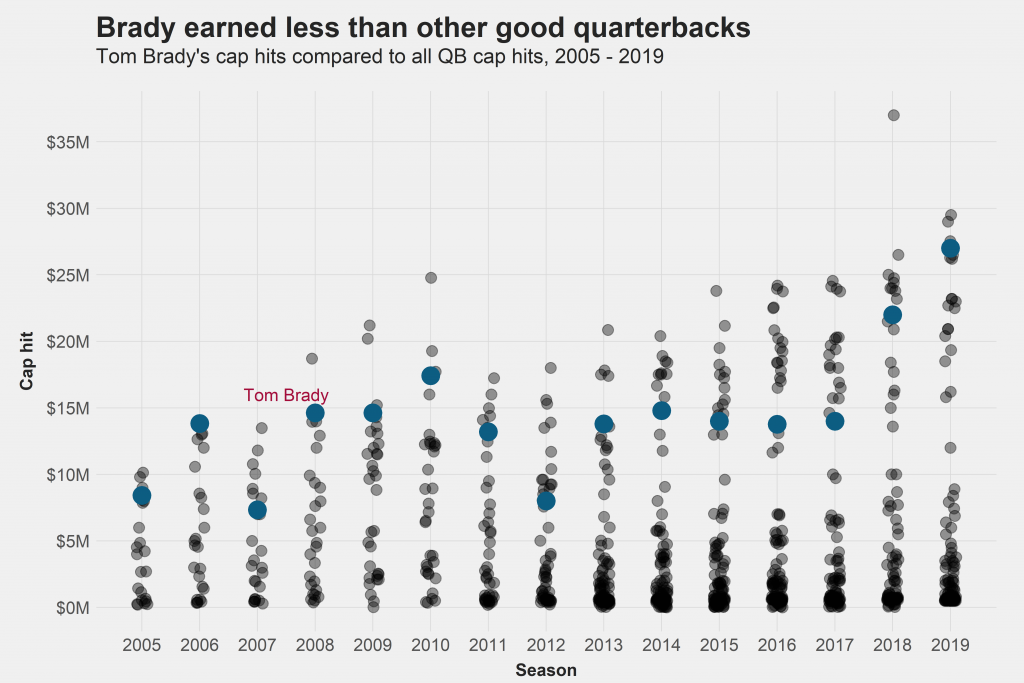
Notably, these averages include the 2008 season when he generated zero wins above replacement due to his knee injury while counting $14.6M against the cap, which, at the time, was the second-highest cap hit of the league behind only Peyton Manning.
To compare cap hits over time, we compute them as a percentage of the yearly salary cap. The year 2010 will be removed from our computations, as this was the year the NFL had no salary cap.
The hardest part of coming up with the win total that Brady added by signing lower contracts than his play justified is to estimate the cost of a win measured in percentage of the salary cap. For this, we can use the work of Kevin Cole, whose results are summarized in the following table.
| Contract Type | Cap % spent | WAR produced | Win cost (cap %) | Win cost (2019 $) |
| UDFA | 0.0% | 1.57 | 0.3% | $0.6 |
| ERFA | 0.2% | 1.29 | 5.1% | $9.5 |
| Drafted | 9.7% | 38.53 | 8.0% | $15.1 |
| Extension | 18.0% | 33.50 | 17.2% | $32.4 |
| RFA | 1.5% | 3.48 | 13.5% | $25.5 |
| SFA | 1.5% | 2.72 | 17.7% | $33.2 |
| Other | 2.6% | 3.03 | 27.1% | $50.9 |
| Franchise | 2.8% | 3.07 | 29.5% | $55.5 |
| Transition | 0.2% | 0.26 | 24.4% | $46.0 |
| UFA | 23.3% | 25.65 | 29.1% | $54.8 |
Obviously, the Patriots used the cap space they saved with Brady’s contracts for players not playing quarterback, so we consider the win cost when excluding quarterbacks. Brady’s contract is also independent of the Patriots’ draft picks, so we have to exclude the contract type “drafted” from our computations, as Brady taking a discount did not allow the Patriots to sign more players under rookie contracts.
Accounting for these factors is crucial because they increase the cost of one win significantly. We then proceed to compute the weighted average of the win-cost numbers from the table above (with the weighting equal to the percentage of cap spent for the respective contract type) and obtain an average win cost of 23.9% of the cap.
From here on, our methodology is a simple rule of three: For each season, we compute the percentage of the cap of Brady’s cap hit, compare it to various benchmarks and apply our estimated win cost to translate the difference into wins.
Brady’s play has been worth much more than his financial sacrifices
Tom Brady signed his first veteran contract after his first Super Bowl win in the 2002 offseason, but even though he had just orchestrated a game-winning drive to win the title, it was by no means obvious that he would eventually become a first-ballot Hall of Famer. This is why we started our computations in 2005 when he signed his second extension with the Patriots after winning his third Lombardi trophy. We start by comparing Brady’s cap hits to the largest cap hit, the fifth-largest cap hit and the average cap hit of the top five cap hits of each season.
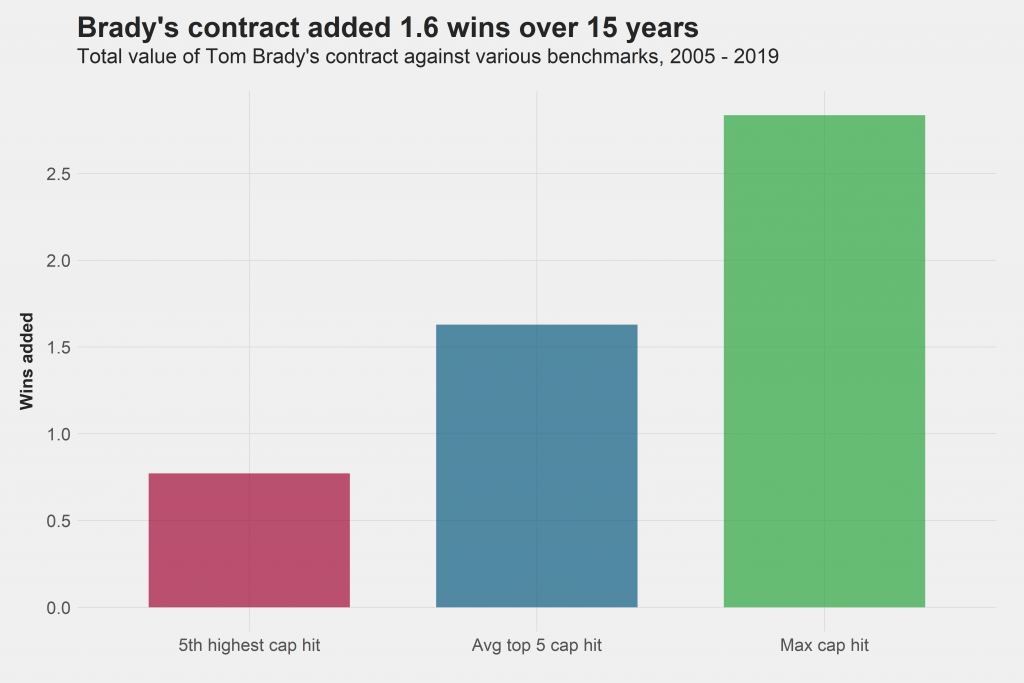
Over 15 years, Brady added a total of 1.6 wins compared to signing contracts that would have made him a top five-paid quarterback throughout his career. When comparing to the highest-paid player in each season, he added 2.8 wins.
We can also visualize how the 1.6 wins were made up over time against the average top-five cap hit.
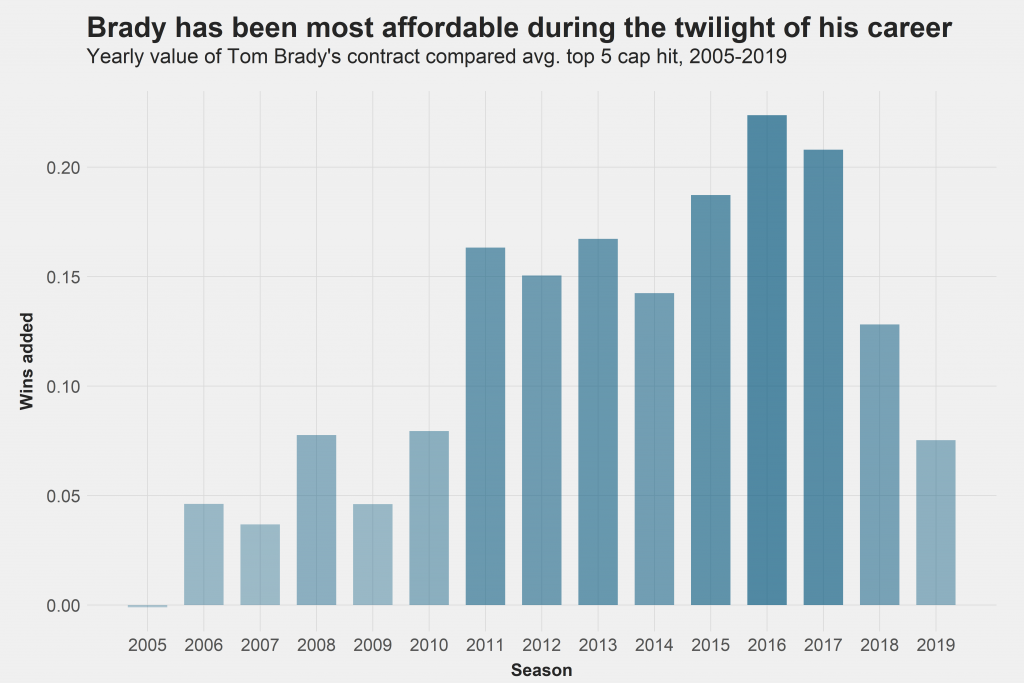
Because teams can shift cap space to other years via contract structures and rollover cap, this chart does not show the wins added in each season, but rather the average of the year itself and the two adjacent years. Through every three year-stretch of his career since 2005, Brady earned less than the average top-five cap hit, and he was particularly generous during the 2010s when his contract was worth up to a fifth of a win in one season against the said benchmark. This coincides with the 2019 PFF WAR value of Randall Cobb, a solid second or very good third wide receiver.
Due to the nature of the quarterback market, it is impossible for a quarterback to have the league's highest cap hit in any single year since every good quarterback usually sets a new standard when signing a contract. Even the average top-five cap hit seems to be a stretch, as there are usually more than five decent-to-good quarterbacks signing new contracts between two contracts of one given quarterback.
Subsequently, it makes sense to also compare Brady’s contracts to the benchmarks set by other quarterbacks. For that matter, we consider all non-rookie QB contracts and compute the average percentage of the cap that those contracts accounted for. We compare the percentage to Brady’s cap hit in each season, translate the difference to wins and add them up from 2005 through 2019. Following our thoughts above, we expect these numbers to be lower than in the chart above, and this is precisely what we find.
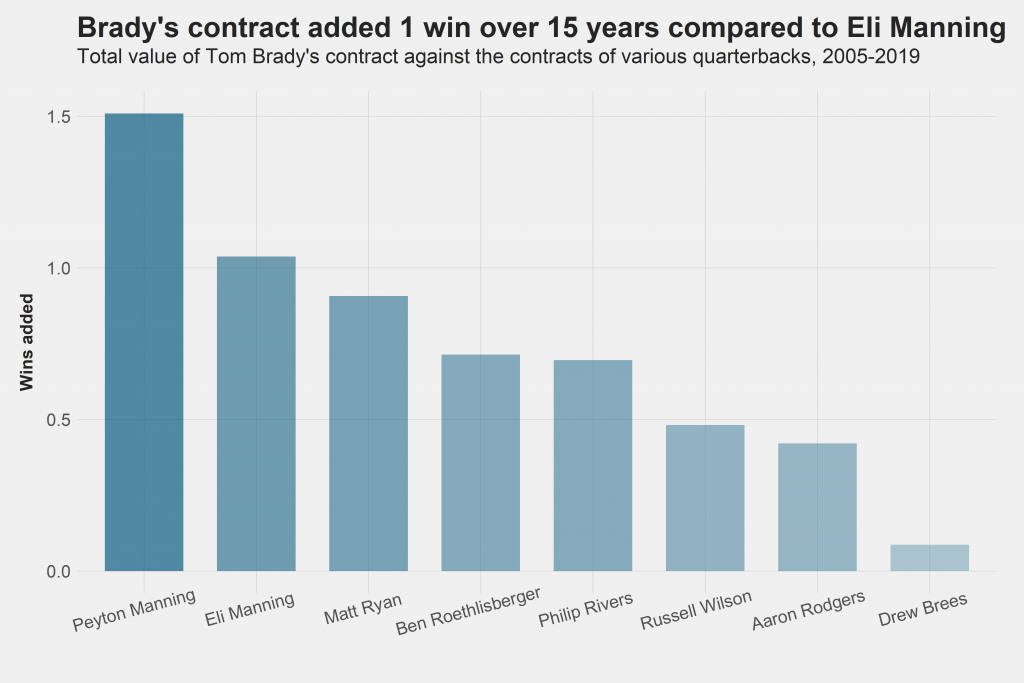
The chart should be interpreted as follows: If Tom Brady had signed contracts with the same cap hits as Eli Manning did throughout his career (measured in percentage of the salary cap), the Patriots would have been expected to add roughly one less win through all other players from 2005 through 2019. As we can see, not even Peyton Manning reached the average top-five cap hit benchmark throughout his career.
Given that Brady’s play on the field was worth a total of 45 wins above replacement since 2006, this is a fairly low number. One win over 15 years is roughly 0.07 wins per season, which equals the PFF WAR of New York Giants rookie Dexter Lawrence in 2019. Lawrence graded out as the 15th-best qualifying interior defensive lineman, with his grade against the run being better than against the pass. Hence, if we want to translate Brady’s willingness to take a discount into a player, we can think of a good but not great interior run stopper. This won’t make a contender out of a mediocre team, but we doubt anyone would say no to getting such a player for free.
Patriots added a lot more value than Brady’s contract explains
The following chart shows the wins each NFL team added since 2006 through quarterbacks and all other positions, as measured per PFF WAR.
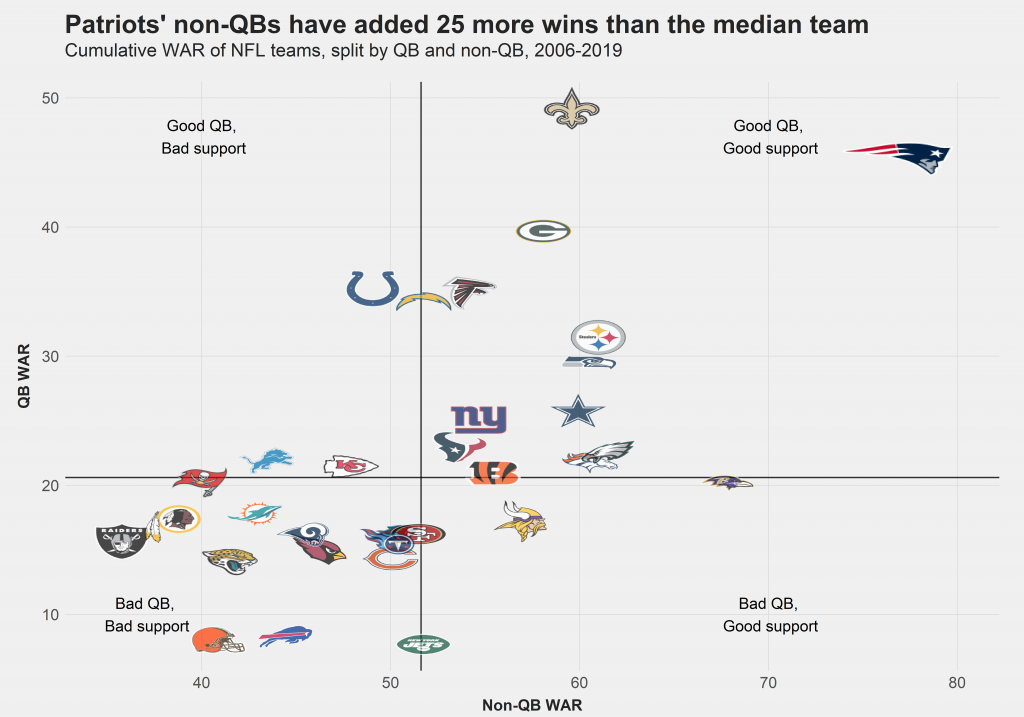
The reason for the Patriots dynasty becomes apparent: Not only has Tom Brady’s play been worth more than the play of the quarterbacks of every team other than New Orleans with Drew Brees, but the Patriots by far added the most value through players at other positions. They’ve added 77 wins over 14 years, nine more than the second-placed Ravens and 25 more than the median team. According to our previous results, this difference is much higher than Brady’s contract can account for, suggesting that Tom Brady’s on-field performance and Bill Belichick’s ability to identify and coach up players who fit perfectly in his system were the main reasons for New England’s dynasty spanning over two decades. Their quarterback taking a discount was a minor factor in comparison.
Blind spots
Our analysis features at least two possible blind spots, both of which shouldn’t affect the overall takeaway.
Before 2010 (the strike year), the current rookie wage scale didn’t exist, and rookies could earn more money. Subsequently, the win cost of all non-rookie contracts decreases. However, even without looking at the data, we can still find a lower bound for the win cost when investing in non-quarterbacks. Since replacement level is defined to be 3-13, the average team gains five wins above replacement and can use 100% of the cap to achieve this. This yields a win cost of 20%, and since quarterbacks are underpaid relative to their WAR values, the actual lower bound for non-quarterbacks will be slightly higher than 20%. If we changed our computations using a win cost of 20% of the cap, the difference between Brady’s contract and the average top-five cap hit (which almost equals Peyton Manning’s cap hits) would be worth 1.9 wins instead of 1.6 wins, and that is certainly no reason to alter our conclusion. We also point out the 1.6 wins are made up of 0.2 wins from 2005 to 2009 and 1.4 wins from 2011 to 2019. Hence, the larger part of our calculation would be entirely unaffected.
Another blind spot stems from the aforementioned definition of replacement level. If we hypothetically defined it to be 2-14, an average team would gain six instead of five wins above replacement. This would increase all our results by 20%, again turning 1.6 wins into 1.9 wins. While the definition of replacement level is somewhat arbitrary, we also note it’s not really crucial, as reducing the threshold for replacement level would not only increase the wins added by Brady’s contract, but it would also increase the WAR value of every NFL player by the same factor, thus not changing the proportions we’ve found in the previous section. Instead of adding 25 more wins than the median team, the Patriots’ players would have added 30 more wins.
The value of Brady taking discounts has been real and undeniable for a long time. Thanks to the research done here at PFF, it is now also measurable and turns out to be a minor contribution to the dynasty that has defined the start of the 21st century.
