Assigning value to players in the NFL is one of the most enticing problems in all of sports. While there are many great approaches to understand player ability and value out there, a single number across all positions and facets has remained elusive. Ron Yurko and his colleagues used publicly available play-by-play data to estimate wins above replacement values for quarterbacks, receivers and running backs. Estimates for punters have also been computed by (now Baltimore Ravens) analyst Sean Clement. ESPN Stats and Info’s Paul Sabin and his colleagues have leveraged the adjusted +/- approach and applied it to college football this season, deriving another measure for how good a player is using play-by-play participation data and expected points added.
PFF offers hope in the area of player valuation due to its unique player grades, which offer play-by-play participation and performance data for each and every player on the football field, from the quarterback to the gunner on the punt team. To take this information from how well a player performed on the field to how valuable this performance was, a player valuation model needs to incorporate a) how well the player performed b) what the player did and how important that task is to winning football games and c) how often did the player do the various things he did. Our PFF WAR model does just this. Below, we give an overview of the methodology and give some examples of what the metric can tell us.
Our ability to study football at this depth, from the data collection phase to the machine learning, are all made possible by the capabilities provided to us by Amazon Web Services.
Methodology
Broadly, the PFF WAR model does these things, in order:
- Determine how good a given player was during a period of time (generally a season) using PFF grades;
- Map a player’s production to a “wins” value for his team using the relative importance of each facet of play;
- Simulate a team’s expected performance with a player of interest and with an average player participating identically in his place. Take the difference in expected wins (e.g., Wins Above Average);
- Determine the average player with a given participation profile’s wins above replacement player, assuming a team of replacement-level players is a 3-13 team;
- Add the terms in the last two calculations to get that player’s WAR.
The first step uses raw PFF grades, normalized by season and by facet (and some facets by position played). The second step requires some care both from a data and modeling standpoint. First — and this is a change from the original versions of the model — we don’t actually use the number of wins each team achieved in our training of the model to map production to wins. Taking inspiration from Justis Mosqueda, we count all games decided by eight or fewer points as half of a win (regardless of which team actually won), which significantly increases the year-to-year stability in team strength.
Modeling how individual player strength maps to team strength is done using the Massey matrix framework. The strength vector for each team is computed using a machine learning model to weigh each facet by how they map to the adjusted wins above. Each season is then simulated with and without the player in the lineup for that team, and the mean difference in projected wins is taken as the player’s WAA.
The third step and fourth steps come together via an addition of 0 wins, through the formula:
WAR = Player Wins – Replacement-Level Player Wins
= Player Wins – Average Player Wins +
Average Player Wins – Replacement-Level Player Wins.
With this metric, we can address some compelling questions:
Positional value
It’s obvious to anyone who watches football that quarterback is the most important position, so we’re not breaking ground when we say that PFF WAR confirms this. It is surprising (although if you’ve followed along, maybe less so) that the further away from the ball a player plays, the more valuable they appear to be. After quarterbacks, wide receivers, defensive backs and tight ends have the highest average WAR.
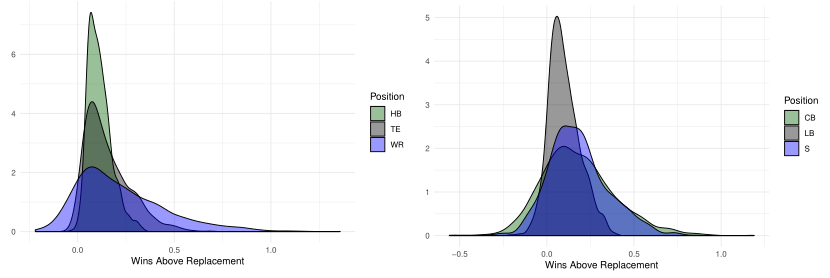
Figure: WAR for offensive and defensive skill position players. Minimum 250-snap threshold.
The highest player-to-player variability in WAR is generated by defensive linemen, due likely to the existence of the J.J. Watts and Aaron Donalds of the world. Linemen (both offensive and defensive) WAR is suppressed significantly by offsides/illegal procedure penalties. For example, a false start/offsides penalty on first down and 10 yards to go is worth the better part of one expected point. A holding penalty on an offensive lineman or a roughing the passer penalty are worth even more and represent value that is very difficult to accumulate during the other snaps in each, each of which consists of a one-on-one battle with little direct effect on the outcome of a play and for which each player wins some and loses some.
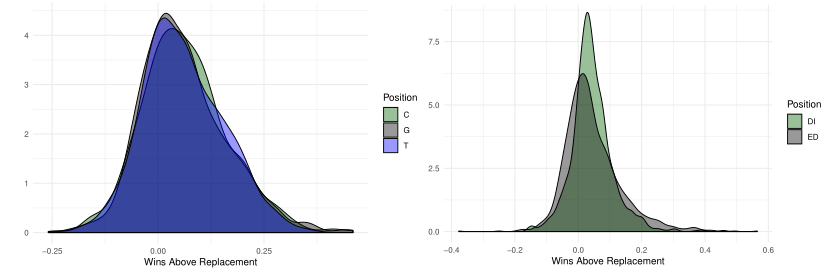
Figure: WAR for offensive and defensive linemen. Minimum 250-snap threshold.
(Earlier versions of this metric were less delicate with respect to how performing in different facets depended on position, causing us to overvalue positions like linebacker and (even) running back. We believe this iteration has corrected this. )
Stability
The Spearman correlation coefficient with respect to WAR is 0.74 for all players with more than 250 snaps in the first of the two seasons, across all positions. Pro Football Reference’s Approximate Value (AV, the industry’s best single number to capture player performance to date) is at 0.64 since 1960 and 0.65 during the PFF era (2006-present).
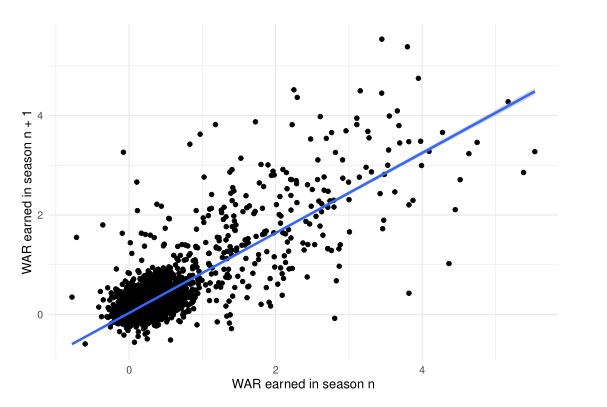
Figure: Year-to-year variability in PFF WAR for players with 250 or more snaps in consecutive seasons.
When it comes to quarterbacks specifically, PFF WAR correlates at a season-to-season rate of 0.62, which is an improvement over passer rating (0.37), QBR (0.43) and raw EPA generated per pass play (0.45).
The positions for which WAR is correlated most strongly season-to-season are tight ends and interior defensive players, while the least stable are safeties and cornerbacks, also in congruence with our study on pass-rush versus coverage.
Some examples
During the course of the PFF era, here are the following NFL MVPs, and their WAR values:
| Season | Player | Position | Team | WAR |
| 2006 | LaDainian Tomlinson | RB | SD | 0.34 |
| 2007 | Tom Brady | QB | NE | 4.50 |
| 2008 | Peyton Manning | QB | IND | 3.66 |
| 2009 | Peyton Manning | QB | IND | 4.10 |
| 2010 | Tom Brady | QB | NE | 2.61 |
| 2011 | Aaron Rodgers | QB | GB | 4.75 |
| 2012 | Adrian Peterson | RB | MIN | 0.30 |
| 2013 | Peyton Manning | QB | DEN | 4.45 |
| 2014 | Aaron Rodgers | QB | GB | 3.87 |
| 2015 | Cam Newton | QB | CAR | 2.88 |
| 2016 | Matt Ryan | QB | ATL | 3.52 |
| 2017 | Tom Brady | QB | NE | 5.38 |
| 2018 | Patrick Mahomes | QB | KC | 4.39 |
As we’ve said before, a running back should never be the MVP, as the ones that did during the PFF era were worth less than a tenth of the value the quarterbacks with that distinction did. The average WAR value for a running back with a significant number of snaps in a season is 0.1, so while LaDainian Tomlinson and Adrian Peterson were worth roughly three times that, a quarterback generating a similar markup on his competition is an order of magnitude more important, and should really be the only place one looks to determine MVP.
The highest WAR value in the PFF era is not actually a player who earned an NFL MVP award (Drew Brees, 5.54 in 2011). In fact, Brees led the NFL in WAR during both of Aaron Rodgers’ MVP seasons. Rodgers (2010) and Matt Ryan (2012) have both led the league in WAR and won an MVP in separate seasons. Tomlinson’s 2006 WAR number is the highest for a full season we’ve seen for a running back, while the highest non-quarterback WAR we’ve ever seen was earned by Antonio Brown in 2015 (1.36). The highest WAR ever earned by a defensive player was generated by Darrell Revis in his famous “Revis Island” season of 2009 (1.19).
Who is the MVP this year?
So, everyone wants to know: who is the most valuable player this year? Despite Lamar Jackson’s effect on the Ravens (which is sizeable), the most valuable player in the NFL this season has been Seattle quarterback Russell Wilson.
In 908 snaps this season, the eighth-year pro has earned 3.1 wins above replacement, almost a full win more than the next-highest player in Dak Prescott (2.2). What’s most impressive about Wilson is that he’s accounted for over half of his team’s total WAR. Seattle is fifth among all NFL teams in cumulative player WAR through the first 14 weeks of the season, but only 19th if you don’t count quarterbacks.
The other MVP frontrunner, Jackson, is sixth in WAR (1.7 wins) through 14 weeks, as his Ravens are second in the NFL in WAR generated by non-quarterbacks and first in WAR generated by offensive linemen. Thus our grading system, and the PFF WAR model built off it, appears to be capturing the fact that Wilson is doing a great deal of the work for the Seahawks, while the Ravens are more of a team effort.
What to expect moving forward
For now, PFF WAR will be available as a part of our premium content articles and used much more liberally than in the past. A few use cases that you’ll see in the coming weeks and months:
- How lucky have teams been?
We wrote about this a while back, but adding up the PFF WAR that each team has generated with its players and comparing it to that actually earned on the scoreboard, can help us see how “lucky” a team has been, or how well a coaching staff has gotten more or less the sum of the team’s parts.
During the time Andy Reid has been Kansas City’s coach, no team has earned more wins above what would be implied by PFF WAR. To absolutely no one’s surprise, the Browns have more PFF WAR above actual wins during the PFF era.
We’ve found that aggregating the WAR of a team’s players is more predictive of future wins than Pythagorean win totals are, and will most certainly be a part of our content relating to sports betting in the future.
- What are players worth?
Having an estimate for how valuable a player is in terms of the currency in which we care (wins) has a lot of implications in the space of player acquisition. Kevin Cole has done some work already in this area, but look out for more in the future.
- Evaluating draft currency
The Jimmy Johnson draft trade chart became famous for its role in the Herschel Walker trade, but due to changes in the game and our understanding of it (thank you, Cade Massey and Richard Thaler), we know that teams do not value draft capital optimally. Using PFF WAR, we can study trades like the one that netted the Jets the Sam Darnold pick. Such studies lead us to interesting conclusions. For example, the value of drafting a quarterback at the beginning of the draft is more than three times that of a non-quarterback, meaning both teams can win a trade like the Jets-Colts one (which was also alluded to by the NFL’s own Michael Lopez).
- A college version
We are in the early stages of testing an NCAA version of PFF WAR. Hint: Joe Burrow was far and away college football’s most valuable player in 2019, followed by Justin Fields, Jalen Hurts and Trevor Lawrence, in that order.
