
A few weeks ago, I released the methodology and top-12 all-time list for PFF Plus/Minus, a new way to value wide receivers, and I followed that up by the equivalent analyses for cornerbacks and edge defenders. PFF Plus/Minus is built on historical on- and off-field splits for players who are grouped by type in order to build larger, less-noisy samples of data that boost the usefulness of the information gathered. The full methodology is included in the first link above, and it's worth your review to get the most out of this analysis.
The problem with plus/minus data on/off splits is that it’s difficult to pinpoint the effect of one player on the field, especially with small samples. The solution for reducing the noise in a single plus/minus split is growing the sample. While we can’t grow one player’s sample, we can find that player’s closest counterparts and add their numbers to the sample. If one player provides a few hundred snaps on and off the field a season, finding 10 similar players will provide a few thousand. The higher you can reasonably build the sample, the more you can minimize noise and boost signal.
In this analysis, I walk through how to build similar groups of offensive tackles by statistical similarity and then use the larger sample of the group to calculate more meaningful estimates for the value of its constituents. This lays the foundation to further replicate the process, producing estimates for the value of each offensive tackle.
Player Clustering
For this analysis, I'm using every season since 2006, and I'm only looking at offensive tackles who played at least 200 pass-blocking snaps throughout the single seasons over that span.
For each tackle season, I calculated a number of efficiency and volume statistics, and settled upon six primary features to better differentiate tackle types: pass-block snaps per game, sacks allowed per snap, quarterback hits allowed per snap, quarterback hurries allowed per snap, quarterback pressures allowed per snap and PFF pass-block grade per snap. I translated these six features, and a few other minor features, into principal components to minimize multicollinearity and make for easier visualization. The technique I used to form groups of similar tackle seasons is called k-means clustering. With this clustering technique, you choose the number of clusters, or groups, to form.
Here, I’ll walk through an example of the clustering process. In this example, I chose to divide the 1,000-plus tackle seasons into 12 clusters.
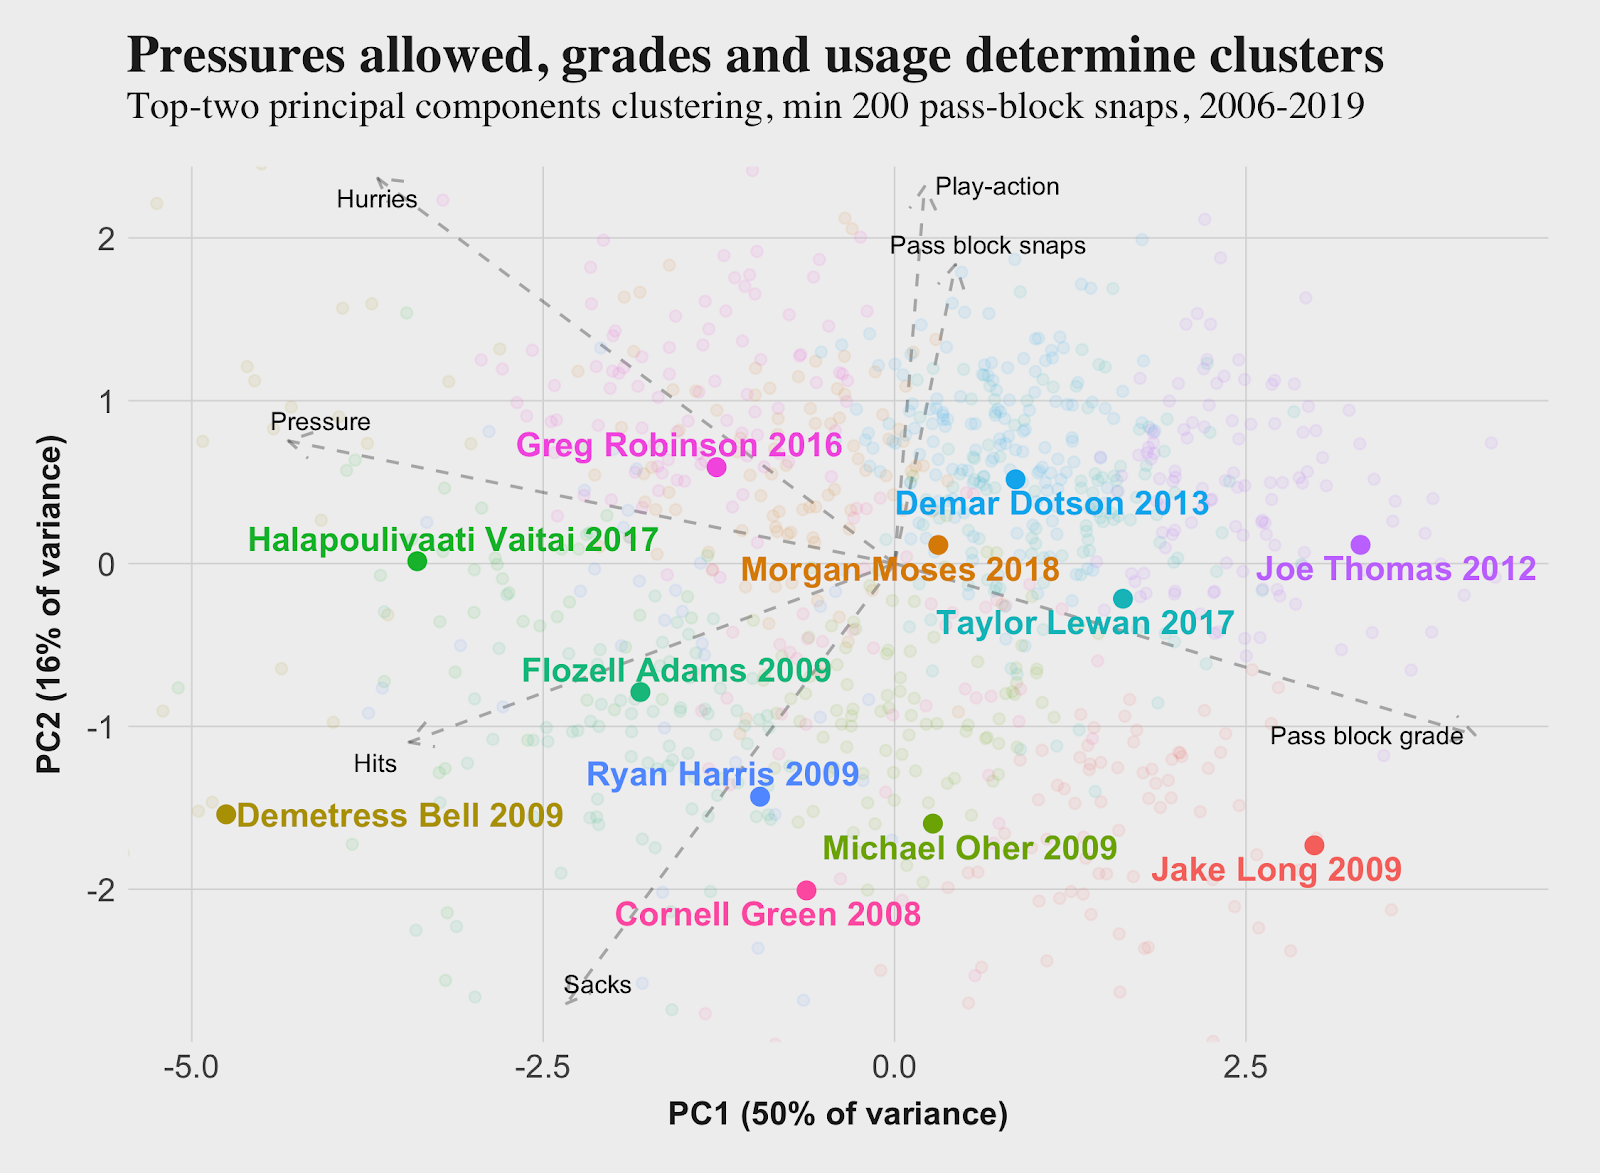
Every cluster is represented by a different color, and I highlighted one player from each who had the majority of his seasons placed into that cluster. For the remainder of this analysis, I will refer to the 12 clusters by the last name of the representative player, rather than by the cluster number.
The dashed arrows on the plot show the directionality of the different features. Tackle seasons with a higher percentage of pass-block snaps are higher, those who most often allowed more sacks, hits, hurries and pressures are generally to the left and those who had better pass-block grades are to the right. It’s within these 12 clusters that the individual numbers for each offensive tackle plus/minus are aggregated to determine the overall cluster plus/minuses.
A better view of how the players in each cluster differ can be seen using the spider charts below. First, we’ll look at the average numbers of the Joe Thomas cluster.
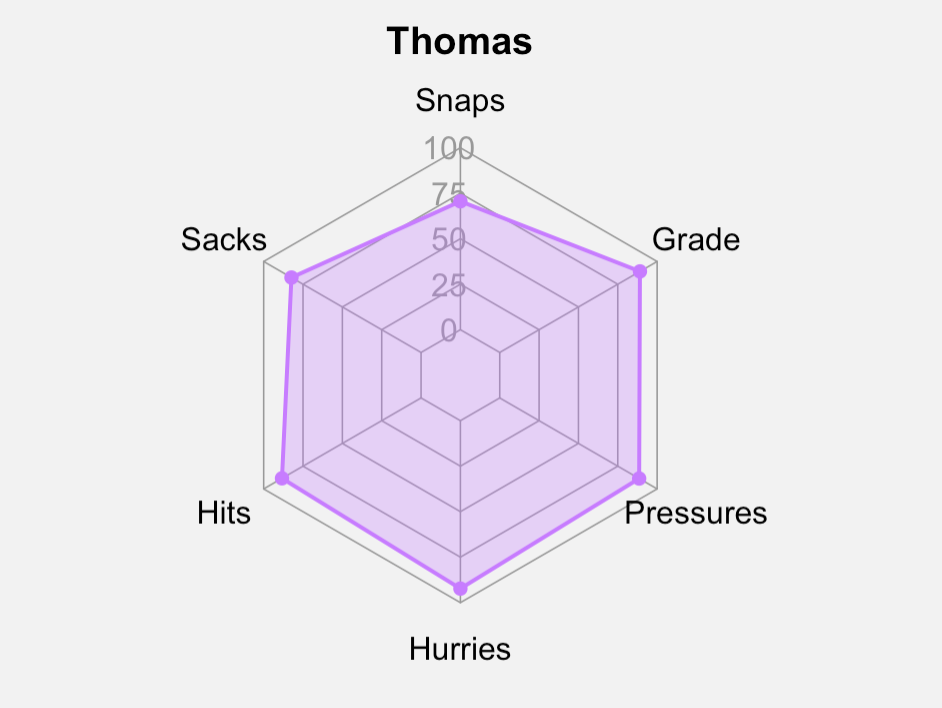
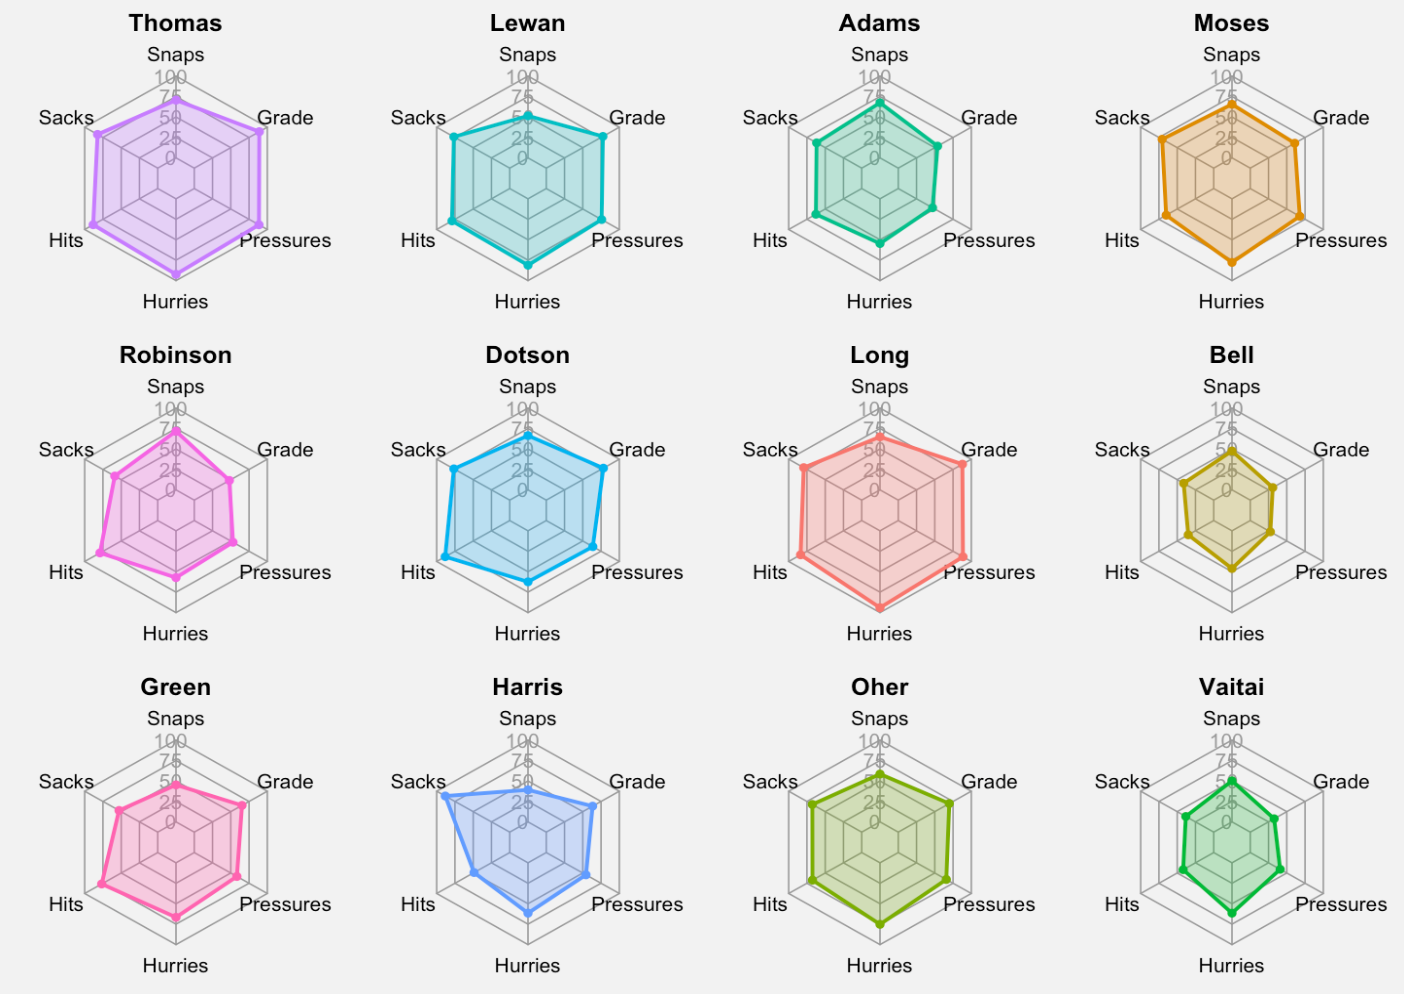
Thomas is strong across the board. Now, here are all 12 clusters for comparison, from the expansive Thomas cluster to one of the most limited, which is named after Halapoulivaati Vaitai.
With the clusters sorted, we then calculate plus/minus splits per play for each cluster by adding together total EPA for their offenses when on the field, dividing that by total pass-block snaps on the field and then subtracting the corresponding off-the-field figure from it.
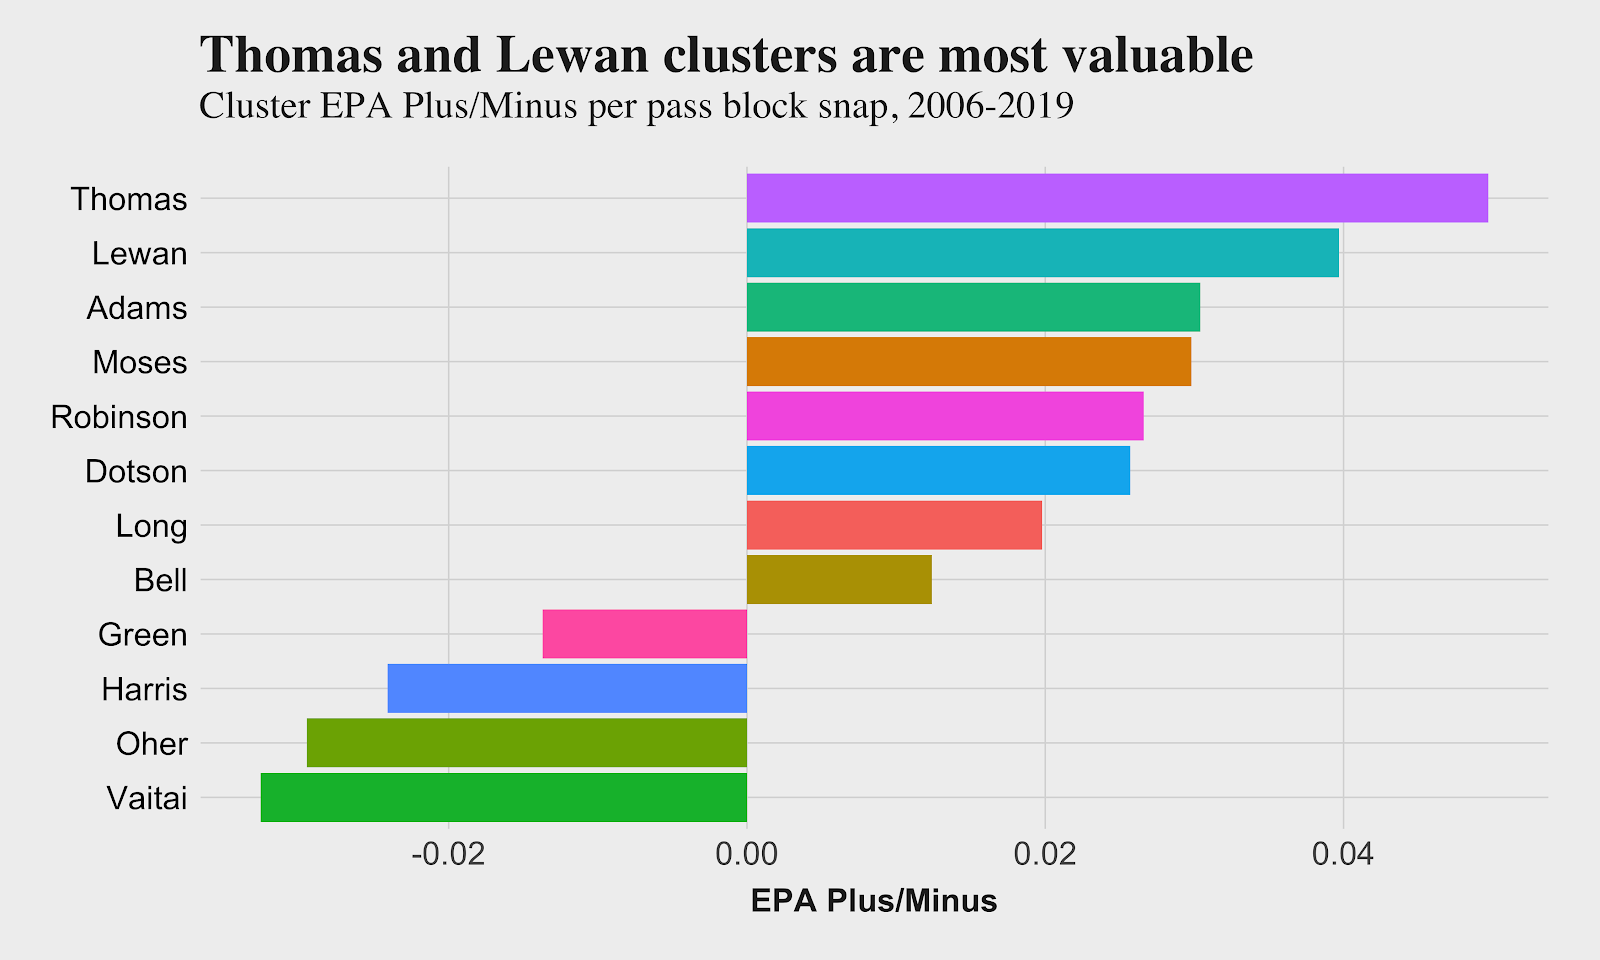
Remember that these results are only for a single clustering, which we will expand on below. At least at the top, the numbers make sense, with the Joe Thomas cluster having the highest average Plus/Minus.
