
A few weeks ago, I released the methodology and the top-12 all-time list for PFF Plus/Minus, a new way to value wide receivers. PFF Plus/Minus is built on historical on- and off-field splits for receivers who are grouped by type in order to build larger, less-noisy samples of data that boost the usefulness of the information gathered. The full methodology is included in the link above, and it's worth your review to get the most out of this analysis.
One of the reasons that I chose wide receivers as the subject for that study was a desire to limit the influence of selection bias, which, in this case, meant situational usage would make on/off the field splits too dissimilar to draw reasonable conclusions from. Top receivers play the vast majority of passing downs, and their influence in the running game is as minimal as any offensive position. The equivalent to wide receivers on the defensive side of the ball are cornerbacks, the subject of this analysis.
The problem with plus/minus data and on/off splits is that it's difficult to pinpoint the effect of one player on the field, especially with small samples. The solution for reducing the noise in a single plus/minus split is growing the sample. While we can't grow one player's sample, we can find that player's closest counterparts and add their numbers to the sample. If one player provides a few hundred snaps on and off the field in a season, finding 10 similar players will provide a few thousand. The higher you can reasonably build the sample, the more you can minimize noise and boost signal.
In this analysis, I walk through how to build similar groups of cornerbacks by statistical similarity and then use the larger sample of the group to calculate more meaningful estimates for the value of its constituents. This lays the foundation to replicate the process further, producing estimates for the value of each cornerback.
Player Clustering
For this analysis, I'm using every season since 2006, and I'm only looking at cornerbacks who played at least 200 coverage snaps throughout the single seasons over that span.
For each cornerback season, I calculated a number of efficiency and volume statistics, and I settled upon five primary features in order to identify cornerback types: coverage snaps per game, percentage of coverage snaps in the slot (slot assignment), times targeted per snap, expected points added (EPA) surrendered per snap and PFF coverage grade per snap. I translated these five features, and many other minor features, into principal components to minimize multicollinearity and make for easier visualization. The technique I used to form groups of similar cornerback seasons is called k-means clustering. With this clustering technique, you choose the number of clusters, or groups, to form.
Here, I'll walk through an example of the clustering process. In this example, I chose to divide the roughly 1,400 cornerback seasons into 12 clusters.
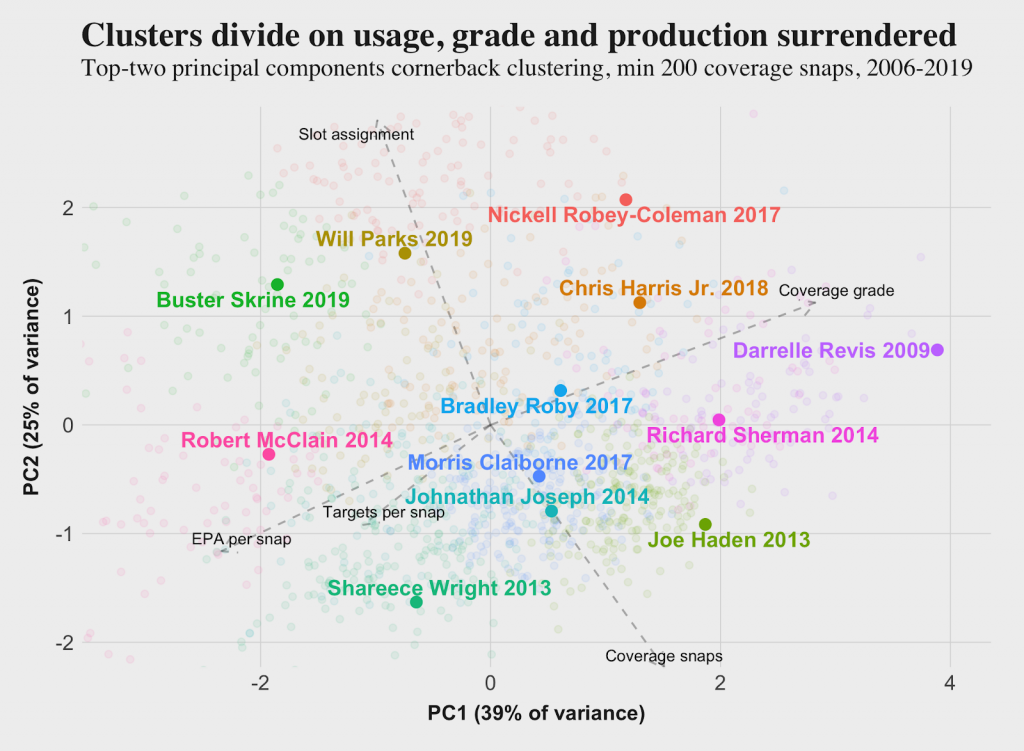
Every cluster is represented by a different color, and I highlighted one player from each who had multiple seasons placed within that cluster. For the remainder of this analysis, I will refer to the 12 clusters by the last name of the representative player, rather than by the cluster number.
The dashed arrows pointing to the left of the plot show the directionality of the different features. Cornerback seasons with a higher percentage of coverage snaps in the slot are higher, those who are targeted more often and surrender more EPA to the lower left, and the ones with better PFF coverage grades to the upper right. It's within these 12 clusters that the individual numbers for each cornerback plus/minus are aggregated to determine the overall cluster plus/minuses.
A better view of how the players in each cluster differ can be seen using the spider charts below. First, we'll look at the average numbers of the Darrelle Revis cluster. Starting at the top, the features are in counter-clockwise rotation: coverage snaps per game (snaps), coverage snaps assigned outside, times targeted per coverage snap, inverse of EPA surrendered and PFF coverage grade. Rather than use slot and EPA surrendered, these features have been inversed to highlight more time in coverage outside and surrendering fewer EPA to the opponent.
