Now that the NFL Combine is over, it’s time to step back from the hype and assess the results. Luckily, we have an objective way to do this using the Combine models I developed last week for offensive and defensive players, which translate performances in each metric to movement in players’ draft positions and values — the latter based on PFF’s proprietary wins above replacement (WAR).
In this article, I’ll project every defensive player — after doing the same for offensive players yesterday — who participated in the 2020 NFL Combine in terms of percentile for draft position and WAR based solely on their Combine metrics. This will reveal who is most likely to jump in draft and on-field value. For most drills, strong performances have been more strongly linked to rising draft position than WAR, meaning NFL teams generally overvalue what we learn from the Combine drills.
Judging by the reactions to stunning Combine performance on social media, we’re likely also getting too caught up in how quickly players run in their underwear than how well they play on the field. We’ve already documented the Combine risers and fallers at different position groups; this analysis will do the same, but with a quantitative spin.
Methodology
This analysis is built on strong work from former Harvard Sports Analysis Collective member Bill Lotter in his series detailing why the NFL Combine actually matters. Lotter used ridge regression to estimate the coefficients for the different Combine results and measure their importance in explaining prospects’ draft positions and value — the latter estimated using Pro Football Reference’s approximate value (AV) over players’ first three seasons. My analysis is similar, but with PFF’s more sophisticated WAR metric as the target variable, not AV.
The plots below give the coefficients, derived from historical data from 2006-2017, for each measurement or drill denominated by standard deviation within the position group. The draft positions and WAR for position groups are translated to percentile, giving both the same scale.
Each bar below represents the amount of percentile movement you’d expect for a player with one standard deviation above or below the positional average. For timed drills, a negative coefficient is better. Lower times in the 40, three-cone and short shuttle generally translate to better draft positions and higher WAR over the first three seasons of a player’s career.
Below each plot, I have applied the regression models for draft position and WAR to all of the 2020 NFL Combine participants who recorded at least height, weight and ran the 40-yard dash. I used the recorded metrics and inputted those missing (discounted by half a standard deviation for skipping the drill) and produced a “Draft Score” and “WAR Score” for each player.
These scores are the projected percentiles (0-100) for draft position and WAR amongst the position group. The table is sorted first by PFF’s Big Board rankings, then by WAR Score. The last column indicates the difference between WAR and Draft Scores, with negative differentials signaling players potentially overvalued after strong Combine performances, and positive differentials pointing to the opposite.
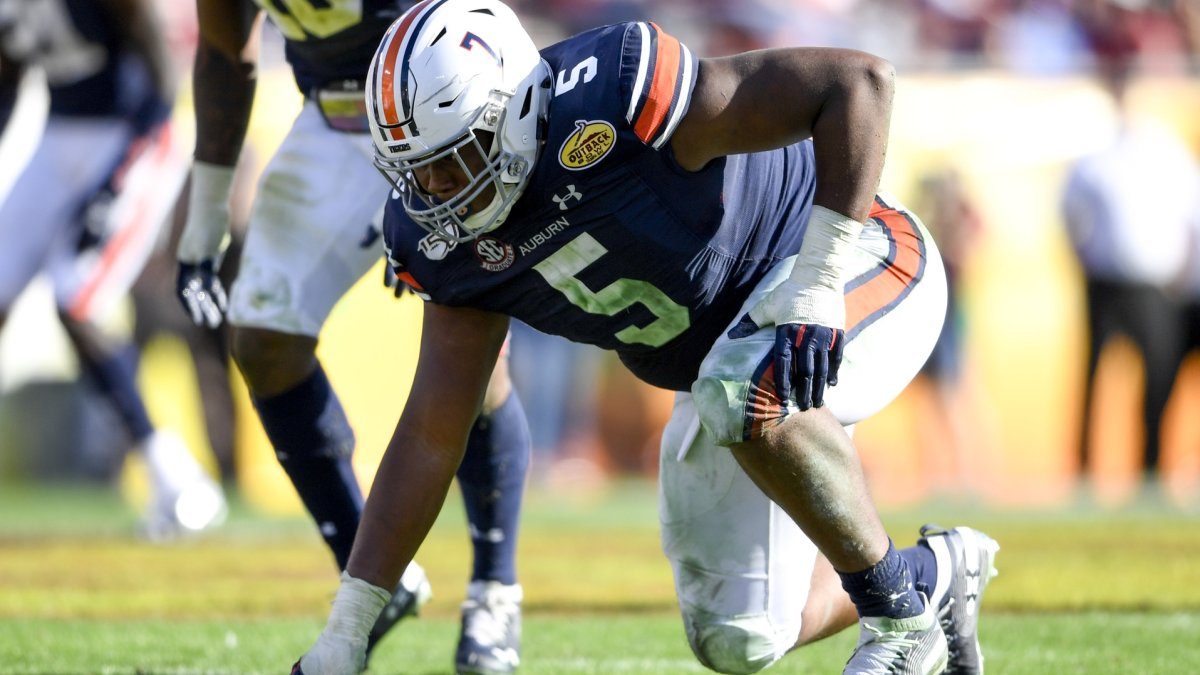
Interior Defenders
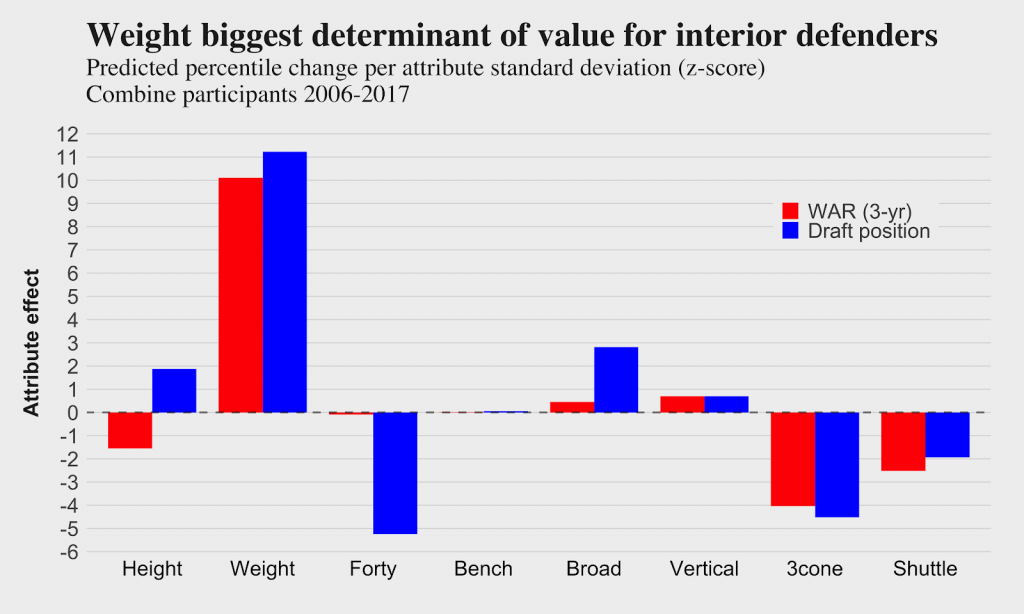
Despite the fact that Aaron Donald was one of the lightest (285 pounds) and most successful players at the position, bigger is generally better for interior defenders. Donald is viewed as more of an outlier — many of the lighter interior defenders produce negative WAR.
In addition to weight, the agility drills (three-cone and short shuttle) show roughly as much significance for WAR as draft position. The 40-yard dash is the second most significant determinant for draft position, but it barely registers for WAR.
| PFF Board | Player | College | Height | Weight | Forty | Bench | Broad | Vertical | 3cone | Shuttle | Draft Score | WAR Score | Diff |
| 10 | Derrick Brown | Auburn | 76 | 326 | 5.16 | 28 | 108 | 27.0 | 8.22 | 4.79 | 50.7 | 53.0 | 2.3 |
| 11 | Javon Kinlaw | South Carolina | 77 | 324 | NA | NA | NA | NA | NA | NA | NA | NA | NA |
| 20 | Jordan Elliott | Missouri | 75 | 302 | 5.02 | 24 | NA | 27.5 | NA | 4.73 | 45.6 | 46.0 | 0.4 |
| 39 | Ross Blacklock | TCU | 75 | 290 | 4.90 | NA | 107 | 29.0 | 7.77 | 4.67 | 45.4 | 40.6 | -4.8 |
| 53 | Justin Madubuike | Texas A&M | 74 | 293 | 4.83 | 31 | NA | NA | 7.37 | NA | 51.7 | 49.9 | -1.9 |
| 68 | Neville Gallimore | Oklahoma | 74 | 304 | 4.79 | 23 | NA | NA | 7.97 | 5.01 | 48.1 | 42.9 | -5.3 |
| 97 | DaVon Hamilton | Ohio State | 75 | 320 | 5.14 | 33 | 102 | 29.5 | 7.72 | NA | 50.5 | 55.0 | 4.5 |
| 99 | Raekwon Davis | Alabama | 78 | 311 | 5.12 | 24 | 111 | 28.0 | 7.95 | 4.86 | 50.7 | 46.6 | -4.1 |
| 122 | Leki Fotu | Utah | 77 | 330 | 5.15 | 21 | NA | NA | NA | NA | 53.0 | 54.1 | 1.2 |
| 123 | McTelvin Agim | Arkansas | 74 | 309 | 4.98 | 27 | NA | NA | NA | NA | 48.3 | 50.3 | 1.9 |
| Carlos Davis | Nebraska | 74 | 313 | 4.82 | 27 | NA | NA | NA | 4.52 | 57.5 | 56.5 | -1.1 | |
| Khalil Davis | Nebraska | 73 | 308 | 4.75 | 32 | NA | NA | NA | NA | 55.9 | 54.4 | -1.5 | |
| Darrion Daniels | Nebraska | 75 | 311 | 5.18 | 21 | 109 | 27.0 | 7.75 | 4.93 | 45.8 | 50.6 | 4.8 | |
| Malcolm Roach | Texas | 74 | 297 | 4.84 | 20 | 114 | 30.0 | NA | NA | 52.6 | 50.4 | -2.2 | |
| Robert Windsor | Penn State | 76 | 290 | 4.90 | 21 | 111 | 28.5 | 7.47 | 4.44 | 52.3 | 48.1 | -4.2 | |
| Raequan Williams | Michigan State | 76 | 308 | 5.04 | 17 | 101 | 25.5 | 7.72 | 4.78 | 47.4 | 47.2 | -0.2 | |
| Rashard Lawrence II | LSU | 74 | 308 | 5.07 | 22 | NA | NA | 8.03 | NA | 42.2 | 45.5 | 3.2 | |
| Josiah Coatney | Ole Miss | 75 | 308 | 5.21 | 22 | 99 | 27.0 | 8.07 | 4.82 | 37.7 | 41.9 | 4.2 | |
| Jason Strowbridge | North Carolina | 76 | 275 | 4.89 | 26 | 113 | 31.0 | 7.45 | 4.37 | 47.8 | 41.4 | -6.4 | |
| Benito Jones | Ole Miss | 73 | 316 | 5.26 | NA | NA | 26.5 | 8.21 | 5.27 | 32.4 | 40.5 | 8.1 | |
| John Penisini | Utah | 73 | 318 | NA | 23 | NA | 25.5 | NA | 4.93 | NA | NA | NA | |
| Broderick Washington | Texas Tech | 74 | 305 | NA | 23 | NA | NA | NA | NA | NA | NA | NA |
Size is king for interior defenders, and 326-pound Derrick Brown — our top-ranked prospect at the position — has plenty of it. His 53.0 WAR score was third in the 2020 class, which should signal to solidify his draft status even considering his slow three-cone time (8.22 seconds). DaVon Hamilton produced the highest WAR Score of ranked prospects, combining size and quickness with a 7.76 three-cone drill at 320 pounds.
Edge Defenders
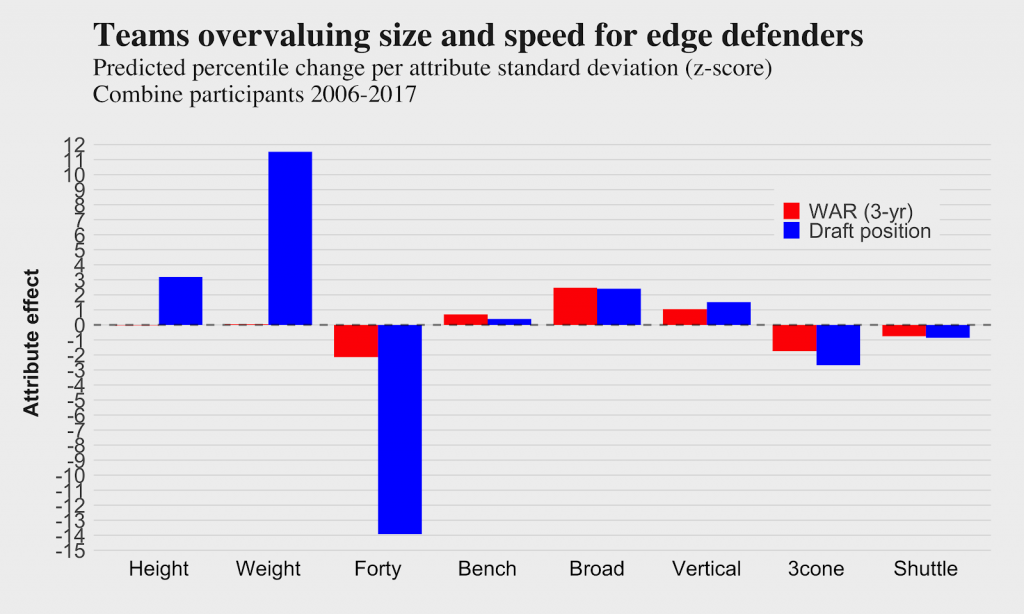
We tend to think of edge defenders as some of the most athletic players in the NFL, and the attribute effects for draft position are relatively large. The bar chart is a bit deceptive in displaying the effects for WAR, as they’re dwarfed by their draft position counterparts. The 40-yard dash, broad jump, vertical jump, three-cone drill and short shuttle all matter for projecting edge defender WAR.
| PFF Board | Player | College | Height | Weight | Forty | Bench | Broad | Vertical | 3cone | Shuttle | Draft Score | WAR Score | Diff |
| 2 | Chase Young | Ohio State | 76 | 264 | NA | NA | NA | NA | NA | NA | NA | NA | NA |
| 12 | A.J. Epenesa | Iowa | 77 | 275 | 5.04 | 17 | 117 | 32.5 | 7.34 | 4.46 | 35.8 | 44.0 | 8.1 |
| 22 | Curtis Weaver | Boise State | 74 | 265 | NA | NA | 116 | 32.5 | 7.00 | 4.27 | NA | NA | NA |
| 23 | Julian Okwara | Notre Dame | 76 | 252 | NA | 27 | NA | NA | NA | NA | NA | NA | NA |
| 32 | Marlon Davidson | Auburn | 75 | 303 | 5.04 | 21 | NA | NA | NA | NA | 45.5 | 46.3 | 0.8 |
| 41 | Zack Baun | Wisconsin | 74 | 238 | 4.65 | 24 | 115 | 32.5 | 7.00 | 4.31 | 44.2 | 50.1 | 5.9 |
| 45 | K'Lavon Chaisson | LSU | 75 | 254 | NA | NA | NA | NA | NA | NA | NA | NA | NA |
| 64 | Darrell Taylor | Tennessee | 75 | 267 | NA | NA | NA | NA | NA | NA | NA | NA | NA |
| 66 | Yetur Gross-Matos | Penn State | 77 | 266 | NA | 20 | 120 | 34.0 | NA | NA | NA | NA | NA |
| 70 | Terrell Lewis | Alabama | 77 | 262 | NA | NA | 124 | 37.0 | NA | NA | NA | NA | NA |
| 71 | Josh Uche | Michigan | 73 | 245 | NA | 18 | NA | NA | NA | NA | NA | NA | NA |
| 88 | Bradlee Anae | Utah | 75 | 257 | 4.93 | 25 | 115 | 31.0 | 7.44 | 4.43 | 27.4 | 44.6 | 17.2 |
| 91 | Trevis Gipson | Tulsa | 75 | 261 | NA | 25 | NA | NA | NA | NA | NA | NA | NA |
| 102 | Kenny Willekes | Michigan State | 75 | 264 | 4.87 | 32 | 119 | 32.5 | 7.39 | NA | 40.3 | 48.3 | 8.0 |
| 107 | James Lynch | Baylor | 75 | 289 | 5.01 | 23 | 111 | 29.0 | 7.39 | 4.39 | 49.3 | 50.2 | 0.9 |
| 108 | Khalid Kareem | Notre Dame | 75 | 268 | NA | NA | NA | NA | NA | NA | NA | NA | NA |
| 112 | Alex Highsmith | Charlotte | 75 | 248 | 4.70 | NA | 125 | 33.0 | 7.32 | 4.31 | 58.3 | 55.6 | -2.7 |
| 124 | Jonathan Greenard | Florida | 75 | 263 | 4.87 | 22 | 113 | 30.5 | 7.13 | 4.34 | 38.4 | 47.3 | 8.9 |
| 125 | Anfernee Jennings | Alabama | 74 | 256 | NA | NA | NA | NA | NA | NA | NA | NA | NA |
| 128 | Jonathan Garvin | Miami | 76 | 263 | 4.82 | 23 | 125 | 36.0 | NA | NA | 49.2 | 52.4 | 3.2 |
| 138 | Larrell Murchison | NC State | 74 | 297 | 5.05 | 29 | 118 | 29.0 | 7.89 | 4.51 | 47.2 | 49.9 | 2.7 |
| Jabari Zuniga | Florida | 75 | 264 | 4.64 | 29 | 127 | 33.0 | NA | NA | 62.6 | 56.2 | -6.4 | |
| James Smith-Williams | NC State | 75 | 265 | 4.60 | 28 | 123 | 32.0 | 7.35 | 4.52 | 63.3 | 54.5 | -8.8 | |
| Derrek Tuszka | North Dakota State | 76 | 251 | 4.79 | 24 | 120 | 33.5 | 6.87 | 4.34 | 46.9 | 54.0 | 7.1 | |
| Alton Robinson | Syracuse | 74 | 264 | 4.69 | 25 | 119 | 35.5 | 7.32 | 4.32 | 54.7 | 53.8 | -0.9 | |
| D.J. Wonnum | South Carolina | 76 | 258 | 4.73 | 20 | 123 | 34.5 | 7.25 | 4.44 | 52.5 | 53.4 | 1.0 | |
| Qaadir Sheppard | Ole Miss | 74 | 261 | 4.83 | 28 | 115 | 31.5 | NA | NA | 36.9 | 47.3 | 10.4 | |
| Trevon Hill | Miami | 74 | 248 | 4.89 | NA | 113 | 28.0 | NA | NA | 32.3 | 45.4 | 13.2 | |
| Kendall Coleman | Syracuse | 74 | 257 | 4.95 | NA | 114 | 32.0 | 7.50 | 4.62 | 34.5 | 45.2 | 10.7 | |
| LaDarius Hamilton | North Texas | 74 | 262 | 4.89 | 27 | 114 | 30.0 | 7.66 | 4.49 | 28.3 | 43.3 | 15.0 | |
| Chauncey Rivers | Mississippi State | 74 | 262 | 4.97 | 20 | 106 | 30.5 | 7.33 | 4.70 | 21.7 | 41.0 | 19.3 |
A.J. Epensa was the biggest disappointment of the edge defender class, registering the lowest WAR score of the 10 ranked prospects who ran the 40-yard dash. Epensa’s draft stock could plummet after putting up a 5.02 40-yard dash (6th percentile) and agility drills in the 30th percentile.
Charlotte’s Alex Highsmith had the highest WAR score of ranked prospects, with his 40 and broad jump registering in the 67th and 90th percentiles, respectively.
Off-Ball Linebackers
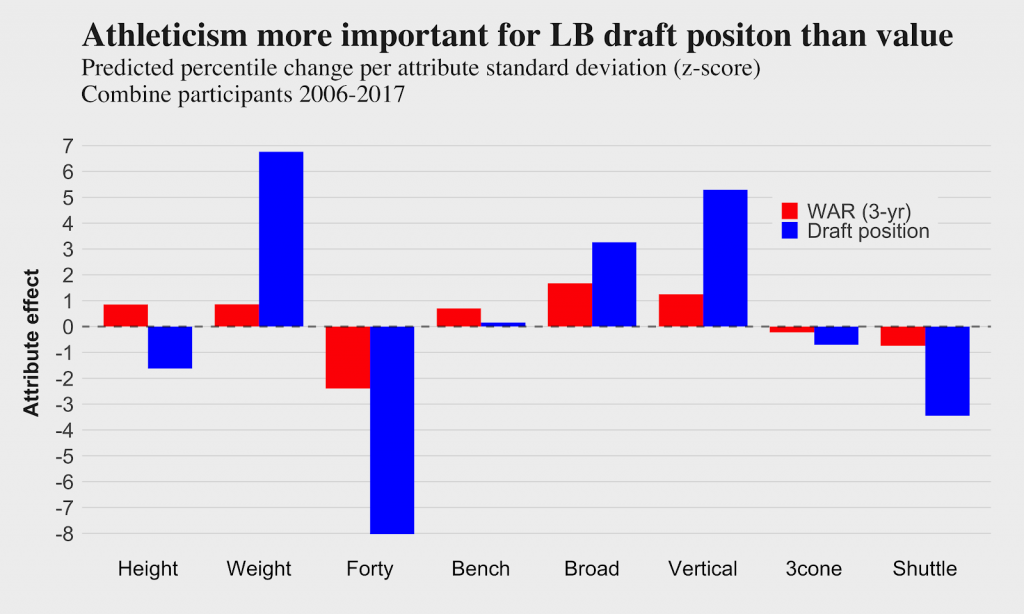
Size and speed, again, play heavily into linebackers’ draft positions — and WAR value to a lesser degree. The explosion drills (broad and vertical) are more significant than agility, which differs from interior defenders, in particular.
PFF Board |
Player |
College |
Height |
Weight |
Forty |
Bench |
Broad |
Vertical |
3cone |
Shuttle |
Draft Score |
WAR Score |
Diff |
7 |
Isaiah Simmons |
Clemson |
75 |
238 |
4.39 |
NA |
132 |
39.0 |
NA |
NA |
86.8 |
60.9 |
-26.0 |
46 |
Troy Dye |
Oregon |
75 |
231 |
NA |
NA |
NA |
NA |
NA |
NA |
NA |
NA |
NA |
48 |
Patrick Queen |
LSU |
72 |
229 |
4.50 |
18 |
125 |
35.0 |
NA |
NA |
61.0 |
55.2 |
-5.8 |
52 |
Kenneth Murray |
Oklahoma |
74 |
241 |
4.52 |
21 |
129 |
38.0 |
NA |
NA |
73.3 |
57.1 |
-16.3 |
55 |
Akeem Davis-Gaither |
Appalachian State |
73 |
224 |
NA |
21 |
NA |
NA |
NA |
NA |
NA |
NA |
NA |
73 |
Willie Gay Jr. |
Mississippi State |
73 |
243 |
4.46 |
21 |
136 |
39.5 |
7.08 |
4.30 |
87.2 |
60.4 |
-26.8 |
110 |
Davion Taylor |
Colorado |
72 |
228 |
4.49 |
21 |
127 |
35.0 |
6.96 |
4.26 |
61.3 |
56.5 |
-4.8 |
130 |
Cam Brown |
Penn State |
77 |
233 |
4.72 |
16 |
123 |
35.5 |
NA |
NA |
40.4 |
51.8 |
11.4 |
132 |
Jordyn Brooks |
Texas Tech |
72 |
240 |
4.54 |
NA |
NA |
NA |
NA |
NA |
66.1 |
52.0 |
-14.1 |
136 |
Logan Wilson |
Wyoming |
74 |
241 |
4.63 |
21 |
121 |
32.0 |
7.07 |
4.27 |
52.4 |
51.8 |
-0.6 |
139 |
David Woodward |
Utah State |
73 |
230 |
4.79 |
16 |
114 |
33.5 |
7.34 |
4.37 |
32.5 |
46.7 |
14.3 |
141 |
Markus Bailey |
Purdue |
72 |
235 |
NA |
15 |
NA |
NA |
NA |
NA |
NA |
NA |
NA |
144 |
Malik Harrison |
Ohio State |
74 |
247 |
4.66 |
NA |
122 |
36.0 |
6.83 |
4.32 |
63.7 |
53.1 |
-10.7 |
Casey Toohill |
Stanford |
76 |
250 |
4.62 |
17 |
126 |
39.0 |
7.08 |
4.21 |
72.1 |
56.1 |
-16.0 |
|
Carter Coughlin |
Minnesota |
75 |
236 |
4.57 |
NA |
126 |
36.0 |
NA |
NA |
64.2 |
55.0 |
-9.2 |
|
Shaun Bradley |
Temple |
72 |
235 |
4.51 |
14 |
121 |
32.5 |
7.07 |
4.24 |
59.8 |
54.0 |
-5.8 |
|
Jacob Phillips |
LSU |
75 |
229 |
4.66 |
NA |
126 |
39.0 |
7.38 |
4.33 |
58.9 |
53.9 |
-5.0 |
|
Khaleke Hudson |
Michigan |
71 |
224 |
4.56 |
30 |
120 |
33.0 |
NA |
NA |
49.0 |
52.1 |
3.1 |
|
Mykal Walker |
Fresno State |
75 |
230 |
4.65 |
20 |
122 |
33.0 |
7.09 |
4.25 |
42.8 |
52.1 |
9.3 |
|
Dante Olson |
Montana |
74 |
237 |
4.88 |
15 |
124 |
42.0 |
7.00 |
4.32 |
46.5 |
51.4 |
4.8 |
|
Joe Bachie |
Michigan State |
73 |
230 |
4.67 |
26 |
119 |
33.5 |
6.93 |
4.34 |
40.3 |
50.8 |
10.5 |
|
Chapelle Russell |
Temple |
74 |
236 |
4.69 |
21 |
121 |
35.0 |
7.38 |
4.41 |
49.2 |
50.4 |
1.2 |
|
Azur Kamara |
Kansas |
75 |
245 |
4.59 |
13 |
121 |
28.0 |
7.20 |
4.46 |
48.1 |
49.9 |
1.8 |
|
Evan Weaver |
California |
74 |
237 |
4.76 |
15 |
117 |
32.0 |
7.02 |
4.21 |
38.0 |
49.1 |
11.1 |
|
Cale Garrett |
Missouri |
73 |
234 |
4.92 |
NA |
124 |
32.0 |
6.91 |
4.13 |
35.6 |
48.5 |
12.9 |
|
Shaquille Quarterman |
Miami |
72 |
234 |
4.74 |
23 |
120 |
31.0 |
NA |
NA |
39.7 |
48.0 |
8.3 |
|
De'Jon Harris |
Arkansas |
71 |
234 |
4.69 |
18 |
111 |
33.0 |
7.38 |
4.32 |
44.9 |
47.7 |
2.8 |
|
Francis Bernard |
Utah |
72 |
234 |
4.81 |
19 |
120 |
32.5 |
NA |
NA |
36.9 |
47.2 |
10.3 |
|
Daniel Bituli |
Tennessee |
74 |
246 |
4.84 |
16 |
121 |
32.0 |
NA |
NA |
41.1 |
47.0 |
5.9 |
|
Justin Strnad |
Wake Forest |
75 |
238 |
4.74 |
NA |
113 |
29.0 |
NA |
4.49 |
33.0 |
45.6 |
12.6 |
|
Michael Divinity |
LSU |
73 |
242 |
4.85 |
14 |
115 |
31.0 |
NA |
NA |
33.6 |
44.9 |
11.3 |
|
Nick Coe |
Auburn |
76 |
280 |
4.89 |
21 |
116 |
29.0 |
NA |
NA |
55.1 |
43.9 |
-11.1 |
|
Tipa Galeai |
Utah State |
76 |
235 |
NA |
NA |
NA |
NA |
NA |
NA |
NA |
NA |
NA |
|
Clay Johnston |
Baylor |
73 |
227 |
NA |
18 |
NA |
NA |
NA |
NA |
NA |
NA |
NA |
|
Jordan Mack |
Virginia |
74 |
241 |
NA |
NA |
NA |
NA |
NA |
NA |
NA |
NA |
NA |
|
Kamal Martin |
Minnesota |
74 |
240 |
NA |
NA |
NA |
NA |
NA |
NA |
NA |
NA |
NA |
|
Michael Pinckney |
Miami |
71 |
235 |
NA |
NA |
NA |
NA |
NA |
NA |
NA |
NA |
NA |
Linebackers were one of the more impressive position groups at the Combine, and no one stood out more than Isaiah Simmons. The Clemson multi-position stud registered the 99th percentile for the 40-yard dash, 98th percentile for the broad jump and 91st percentile for the vertical jump.
Simmons was joined by Willie Gay Jr. as another Combine breaker, and both are likely to see their draft stocks rise in the coming weeks. Simmons might be worthy of the No. 2 pick conversation, although his merits should have been apparent without leaning on athletic testing.
Safeties
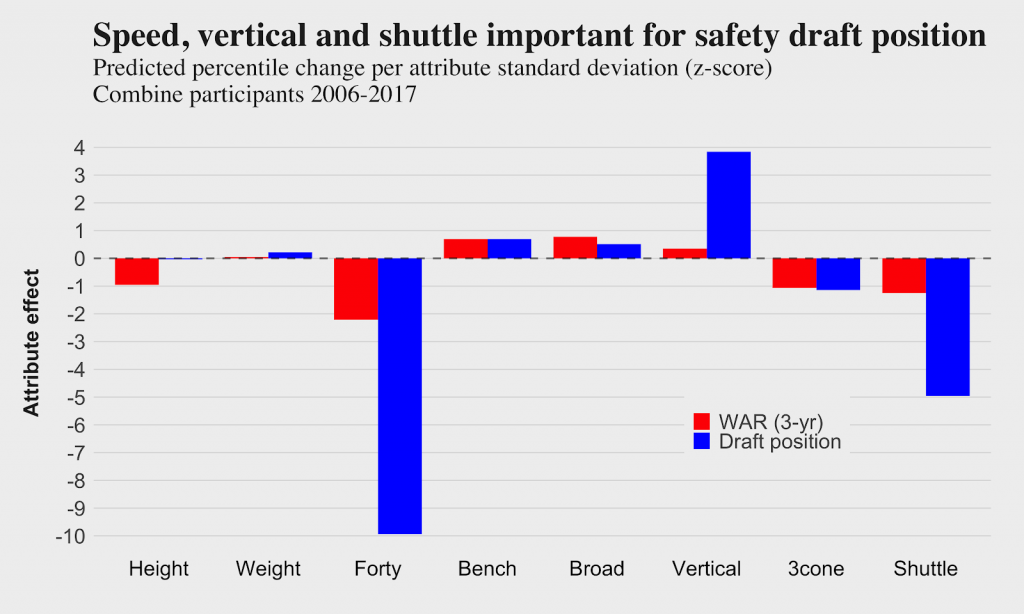
The attribute effects at the safety position show a continued focus on speed, though not much on size. The vertical jump and short shuttle are also significant for the draft. The attribute effects for WAR value are much smaller at safety, with 40-yard dash having the largest effect, though much less than for the draft.
| PFF Board | Player | College | Height | Weight | Forty | Bench | Broad | Vertical | 3cone | Shuttle | Draft Score | WAR Score | Diff |
| 18 | Grant Delpit | LSU | 74 | 213 | NA | NA | NA | NA | NA | NA | NA | NA | NA |
| 19 | Xavier McKinney | Alabama | 72 | 201 | 4.63 | 19 | 122 | 36.0 | NA | NA | 38.3 | 48.0 | 9.6 |
| 34 | Ashtyn Davis | California | 73 | 202 | NA | 14 | NA | NA | NA | NA | NA | NA | NA |
| 51 | Geno Stone | Iowa | 70 | 207 | 4.62 | 12 | 116 | 33.5 | NA | NA | 39.6 | 49.6 | 10.0 |
| 56 | Kyle Dugger | Lenoir-Rhyne | 73 | 217 | 4.49 | 17 | 134 | 42.0 | NA | NA | 62.1 | 49.5 | -12.6 |
| 62 | Terrell Burgess | Utah | 71 | 202 | 4.46 | 20 | 122 | 33.5 | NA | NA | 57.0 | 53.2 | -3.8 |
| 82 | Antoine Winfield Jr. | Minnesota | 69 | 203 | 4.45 | NA | 124 | 36.0 | NA | NA | 57.6 | 56.8 | -0.8 |
| 85 | K'Von Wallace | Clemson | 71 | 206 | 4.53 | 18 | 133 | 38.0 | 6.76 | 4.15 | 58.4 | 55.8 | -2.5 |
| 114 | Julian Blackmon | Utah | 72 | 187 | NA | NA | NA | NA | NA | NA | NA | NA | NA |
| 119 | Jalen Elliott | Notre Dame | 72 | 205 | 4.80 | 15 | 125 | 34.0 | 6.87 | 4.30 | 15.7 | 43.7 | 28.0 |
| 131 | Brandon Jones | Texas | 71 | 198 | NA | NA | NA | NA | NA | NA | NA | NA | NA |
| 135 | Jordan Fuller | Ohio St. | 74 | 203 | 4.67 | NA | 122 | 35.5 | NA | 4.27 | 26.8 | 43.6 | 16.7 |
| 143 | Alohi Gilman | Notre Dame | 70 | 201 | 4.60 | 17 | 119 | 32.0 | 6.81 | 4.08 | 45.9 | 54.8 | 9.0 |
| L'Jarius Sneed | Louisiana Tech | 72 | 192 | 4.37 | 12 | 131 | 41.0 | NA | NA | 75.3 | 57.4 | -17.9 | |
| Daniel Thomas | Auburn | 70 | 215 | 4.51 | 24 | 125 | 37.0 | NA | NA | 56.5 | 52.3 | -4.2 | |
| Chris Miller | Baylor | 71 | 190 | 4.61 | 12 | 133 | 35.5 | 7.09 | 4.12 | 44.6 | 52.1 | 7.6 | |
| Josh Metellus | Michigan | 71 | 209 | 4.55 | 20 | 124 | 36.5 | 6.94 | 4.40 | 46.4 | 50.2 | 3.8 | |
| J.R. Reed | Georgia | 73 | 202 | 4.54 | 15 | 130 | 34.0 | NA | NA | 46.1 | 48.3 | 2.2 | |
| Tanner Muse | Clemson | 74 | 227 | 4.41 | 20 | 124 | 34.5 | NA | NA | 62.5 | 46.9 | -15.5 | |
| Jeremy Chinn | Southern Illinois | 75 | 221 | 4.45 | 20 | 138 | 41.0 | NA | NA | 63.6 | 46.9 | -16.7 | |
| Kamren Curl | Arkansas | 73 | 206 | 4.60 | 24 | 125 | 34.5 | NA | NA | 39.1 | 46.3 | 7.2 | |
| Antoine Brooks Jr. | Maryland | 71 | 220 | 4.64 | 18 | NA | 34.5 | NA | NA | 37.7 | 46.0 | 8.4 | |
| Rodney Clemons | SMU | 72 | 209 | 4.71 | 21 | 118 | 33.5 | NA | NA | 26.2 | 44.1 | 17.9 | |
| Brian Cole II | Mississippi St. | 74 | 213 | NA | NA | NA | NA | NA | NA | NA | NA | NA | |
| Jaylinn Hawkins | California | 73 | 208 | NA | NA | 117 | 35.5 | NA | NA | NA | NA | NA |
The top Combine performances at safety are best classified as good, not great. Antoine Winfield Jr. had the best WAR score of ranked safeties. Winfield’s 40 was in the 80th percentile, though at 30th percentile weight.
Xavier McKinney and Geno Stone — our second- and third-ranked players at safety — both ran in the 4.6s in the 40, likely damaging their draft position more than the likelihood they’ll actually fail on the field.
Cornerbacks
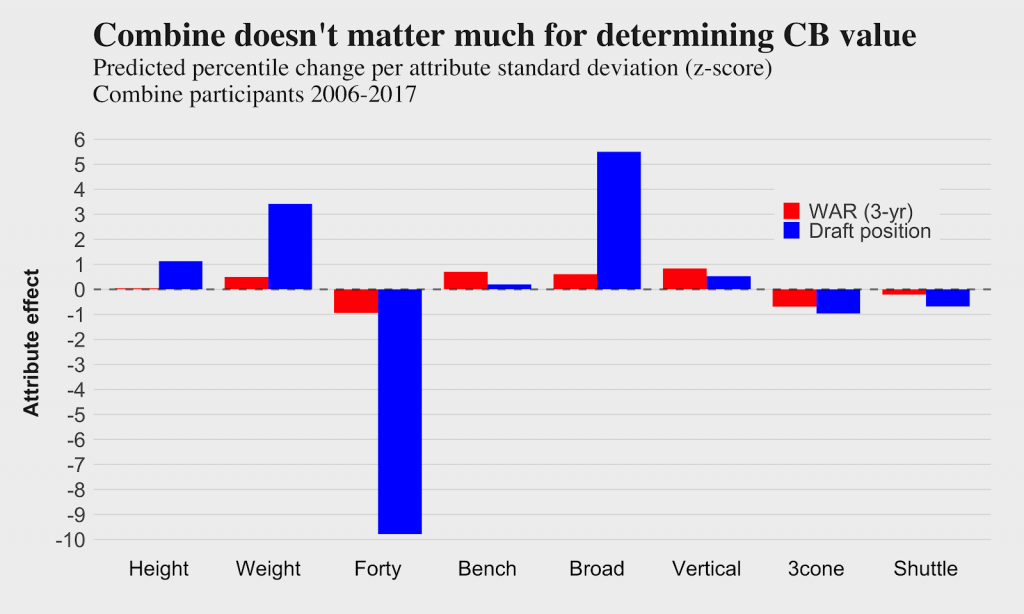
Like their defensive back brethren, a cornerback's draft position is primarily driven by speed, followed by broad jump and weight. Size matters more for cornerbacks than safeties, and the agility drills are less important. Vertical jump and bench press are the only metrics with slightly higher effects on WAR than the draft.
| PFF Board | Player | College | Height | Weight | Forty | Bench | Broad | Vertical | 3cone | Shuttle | Draft Score | WAR Score | Diff |
| 4 | Jeff Okudah | Ohio St. | 73 | 205 | 4.48 | 11 | 135 | 41.0 | NA | NA | 64.5 | 55.4 | -9.1 |
| 17 | Kristian Fulton | LSU | 72 | 197 | 4.46 | NA | 123 | 35.5 | 6.94 | 4.36 | 55.0 | 49.6 | -5.4 |
| 21 | C.J. Henderson | Florida | 73 | 204 | 4.39 | 20 | 127 | 37.5 | NA | NA | 70.3 | 54.4 | -15.9 |
| 24 | Cameron Dantzler | Mississippi St. | 74 | 188 | 4.64 | NA | NA | 34.5 | NA | NA | 24.5 | 42.0 | 17.6 |
| 27 | Trevon Diggs | Alabama | 73 | 205 | NA | NA | NA | NA | NA | NA | NA | NA | NA |
| 28 | Jaylon Johnson | Utah | 72 | 193 | 4.50 | 15 | 124 | 36.5 | 7.01 | 4.13 | 48.2 | 49.8 | 1.6 |
| 35 | Jeff Gladney | TCU | 70 | 191 | 4.48 | 17 | 124 | 37.5 | 7.26 | NA | 45.2 | 50.2 | 5.0 |
| 37 | A.J. Terrell | Clemson | 73 | 195 | 4.42 | 15 | 129 | 34.5 | NA | NA | 64.6 | 51.4 | -13.2 |
| 49 | Bryce Hall | Virginia | 73 | 202 | NA | 11 | NA | NA | NA | NA | NA | NA | NA |
| 63 | Noah Igbinoghene | Auburn | 70 | 198 | 4.48 | 15 | 128 | 37.0 | NA | NA | 52.3 | 51.3 | -1.0 |
| 65 | Troy Pride | Notre Dame | 71 | 193 | 4.40 | 13 | 119 | 35.5 | 6.94 | 4.26 | 55.0 | 50.2 | -4.8 |
| 74 | Damon Arnette | Ohio St. | 72 | 195 | 4.56 | NA | NA | NA | NA | NA | 37.2 | 45.2 | 8.0 |
| 76 | Darnay Holmes | UCLA | 70 | 195 | 4.48 | 12 | NA | NA | NA | NA | 43.4 | 47.5 | 4.1 |
| 147 | Shyheim Carter | Alabama | 70 | 194 | NA | NA | NA | NA | NA | NA | NA | NA | NA |
| Javelin Guidry | Utah | 69 | 191 | 4.29 | 21 | NA | NA | NA | NA | 69.9 | 54.4 | -15.6 | |
| Kindle Vildor | Georgia Southern | 70 | 191 | 4.44 | 22 | 133 | 39.5 | 7.14 | 4.28 | 58.8 | 54.3 | -4.6 | |
| Essang Bassey | Wake Forest | 69 | 191 | 4.46 | 12 | 128 | 39.5 | 6.95 | 4.13 | 52.7 | 53.7 | 1.0 | |
| Reggie Robinson III | Tulsa | 73 | 205 | 4.44 | 22 | 132 | 36.0 | 7.09 | 4.18 | 68.3 | 53.6 | -14.7 | |
| Harrison Hand | Temple | 71 | 197 | 4.52 | 14 | 133 | 41.0 | 7.15 | 4.27 | 51.2 | 53.4 | 2.1 | |
| John Reid | Penn St. | 70 | 187 | 4.49 | 20 | 129 | 36.5 | 6.95 | 3.97 | 51.5 | 52.0 | 0.5 | |
| Javaris Davis | Auburn | 68 | 183 | 4.39 | 11 | 124 | 35.5 | NA | NA | 53.2 | 51.2 | -2.0 | |
| Michael Ojemudia | Iowa | 73 | 200 | 4.45 | NA | 122 | 36.0 | 6.87 | 4.21 | 59.7 | 51.1 | -8.6 | |
| Stantley Thomas-Oliver | Florida International | 72 | 192 | 4.48 | NA | 127 | 34.0 | NA | NA | 54.8 | 49.3 | -5.5 | |
| Josiah Scott | Michigan St. | 69 | 185 | 4.42 | 17 | NA | NA | NA | NA | 46.8 | 48.6 | 1.8 | |
| Lamar Jackson | Nebraska | 74 | 208 | 4.58 | 10 | 122 | 36.5 | NA | NA | 41.8 | 47.2 | 5.4 | |
| Dane Jackson | Pittsburgh | 72 | 187 | 4.57 | NA | 122 | 35.0 | 7.07 | 4.27 | 35.5 | 45.6 | 10.1 | |
| Trajan Bandy | Miami | 68 | 180 | 4.50 | 10 | NA | NA | NA | NA | 29.9 | 44.6 | 14.7 | |
| James Pierre | Florida Atlantic | 72 | 183 | 4.59 | NA | 123 | 33.5 | 7.02 | NA | 32.3 | 44.0 | 11.6 | |
| A.J. Green | Oklahoma St. | 73 | 202 | 4.62 | 13 | NA | NA | NA | NA | 30.0 | 43.3 | 13.3 | |
| Grayland Arnold | Baylor | 69 | 186 | 4.59 | 12 | 120 | 33.0 | 7.01 | 4.30 | 24.6 | 42.9 | 18.4 | |
| Myles Bryant | Washington | 68 | 183 | 4.62 | NA | 115 | 31.5 | 6.81 | 4.02 | 21.0 | 42.5 | 21.5 | |
| Stanford Samuels | Florida St. | 73 | 187 | 4.65 | NA | NA | NA | NA | NA | 20.9 | 40.8 | 19.9 | |
| BoPete Keyes | Tulane | 73 | 202 | NA | NA | 126 | 36.0 | NA | NA | NA | NA | NA | |
| Nevelle Clarke | UCF | 73 | 190 | NA | 10 | 126 | 35.0 | 6.88 | 4.31 | NA | NA | NA | |
| Lavert Hill | Michigan | 70 | 190 | NA | 21 | NA | NA | NA | NA | NA | NA | NA | |
| Amik Robertson | Louisiana Tech | 68 | 187 | NA | NA | NA | NA | NA | NA | NA | NA | NA |
Jeff Okudah solidified his position as the top cornerback in the class with the highest WAR Score in the class. C.J. Henderson and A.J. Terrell posted better draft scores based on superior speed. But Okudah’s 98th and 96th percentile broad and vertical jumps put him in a different class for player value.
