Earlier this week I wrote about what NFL Combine metrics matter for offensive players, and now we turn to the defense. Like their offensive counterparts, Combine metrics have mattered more for prospects’ draft position than their actual value, as measured by our proprietary wins above replacement (WAR) metric.
Generally, teams are targeting the right athletic variables in the NFL Draft, though often not to the right proportion. My analysis accounts for all of the major Combine metrics for defenders: height, weight, 40-yard dash, bench press, broad jump, vertical jump, three-cone drill and short shuttle. But looking through 12 years of historical Combine, draft and WAR data, we can identify which drills teams have been paying attention to and which ones they should look at more closely.
Methodology
This analysis is built on strong work from former Harvard Sports Analysis Collective member Bill Lotter in his series detailing why the NFL Combine actually matters. Lotter used ridge regression to estimate the coefficients for the different Combine results and measure their importance in explaining prospects’ draft positions and value — the latter estimated using Pro Football Reference’s approximate value (AV) over players’ first three seasons.
Approximate value was a tremendous advancement in player valuation and the best public metric available to Lotter at the time of the analysis. The shortcomings of AV mostly relate to its focus on volume and the inability to differentiate between players on the same teams for certain position groups that lack traditional stats, such as defensive backs. Even for position groups with more extensive traditional stats, such as tackles and sacks, their production can be more a function of luck and opportunity than adding value. This is where PFF’s WAR metric can truly add the proper context and weighting to the performance of each player. For my analysis, I’m contrasting WAR to draft position, in substitution of AV.
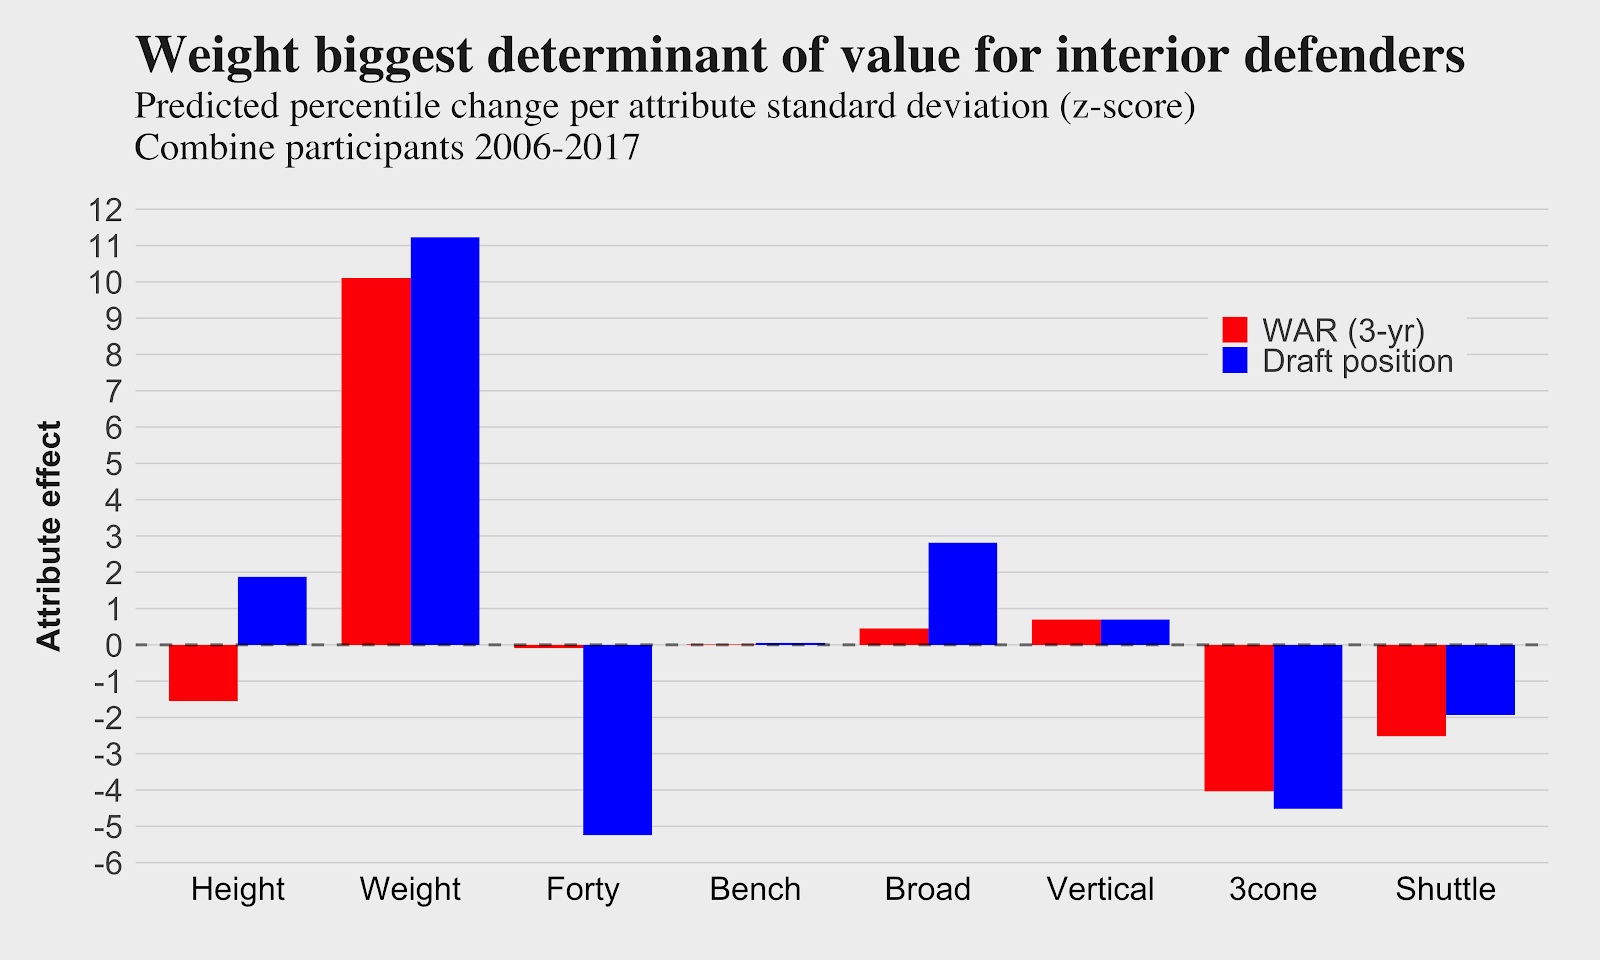
The plots below give the coefficient for each measurement or drill denominated by standard deviation within the position group. The draft positions and WAR for position groups are translated to percentile, giving both the same scale. Each bar below represents the amount of percentile movement you’d expect for a player with one standard deviation above or below the positional average. For timed drills, a negative coefficient is better. Lower times in the forty, three-cone and short shuttle generally translate to better draft positions and higher WAR over the first three seasons of a player’s career.
The sample for this analysis covers all players who participated in all drills or all but one drill from 2006 to 2017. For players who missed a drill, the value was input through regression on the remaining variables, with a discount under the assumption the drill was skipped with an expectation of underperformance. Players who participated in the combine and were not drafted are included in the sample with an assumed draft position of 300. And those players who never played an NFL snap are also included, with a WAR produced of zero.
Below each plot, I’ve included a table with the top-10 projections for positional WAR (first three seasons) in the 2006-to-2017 period, including the players’ Combine marks and their actual WAR produced.
Defensive Interior

Despite the fact that Aaron Donald was one of the lightest (285 pounds) and most successful players at the position, bigger is generally better for interior defenders. Donald is viewed as more of an outlier — many of the lighter interior defenders produce negative WAR.
In addition to weight, the agility drills (three-cone and short shuttle) show roughly as much significance for WAR as draft position. The 40-yard dash is the second most significant determinant for draft position, but it barely registers for WAR.
Top Historical Defensive Interior WAR Predictions
| Year | Pick | Player | College | Height | Weight | Forty | Bench | Broad | Vertical | 3cone | Shuttle | WAR (3-yr) |
| 2013 | 300 | T.J. Barnes | Georgia Tech | 78 | 369 | 5.30 | 25 | 97 | 22.0 | 8.26 | 4.96 | 0.0 |
| 2012 | 11 | Dontari Poe | Memphis | 75 | 346 | 4.89 | 44 | 105 | 29.5 | 7.90 | 4.56 | 0.3 |
| 2007 | 108 | Paul Soliai | Utah | 76 | 344 | 5.10 | NA | 103 | 29.5 | 7.66 | 4.69 | 0.0 |
| 2014 | 165 | Ryan Carrethers | Arkansas State | 73 | 337 | 5.47 | 32 | 88 | 26.0 | 7.89 | 4.60 | 0.0 |
| 2010 | 57 | Terrence Cody | Alabama | 76 | 354 | 5.71 | NA | 90 | 20.5 | 8.19 | 5.03 | 0.0 |
| 2009 | 9 | B.J. Raji | Boston College | 73 | 337 | 5.12 | 33 | 103 | 32.0 | 7.90 | 4.69 | 0.1 |
| 2008 | 151 | Frank Okam | Texas | 76 | 347 | 5.32 | 32 | 104 | 23.0 | 8.07 | 4.95 | 0.0 |
| 2014 | 107 | Justin Ellis | Louisiana Tech | 73 | 334 | 5.27 | 25 | 92 | 28.0 | 7.81 | 4.75 | 0.1 |
| 2015 | 12 | Danny Shelton | Washington | 74 | 339 | 5.64 | 34 | 95 | 30.5 | 7.99 | 4.65 | 0.3 |
| 2012 | 82 | Mike Martin | Michigan | 73 | 306 | 4.80 | 36 | 113 | 33.5 | 7.19 | 4.25 | 0.1 |
Unsurprisingly — with the significance of weight paramount for forecasting WAR — the top-10 historical projections are all over 300 pounds, with most well over 330. Most of the players listed produced little WAR in their first three seasons, but none were negative. If you look at players in the lower weight range (260-290 pounds), many were negative other than Donald’s massive number.


 © 2026 PFF - all rights reserved.