Obviously, “fantasy points” is the stat that most illustrates a player’s contributions to fantasy football. But if you’re looking for a number that can point you in that direction — and one that is very sticky year-over-year, which is also what you want — you could do a lot worse than yards per route run.
Among wide receivers with at least 50 targets in 2018, YPRR and PPR points per game carried a correlation of 0.74 in 2018, which is … pretty nice. And given that YPRR is a sticky metric (look no further than led-the-league-four-straight-years Julio Jones), we can feel pretty good about its ability to help us look forward as well.
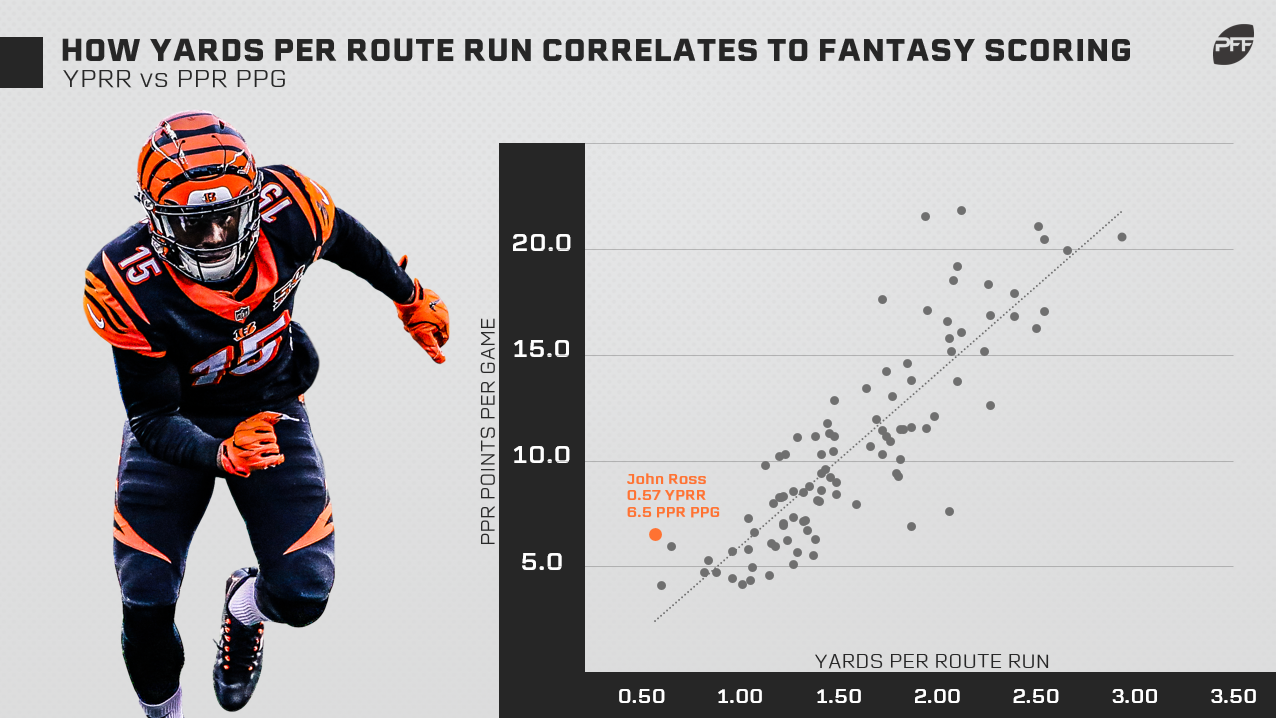
The primary variances on the correlation between YPRR and PPR points per game is, naturally, touchdowns — and, more specifically, touchdown luck. A player who scares on a disproportionate number of his receptions is going to exceed his YPRR-predicted fantasy point average; a player who fails to find the end zone will fall short.
I looked at the luckiest touchdown scorers of 2018 earlier this offseason based purely on touchdowns and targets. That analysis holds. But YPRR can also give an indication of some of the most and least fortunate fantasy options of 2018, and offer up some ideas of what to expect out of those players in 2019.
Today, we’re going to look at players whose fantasy points per game most lagged behind their YPRR expectation. Monday, we looked at the ones who beat their expectation.
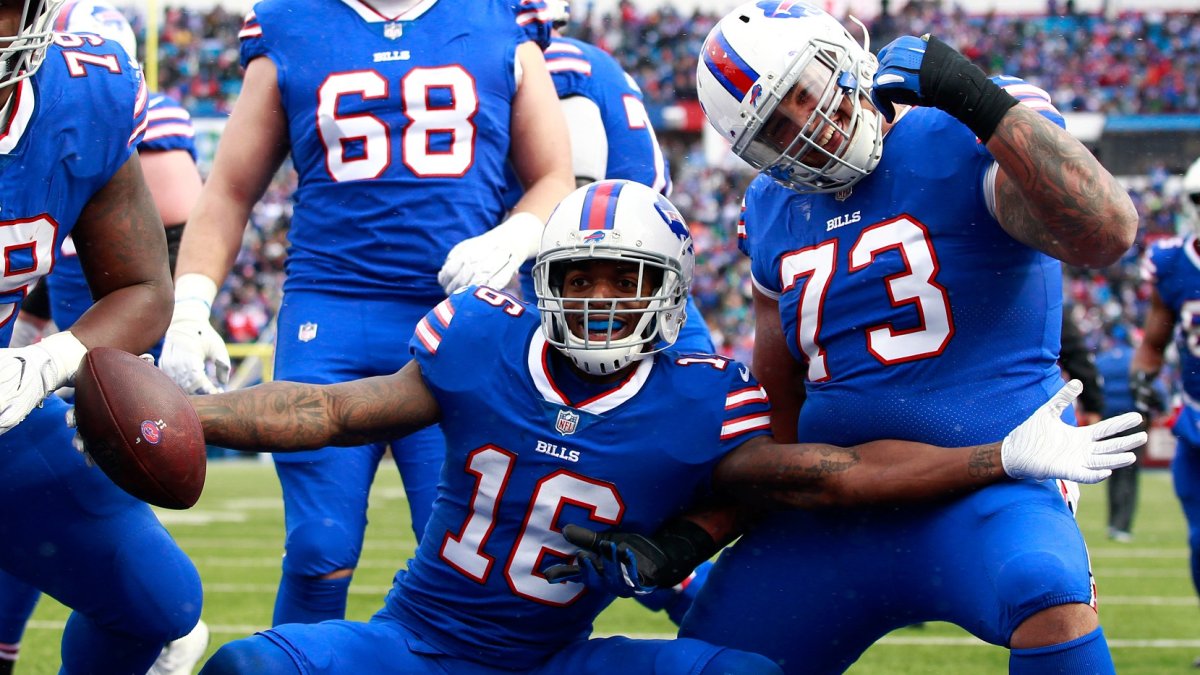
Robert Foster, Buffalo Bills
PPR points per game: 7.6
YPRR-expected points per game: 14.7
Difference: 7.1
Foster’s problem in this exercise is just that he didn’t have significant playing time for a big chunk of the season. He averaged barely 16 snaps a game through Week 6, missed Weeks 7-9, then suddenly started getting real playing time down the stretch, averaging almost 60 snaps a game. In that first chunk of the year, Foster had 2 receptions on 9 targets for 30 yards. In the last chunk, he had 25 receptions on 35 targets for 511 yards and 3 touchdowns. There’s a pretty clear gap there, and over the latter chunk, he averaged more than 13 PPR points per game … right in line with his YPRR expectation. Foster now has a much deeper cast of receivers to contend with in Buffalo, but his career got off to the right start.
DeSean Jackson, Philadelphia Eagles
PPR points per game: 12.6
YPRR-expected points per game: 16.4
Difference: 3.8
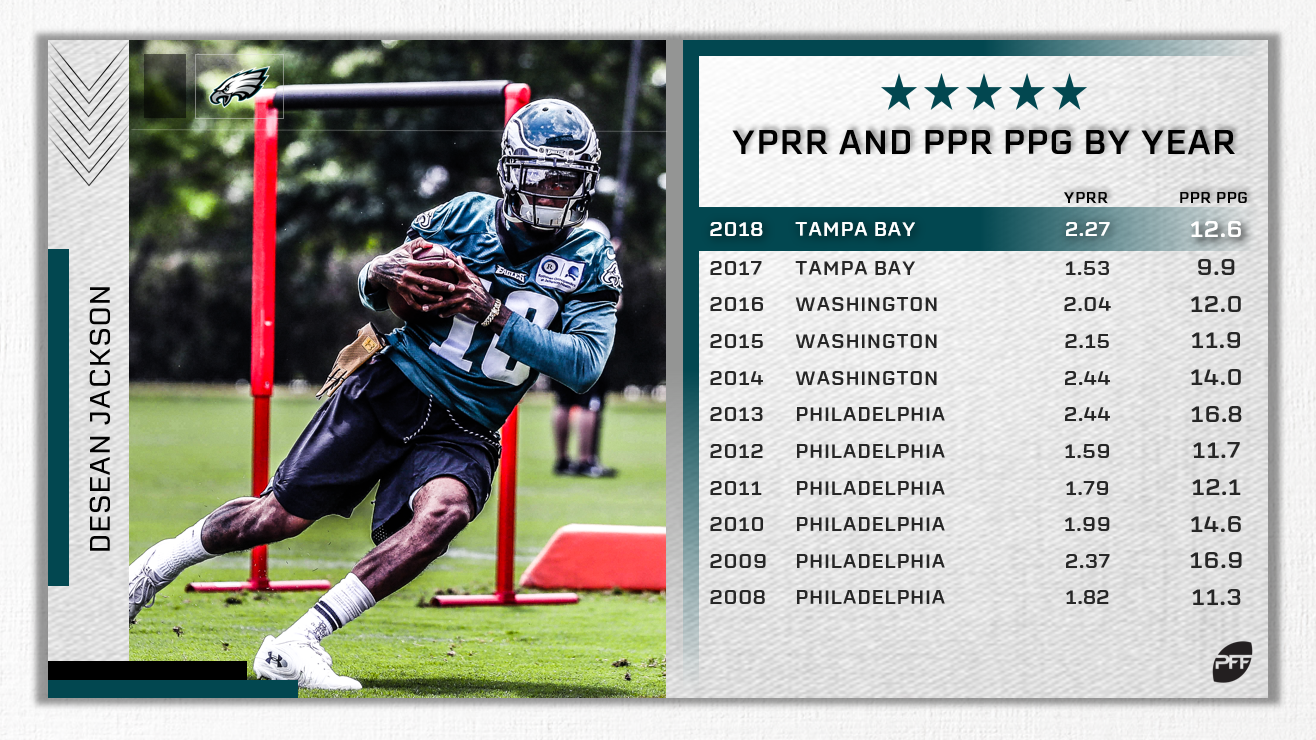
Early in his career, Jackson’s YPRR expectation and actual PPR point average tracked exceptionally close to one another — he was within one point of his expectation every year 2008-2013. He’s fallen off pace since with a gap of three or more points in 2014, 2015, and 2018. The upshot of this is that Jackson is still one heck of a deep threat, capable of his occasional explosions like he always has been, but he’s just not capable of them as often. As Toby Keith said, “I ain’t as good as I once was, but I’m as good once as I ever was.”
Dante Pettis/Marquise Goodwin, San Francisco 49ers
PPR points per game: Pettis 9.4, Goodwin 7.9
YPRR-expected points per game: Pettis 12.4, Goodwin 10.8
Difference: Pettis 3.0, Goodwin 2.9
Nick Mullens put up a passable (no pun intended) performance as an emergency quarterback last year, but Jimmy Garoppolo still clearly has more upside. If he can unlock the upside in Pettis and Goodwin (not to mention rookies Deebo Samuel and Jalen Hurd), the 49ers offense could be something special in 2019.
Keenan Allen, Los Angeles Chargers
PPR points per game: 16.3
YPRR-expected points per game: 18.3
Difference: 2.0
Players who put up significant points per game don’t tend to fall very short of their expectation, obviously. Allen is the only player in the top-20 of players falling short of expectation in 2018 to top 13 points per game, and he and T.Y. Hilton (difference of 1.5) are the only such players in the top-30. A year after finishing as the No. 3 WR with 2.55 YPRR, Allen fell to the No. 12 despite an almost-equal 2.50 YPRR. That might indicate there’s still room for growth out of Allen in 2019, and the No. 3 WR finish is still well within his range of outcomes.
