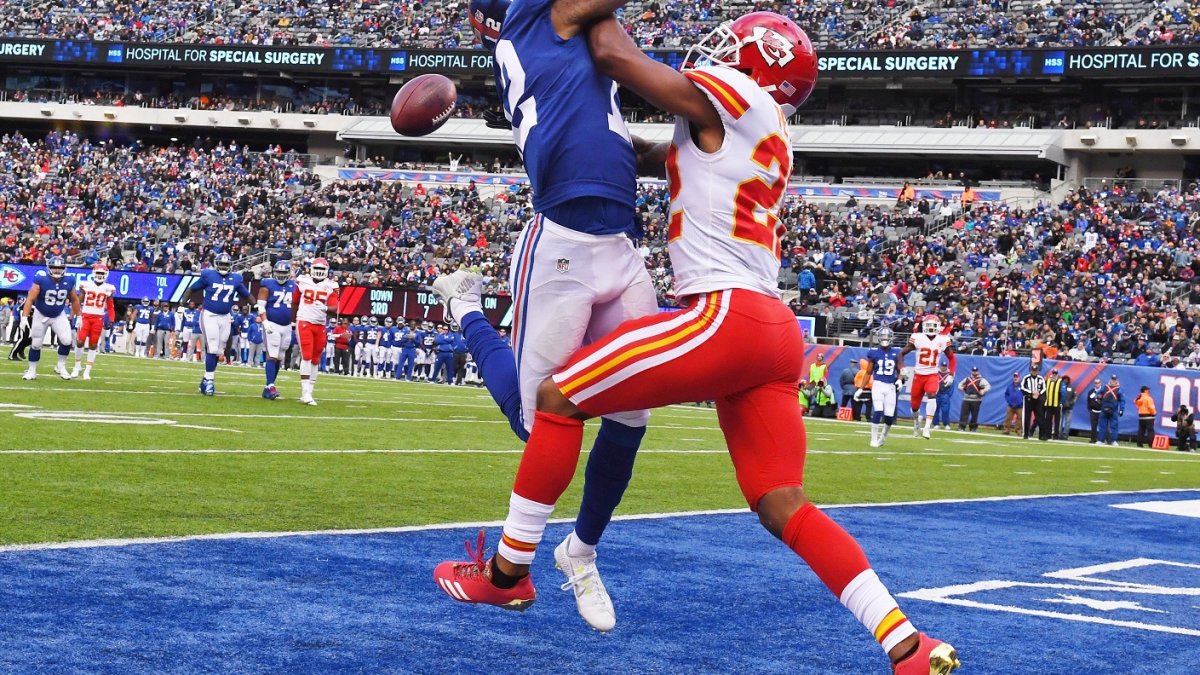
Two weeks ago, the Chiefs played the Giants in New York and lost 12-9 in overtime. Alex Smith and Eli Manning combined to throw for just 435 yards. Neither threw a touchdown, and there were four interceptions in total, although two of them came from skill players Travis Kelce and Shane Vereen. Because of the broader narrative surrounding those teams, that game is likely remembered as just another example of each team’s recent offensive struggles. But there was another factor in play — there were heavy winds.
That Giants game is the one I remember this season as having substantial winds, and that is supported by some evidence. Its Game Book lists a 23 mph wind at start time, and you can see some subtle indication of the wind in parts of the highlight video. Check out No. 63 Chad Wheeler’s hair blowing around the 1:58 mark. Around 3:30, you can see the blue NY tarp being tossed around behind Smith’s deep completion to Tyreek Hill, and at 5:27, you can see some trash blow briskly across the field. You can even hear analyst Dan Fouts reference the wind around the 4:47 mark as a possible reason for Kelce’s interception.
Seemingly, the wind was heavy enough at times to affect the game play, but when I calculated the average wind speeds around the game times of every game this season in ISD weather stations near the stadiums, that Giants game was not even in the top-50 with its 3.1 mph average wind speed. That could be evidence of bad data, but I think it’s more likely evidence that I am trying to treat a complex problem too simply. When I started to unpack the reason for that low average wind, I realized I needed to change some assumptions.
| Average Wind Speeds, ISD Stations near Met Life Stadium, Week 11 | ||
| Station Name | Miles | Wind Speed |
| TETERBORO AIRPORT | 2.5 | 9.1 |
| CENTRAL PARK | 5.9 | 5.2 |
| PORT AUTH DOWNTN MANHATTAN WA | 8.5 | 1.9 |
| NEWARK LIBERTY INTERNATIONAL | 10.3 | 10.4 |
| LA GUARDIA AIRPORT | 10.5 | 11.8 |
| ROBINS REEF | 11.3 | 12.2 |
| ESSEX COUNTY AIRPORT | 11.7 | 8.0 |
Those are the seven best ISD stations I have for the Giants game, and you can see evidence of heavier winds at several of the stations, including Teterboro Airport, which is the closest — 2.5 miles away — I have to MetLife Stadium. The most anomalous station is the Manhattan Port Authority, which I then discovered had more readings than the other stations. That biased my averages and made me consider whether averages were the right tool for this examination in the first place.
In honor of Tiger Woods’ latest return, let me make a golf analogy. When there is a moderate, sustained wind, a golfer can play for it. If there is a consistent 10 mph wind behind a player, then he knows he can hit one less club and consistently fly to the correct distance. It gets much, much harder when the wind is not sustained but changes speeds and directions. That’s when you see even professional golfers miss greens by one or two clubs. It’s not just that the wind carries a shot that would have traveled the correct distance some yards too short or far. It’s that the unpredictable nature of the wind can lead a golfer to midjudge what type of shot will lead to success.
I suspect wind plays a similar role for a quarterback as it does a golfer, which means his error in perception of the impact of wind is more meaningful than the actual impact of wind. And by that logic, I think minimums, medians, and especially maximums make the most sense to judge the impact of wind. Not only do they bypass the issue I faced with averages where certain stations have more or fewer readings, they also capture an approximation of wind gusts.
| Min, Median, and Max Wind Speeds, ISD Stations near Met Life Stadium, Week 11 | ||||
| Station Name | Miles | Min | Median | Max |
| TETERBORO AIRPORT | 2.5 | 6.7 | 8.8 | 12.9 |
| CENTRAL PARK | 5.9 | 2.6 | 5.1 | 6.7 |
| PORT AUTH DOWNTN MANHATTAN WA | 8.5 | 0.0 | 2.1 | 3.1 |
| NEWARK LIBERTY INTERNATIONAL | 10.3 | 5.1 | 11.3 | 12.9 |
| LA GUARDIA AIRPORT | 10.5 | 8.8 | 12.4 | 14.4 |
| ROBINS REEF | 11.3 | 5.1 | 12.7 | 19.6 |
| ESSEX COUNTY AIRPORT | 11.7 | 5.1 | 8.8 | 9.8 |
Teterboro, Newark, and La Guardia Airports as well as Robin’s Reef Lighthouse all measured wind speeds over 12.5 mph in their highest readings. Central Park, the Manhattan Port Authority, and Essex Airport did not, but given that each made only a handful of point-in-time readings over the course of the game, who’s to say that they didn’t experience similar or even stronger wind gusts over those several hours? The whole idea behind my collecting data at many different stations was to get as much relevant data as I can for games. Meanwhile, when you use the maximum wind speeds of all stations within 15 miles of each game this season, the Week 11 Giants game jumps to the top of the list.
| Highest Maximum Wind Speeds in Surrounding ISD Stations, 2017 | ||||
| Week | Stadium | Home Team | Away Team | Gust Speed (mph) |
| 11 | MetLife Stadium | NYG | KC | 19.6 |
| 7 | Soldier Field | CHI | CAR | 17.5 |
| 8 | MetLife Stadium | NYJ | ATL | 15.4 |
| 4 | Sports Authority Field at Mile High | DEN | OAK | 13.9 |
| 8 | Raymond James Stadium | TB | CAR | 12.9 |
| 9 | Nissan Stadium | TEN | BLT | 11.8 |
| 4 | Raymond James Stadium | TB | NYG | 11.3 |
| 8 | FedEx Field | WAS | DAL | 11.3 |
| 5 | Soldier Field | CHI | MIN | 10.3 |
At 19.6 mph, my highest wind speed for the Giants game is still a bit short of the Game Book speed of 23 mph, and it’s significantly lower some of the gust estimations above 30 mph I’ve seen in game recaps. There may be real reasons for those differences, such as the architecture of the stadium creating wind tunnels. But, it does seem to be a much better reflection of the impact wind likely had on the play in that game, and it more logically orders that game as the heaviest wind game this season. And now that I’ve settled on an approach to categorize the heaviness of wind for games, I can start my research on what impact that wind can have on player performance.
