Over the course of the last 12 months, I have written intermittent articles on some highly specific research topics related to fantasy football. It may not have been obvious in reading an article about NOAA weather stations or an article about Chip Kelly’s offensive pace, but those were all parts of a whole effort to build a comprehensive weekly projection and ranking system. Finally and with little time to spare before the start of the 2018 season, I have a working system in place. And while it was a bear to make that happen, I can explain the end product in six easy steps.
Step 1: Project team pass and run plays for the upcoming games
These pass- and run-play projections rely on teams’ play totals from the previous two seasons, but only if either their starting quarterback or head coach is still with the team. Both passers and coaches show consistency in their year-to-year snap correlations, even if the other changes. I give play counts from one year ago three times the weight of play counts from two years ago, and play counts from this year five times the weight of play counts from two years ago. I also add in a few games of the league rate as regression — and rely on it exclusively for teams with new quarterbacks and head coaches.
Most interesting thing: I de-adjust pass- and run-play totals from previous games for the venue, weather, and tendencies of the defensive opponent so the totals represent my estimate of what would have happened in a context-neutral situation. I’ll refer to this idea as “true talent” throughout the article, which is just my way of expressing that it attempts to put players on even footing.
Note that all of my “true talent” projections still differentiate by each team’s projected offensive pace. If you wanted to use my projections to compare two players only by their own abilities, I recommend you do that with their per-play, “true talent” projections.
Fun with math: Minnesota projects to have 34.3 “true talent” pass plays and 28.1 “true talent” run plays in Week 1.
Step 2: Allocate carries and targets to skill players
By and large, these allocations are based on teams’ and the league tendencies to give opportunities to different position roles, like WR1 and TE2. My research showed that relying on specific players’ touch tendencies created big misses whenever a team’s depth chart changed. Role-based tendencies still won’t be a perfect guide for teams whose depth charts change, in particular when they have major gains or losses of talent. That’s why this is the one area of my system that I’m allowing myself to make manual adjustments, which I anticipate will be needed predominantly at the start of seasons or following major injuries.
Most interesting thing: I’ve separated running back touches into three separate roles of early-down back, goal-line back, and third-down back. That will help elegantly redistribute workload projections when teams move from an every-down back to a committee of specialized players — like when the Cowboys lost Ezekiel Elliott to a suspension last year and gave his early-down touches to Alfred Morris and his third-down touches to Rod Smith — and vice versa.
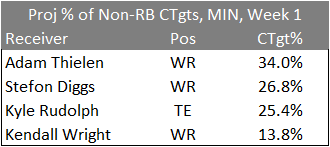
Fun with math: Adam Thielen projects to lead Minnesota wide receiver and tight ends with 34.0 percent of the team’s non-RB catchable targets.
Step 3: Project “true talent” player efficiencies
Similar to the team play projections, these project based on a two-year trail of yards per opportunity, touchdowns per opportunity, etc., that have been de-adjusted for the venue, weather, and defense. Where I can, I regress players’ efficiencies toward their efficiency projections I made based on their college statistics and combine data. When that fails, I rely on league averages.
Most interesting thing: I replace player touchdown per-touch rates with opportunity-adjusted touchdown per touch rates, which are based on research from former PFF Fantasy writer and current ESPN megastar Mike Clay. At the indication of my own research, I use opportunity-adjusted touchdowns as a full substitute for rushing touchdowns and average opportunity-adjusted touchdowns with actual receiving touchdowns. It seems that a receiver’s tendency to score in and near the end zone is more a product of his skill — by which, I probably mean size, quickness, and leaping ability — while a rusher’s tendency is more a product of luck.
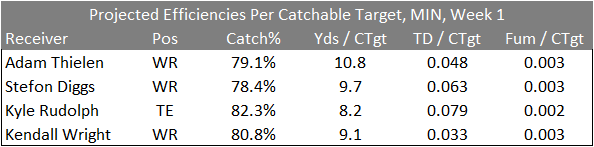
Fun with math: Thielen projects to catch 79.1 percent of his catchable targets and produce 10.8 yards, 0.048 touchdowns, and 0.003 fumbles on average on those opportunities.
Step 4: Multiply player carries and targets by their efficiencies
Once I have a player’s projected touches and also his projected efficiency per touch, I need only to multiply them together to fill out a full line of projected “true talent” statistics.
Most interesting thing: For quarterbacks and receivers, I split up their responsibilities at the point of a catchable target. I project the former’s tendencies to throw accurate passes to players at the various position-roles. Then, I project the latter’s rates of receptions, yards, touchdowns, and fumbles only on accurate throws. That way, whenever I need to project a quarterback throwing to a new stable of receivers or a receiver catching passes from a new quarterback, I can do it without the influence of the skill of his previous teammates.
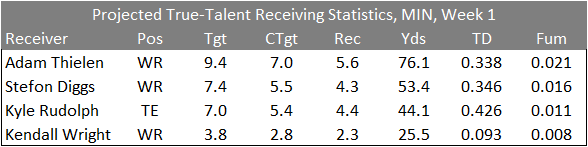
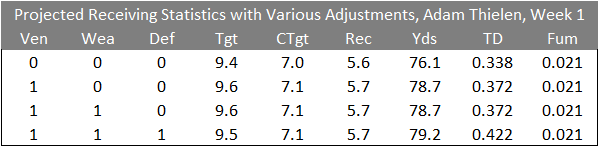
Fun with math: In Week 1, Thielen projects to catch 5.6 passes for 76.1 yards, 0.338 touchdowns, and 0.021 fumbles on 9.4 targets, 7.0 of which are catchable.
Step 5: Adjust projections for the venue, weather forecast, and defensive opponent
“True talent” statistics are a useful perspective of how a player is likely to perform over the rest of a full season, but for a single game in question, they can miss the mark significantly if some or all of the venue, weather, and defense they face show extreme tendencies. The adjustments I make here move in the opposite direction as those I made in Steps 1 and 3 to estimate context-neutral historical performances.
Most interesting thing: The multipliers I apply to the projections for one player in one game are the same as those I would apply to another player at his position if he landed in the same context, with a few notable exceptions. There are a handful of quarterbacks who have, over an extended sample of games, shown atypically large home/road splits. You can probably guess that one of them is Ben Roethlisberger, but he’s not the only one. Drew Brees, Joe Flacco, Eli Manning, and Aaron Rodgers all also play better at home than you would expect simply because of home field, even if you include considerations like the fact that Brees plays in a dome. And, interestingly, Andy Dalton plays relatively worse at home and better on the road. For their teams’ passing statistics, I make additional adjustments to account for those quarterback tendencies.
Fun with math: Thielen is projected to gain 0.1 extra receptions, 3.1 extra yards and 0.084 extra touchdowns because he plays at home against San Francisco in Week 1.
Step 6: Convert projections to rankings
The projection piece is the hard one. Once they are in place, rankings are mostly just a sort. That said, I put a little more into this. For one, I separately rank players by position, overall, as a flex option, and as a superflex option, and the math for each is subtly different. I subtract 15.0 points for quarterbacks, 10.0 points for running backs and wide receivers, and 7.5 points for tight ends as a proxy for the replacement level to create overall rankings. In contrast, flex and superflex rankings do not require positional replacement estimates since players at different positions can be substituted into the same spot in the lineup.
Most interesting thing: I run the full set of rankings for players without any adjustment for venue, weather, and defense and then adding each adjustment one at a time. That way, I can show you exactly how I expect the various contextual factors of a game to influence a player’s numbers. That should in turn help you make the best decisions on which players to start and sit, in particular if you can play off of pre-existing notions of how a player performs under typical circumstances.
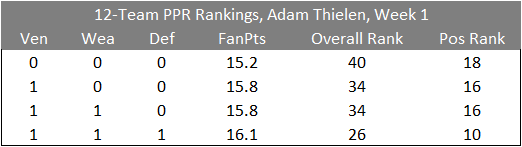
Fun with math: Thielen’s fantasy ranking jumps from 40th overall and 18th among wide receivers to 26th overall and 10th among wide receivers because of his advantageous matchup in Week 1.
Be sure to check out all of my rankings when the weekly rankings tool launches in the coming weeks.
