The research from my previous article showed that offenses retain some consistency in their pass and run plays per game from year to year if either of their head coach or primary quarterback returns to the team. That concept helped me build a framework to project offensive plays, but I knew that framework would also need to account for the defense an offense was scheduled to face. After all, defensive teams show a moderate consistency in their snaps allowed from year to year, even if that consistency is weaker than those of the offensive actors.
I tried a variety of approaches to account for defensive pace, and pretty much all of them improved the accuracy of snap projections as compared to those based solely on offensive tendencies. Still, none of those efforts felt right to me because a weighting approach does not disentangle the influences of offenses and defenses on each other.
That reticence is best explained with a hypothetical. Pretend that the Titans allowed an average of 70 plays per game. Since that is more than an average team, one could assume the Titans allowed more plays because of the quality of their offensive and defensive talent, play style, etc. That might be true, but what if the Titans also happened to play a schedule full of teams with offenses that typically ran more plays than average? The Titans may have encouraged opposing teams to run more plays against them, but an unfavorable schedule might have just made it look that way. That means that any snap projection that relies on the Titans’ 70 allowed plays per game would be susceptible to schedule-based inaccuracies.
That presentation of the issue at hand tickled the baseball part of my brain, and I realized that sabermetricians had famously solved the problem I was facing in another context. I’m talking about park factors. Baseball stadiums are non-uniform. Some have weird outfield walls like the Green Monster in Fenway Park. Some have a ton of foul territory, and some have difficult sight lines for the hitter to pick up pitch rotation. All of those factors combine to make it easier or harder for hitters to do things like hit home runs. That means that a hitter who hit 40 home runs for the Yankees and a hitter who hit 40 home runs for the Padres could have very different “true” power and could be expected to perform differently if each was traded to the Cubs.
Teams have become able to estimate player “true” power by way of park factors, which adjust player statistics based on the tendencies of home and road teams both in a certain park and away from it. If you’re curious how the math for those works, FanGraphs has a more thorough explanation.
For the purposes of football play projections, I applied a similar logic as park factors but substituted defensive teams for parks. So rather than calculate that the Titans allowed 70, 72, 68, etc. plays over the course of their season, I calculated that the Titans allowed 5 more plays than their first opponent averaged, 2 plays fewer than their second opponent averaged, etc. Then, as with park factors, I presented the summary as a number around 100 where 110 represents 10 percent more plays allowed than average and 90 represents 10 percent fewer plays allowed than average.
Before I show a couple of examples, I’ll caution that these defensive play factors capture more than you would likely first expect. A team with a good pass defense might carry a low pass play factor (e.g. 90), but it might not if that team also tends to build leads and force its opponents to pass the ball more to catch up. To really evaluate a defense, one would also need factors for their allowed efficiencies, i.e. their yards and touchdowns allowed and turnovers forced per play. I’ll get to those eventually.
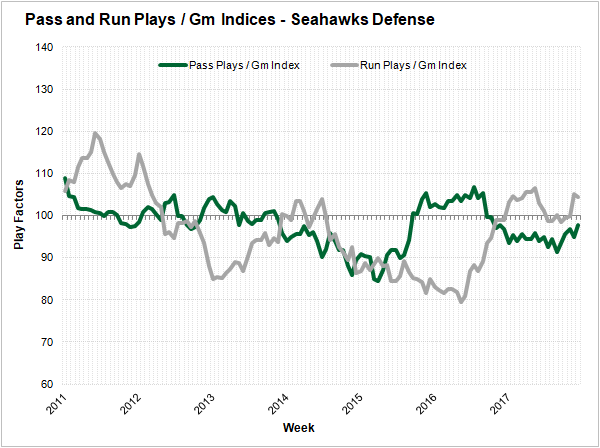
The Seahawks drafted each of Russell Wilson, Bobby Wagner, K.J. Wright, Earl Thomas, Kam Chancellor, Richard Sherman, and Brandon Browner in the 2011 and 2012 drafts. That’s how you transform a defense, and you can see that roster makeover kicked off a four-year run of both pass- and run-play handicaps for their opponents. It’s rare to see a team with that level of consistent defensive success. More commonly, the consistent teams are the ones who consistently hemorrhage plays, like the Browns.
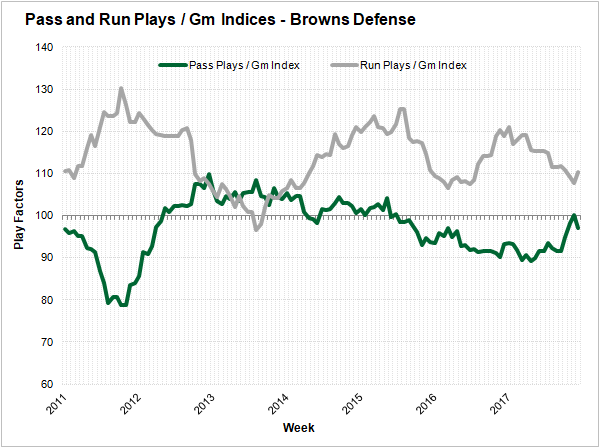
In particular, the Browns have almost universally allowed more run plays per game than an average team over the last decade. Bad teams tend to do that because their opponents build leads and then rely on their running game to kill clock.
With defensive snap factors calculated, I could then apply them as multipliers to the snap projections based on the recent tendencies of offensive teams. As expected, those defensive factors improved the quality of the snap projections, as shown in the decrease in root mean square error — for which lower numbers are better.
| Snaps Projection Root Mean Square Errors | ||
| Method | Pass Plays | Run Plays |
| Offense Only | 8.26 | 7.57 |
| With Def PPG Factors | 8.23 | 7.48 |
That’s not quite the end of things, since a host of other factors like venue and weather influence a team’s offensive snaps. Fortunately, I performed the bulk of that research in my factors series last fall. I need only to incorporate it.
