(Metrics that Matter is a regular offseason feature that examines some aspect of fantasy through a microscope to dive into the finer details.)
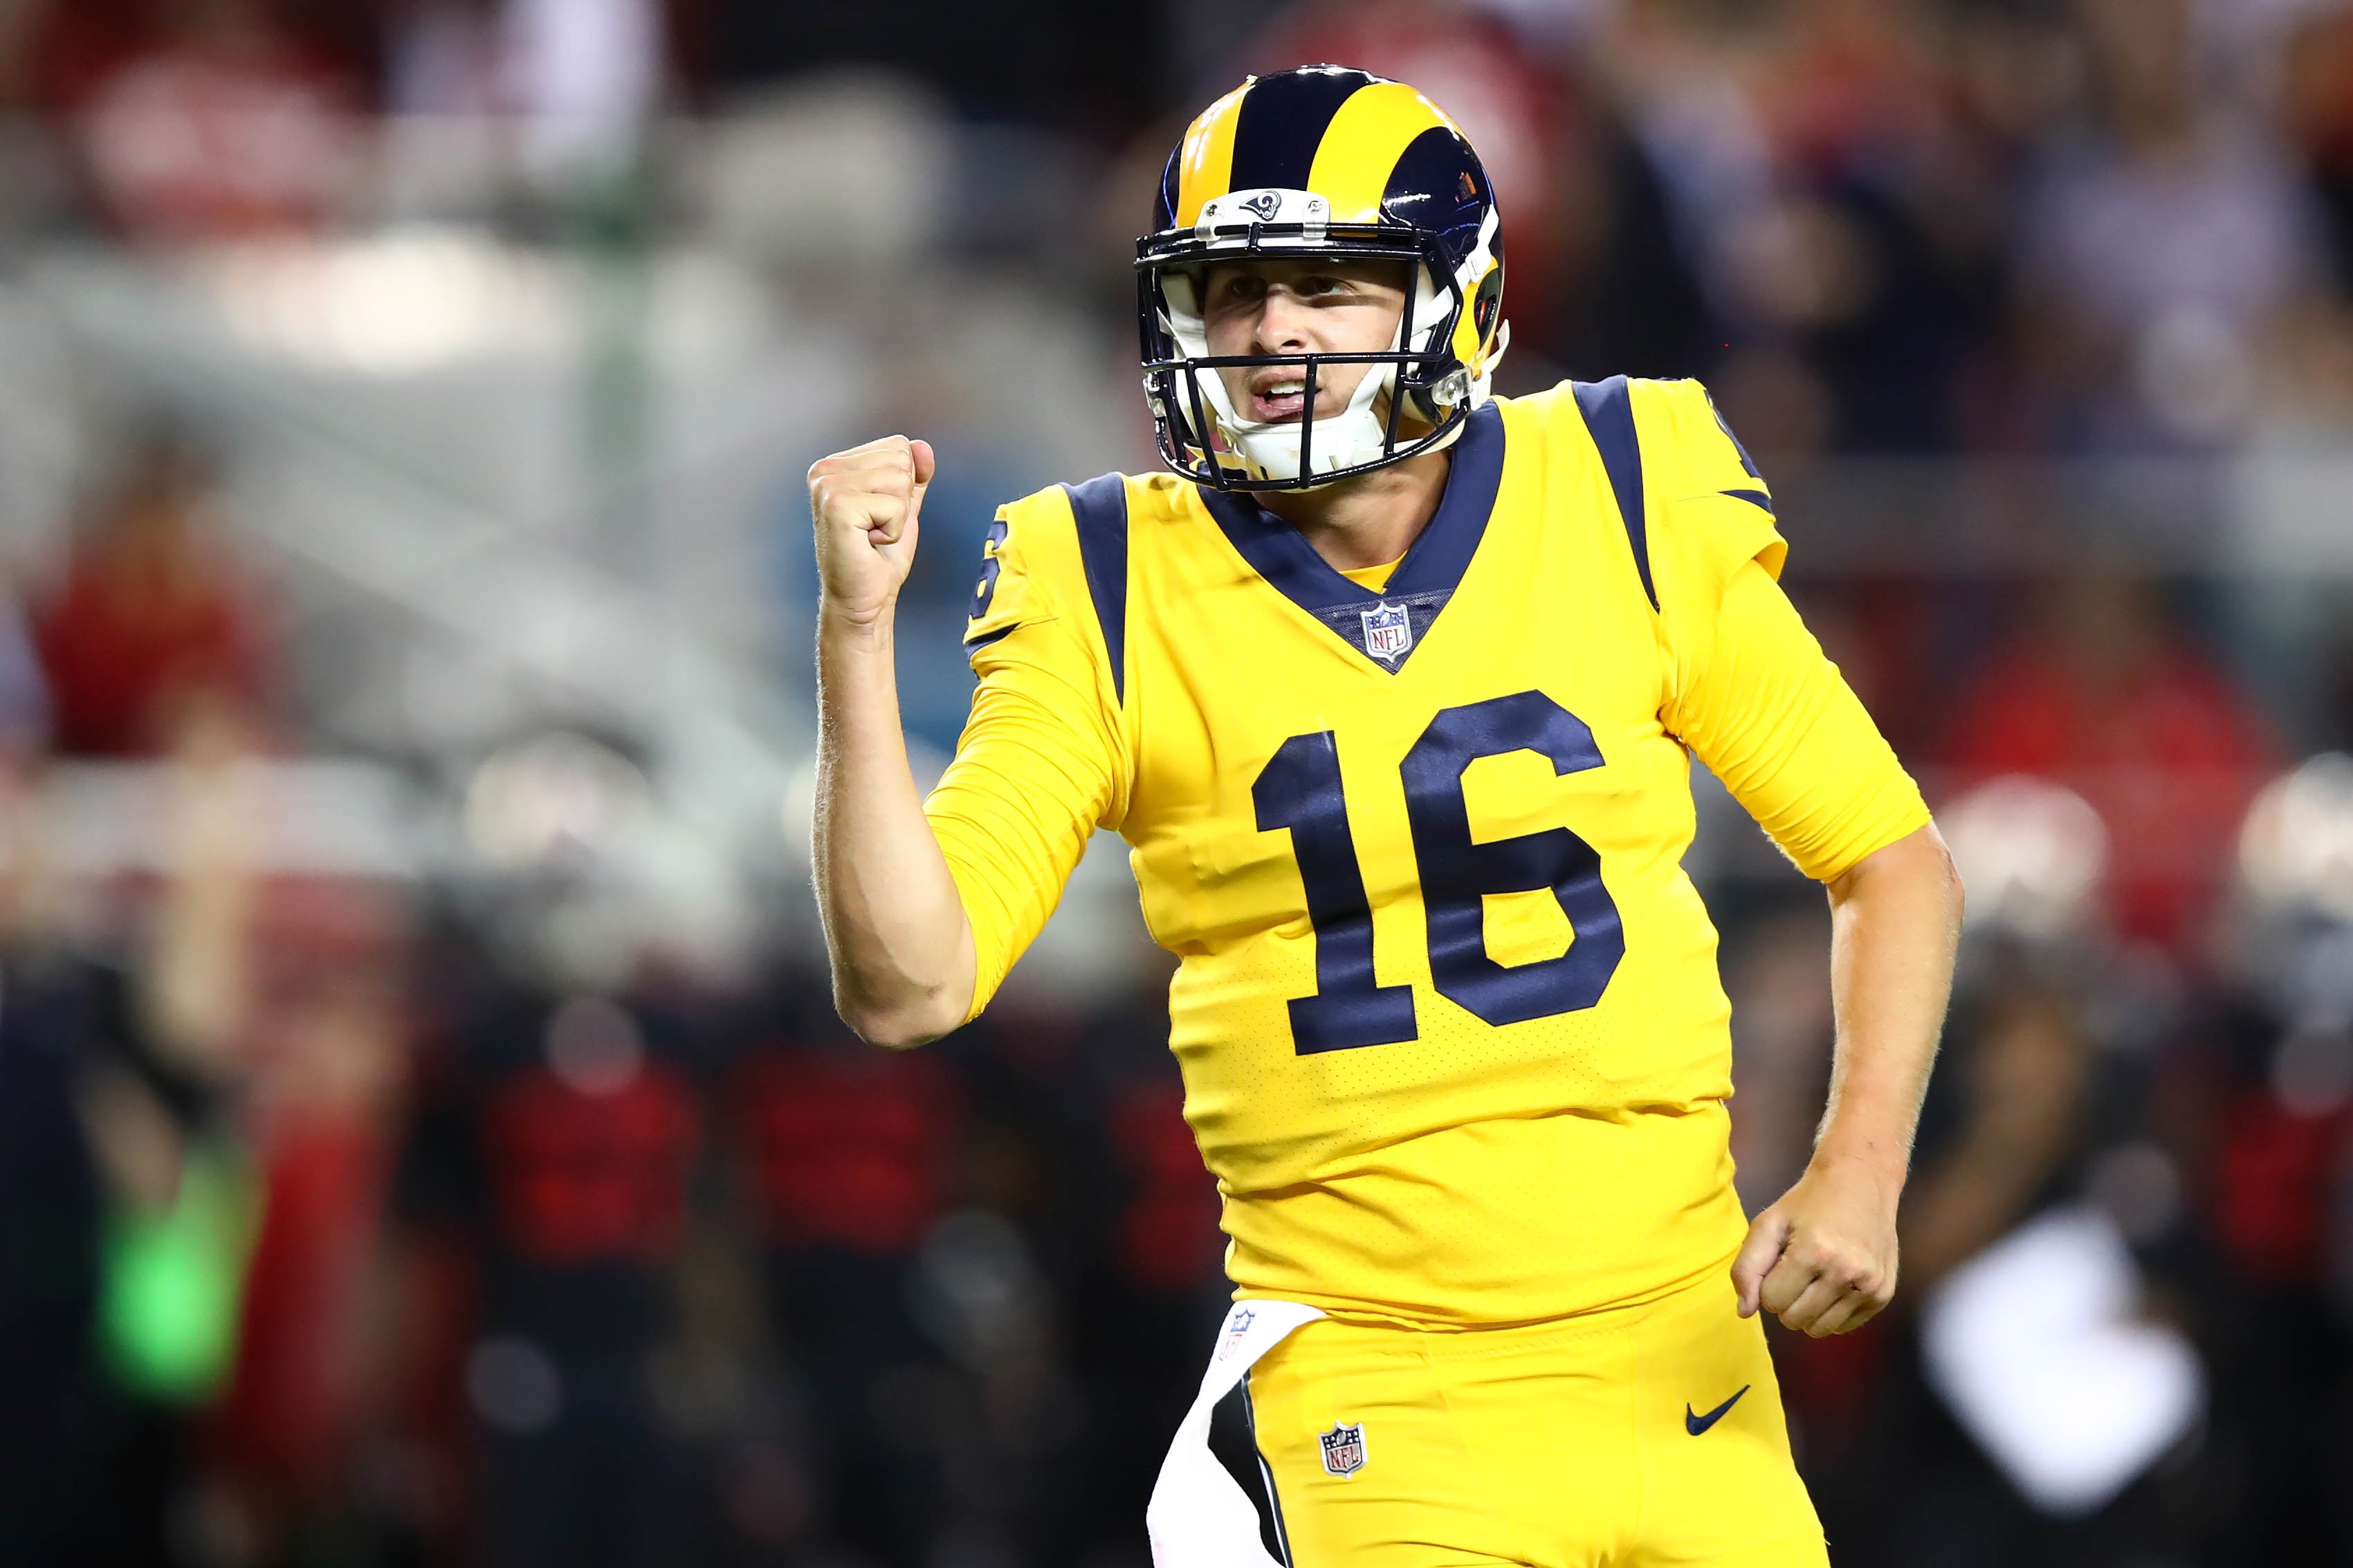
The Los Angeles Rams just executed an unparalleled offensive turnaround. The Rams went from worst in points per game under Jeff Fisher in 2016 (14.0) to first under Sean McVay (29.9). In 2016, Todd Gurley averaged 3.18 yards per carry, the fifth-worst rate among all instances of a running back totaling at least 275 carries in a single season. In 2017 Gurley won AP’s Offensive Player of the Year Award. In 2016, Jared Goff averaged 2.82 adjusted net yards per pass attempt, which was the second-lowest rate by any quarterback this past decade. In 2017, he led the league by the same metric.
From a fantasy perspective, Goff was 35th of 36 qualified quarterbacks in fantasy points per game in 2016, then 11th of 40 in 2017. Gurley went from 24th (of 77) to first (of 79) by a wide margin.
This was an impressive turnaround and McVay deserves a ton of the credit — while Fisher might be deserving of even more blame — but there were a few other extenuating circumstances that aided in Los Angeles’ offensive turnaround. Focusing specifically on the passing game, we can point to the offseason acquisitions of Sammy Watkins, Robert Woods, and Cooper Kupp, as well as an expanded passing-down role for Gurley. Perhaps an even bigger free agency signing was in left tackle Andrew Whitworth, who in 2017 graded out as one of our top-five left tackles for the fourth consecutive season. He replaced Greg Robinson, who was our third-worst-graded left tackle in 2016.
Each year I like to go back and spend some time analyzing my biggest “hits” and “misses” from the previous season. I was much higher on Watkins than Woods, which turned out to bite me, but I’m not really faulting myself for having Watkins ranked higher when he outscored Woods by 98 fantasy points in six fewer games during their time together in Buffalo. I was far too low on Gurley, but higher than most, citing McVay’s desire to use him more in the passing game in 2017. Goff, however, I had ranked as one of my lowest quarterbacks, and I was dead wrong. McVay whispering sweet nothings audibles into his ears pre-snap surely helped, but one reason for the jump in production was probably one I should have seen coming.
My data suggest that Goff’s offensive line play in 2016 was the worst of any quarterback that year and the worst for any quarterback in the six seasons prior. In 2017, it was well above average.
In the case of Goff and his fantasy resurgence, many had written off Goff as a bust given his woeful efficiency numbers and production in his rookie year, but much of this can be explained by historically poor offensive line play. As for who helped Goff most in lifting him into the QB1 tier for fantasy, I’m not sure. Part of it what Sean McVay (likely most of it), part of it was the upgraded receiving corps, part of it was Gurley’s improved play, and part of it was the improved offensive line play. Luckily for Goff, all of the pieces should be in place again in 2018, with the lone exception being (possibly) Watkins. Of course his high efficiency numbers (especially in relation to 2016) scream regression, but (especially after everything we’ve uncovered here) I’m optimistic he returns to QB1 status in 2018, ranking him 11th overall at the position.
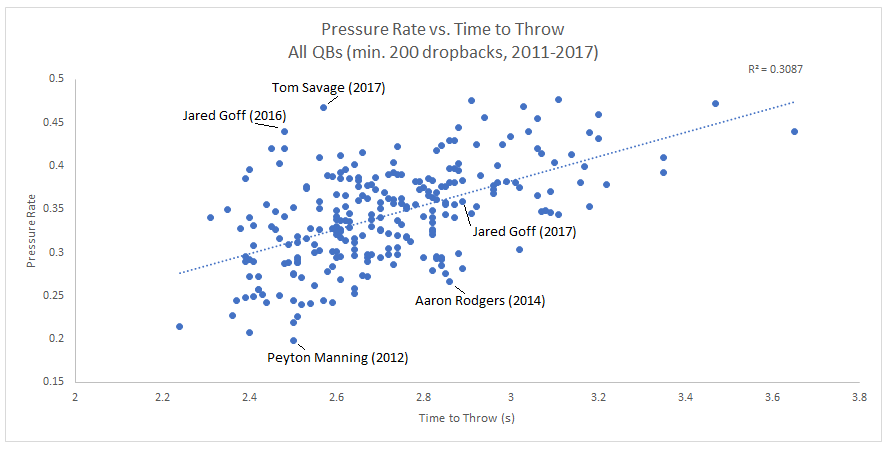
We can measure pass blocking in myriad ways (pass-blocking grade per dropback or our pass-blocking effiency metric), but my preferred method (and not an original concept) is by contrasting a quarterback’s pressure rate with their average time to throw. (All of these metrics are now available to subscribers.) In the below chart, where the y-axis is a quarterback’s pressure rate (pressures per dropback) and the x-axis is his average time to throw (in seconds), the more upper-left a quarterback landed, the worst their offensive line play was in that season. This chart looks at all quarterbacks with at least 200 dropbacks in a single season since 2011.
Beyond this, I developed an expected pressure rate (by time to throw) and contrasted that with a quarterback’s actual pressure rate, to find who had the best and worst seasons within our sample.
Goff’s 2016 pressure rate over expectation fell behind only Tom Savage’s 2017, while Peyton Manning’s 2012 was best in our sample, followed by Aaron Rodgers’ 2014.
It’s no surprise Manning’s 2012 and Rodgers’ 2014 were two of the greatest quarterback seasons ever, let alone within our sample. Over the past decade, the average passer rating when pressured is 73.3, while, on average, the passer rating from a clean pocket is 98.5. Although Denver led the league in team pass-block grade in 2012, Manning likely deserves some individual credit. He has a career 0.032 sack-to-attempt ratio, which is the best of any quarterback since the NFL merger (1970). While he was never a particularly mobile quarterback (to say the least), his ability to read, react, and adjust at the line of scrimmage is unparalleled. McVay certainly helped Goff in this regard last season, as alluded to earlier.
It’s also no surprise Savage ranked so poorly. Houston ranked last in team pass-block grade in 2017, and was especially bad when Duane Brown was out of the lineup. Like with Manning, Savage also deserves some of the credit/blame, likely bringing some of these pressures on himself. Early last season, Evan Silva called Savage a “statuesque pocket sloth” and nothing could be more apt or hilarious.
Looking at our expected pressure rate vs. actual, here are the quarterbacks who benefited/suffered from the best/worst offensive line play. We might be able to project some natural regression at the extremes, but I think its greatest utility is in projecting positive or negative regression depending on who your team signs in free agency or the draft. With some exceptions (Flacco and Mariota on the best, Watson on the worst), these lists show the importance of offensive line production on fantasy numbers. This offseason, when you see teams making strides to improve their line, you can expect it to help their running backs, but don't forget the improvement to the quarterbacks as well.
Best
1. Drew Brees, New Orleans Saints
2. Marcus Mariota, Tennessee Titans
3. Joe Flacco, Baltimore Ravens
4. Ben Roethlisberger, Pittsburgh Steelers
5. Cam Newton, Carolina Panthers
Worst
1. Tom Savage, Houston Texans
2. Carson Palmer, Arizona Cardinals
3. Deshaun Watson, Houston Texans
4. Josh McCown, New York Jets
5. C.J. Beathard, San Francisco 49ers
