Formulas like rushing yards over expected (RYOE), completion percentage over expected (CPOE) and expected points added (EPA) can all be effective tools to evaluate individual player performance in real life and for fantasy football. But can we do something similar for individual defensive players?
Many IDP fantasy football managers rely heavily on players’ production numbers from the season prior, which is one of the bigger missteps you can make going from one season to the next. Not only are many of the box score numbers not repeatable, but they are often much more indicative of health, playing time, specific role/alignments and various other unstable factors.
In order to better evaluate how a player truly performed in a season, let's try to determine how a player performed relative to the positional average. In order to do this, I created an IDP production vs. expected model that considers snaps, alignments, role, etc., so we can consider the opportunity each player had to put up production.
This formula will allow all the player specifics to be factored in and make a much more accurate one-to-one comparison. For example, the safety position’s tackle efficiency can be skewed by comparing a player who lined up primarily in the box against a player that lined up primarily deep. They’re generally going to have much different efficiency numbers, but comparing them to the average by factoring in all of those alignments and roles makes for a much more accurate evaluation.
Linebacker snaps and volume are a huge indicator of success
The player who inspired this concept is Cowboys’ rookie linebacker Micah Parsons, who had an exceptionally low tackle efficiency rate (8.23%) that came in over 4 percentage points below average (12.98%) for his position. The first question that came to mind was whether this below-average number was an accurate representation of what he was asked to do in 2021. Parsons spent over 300 of his 902 defensive snaps rushing the passer, which severely limits his tackle opportunities.
It's not fair to compare his tackle efficiency to someone like Denzel Perryman, who only rushed the passer nine times in 2021 and racked up a ton of tackles from a much more orthodox linebacker alignment. Using average tackle efficiency for linebackers in 2021 would put Parsons at 117 tackles — well above his 61 solo and nine assisted. With this formula, the expected number becomes adjusted based on what he was asked to do on every snap.
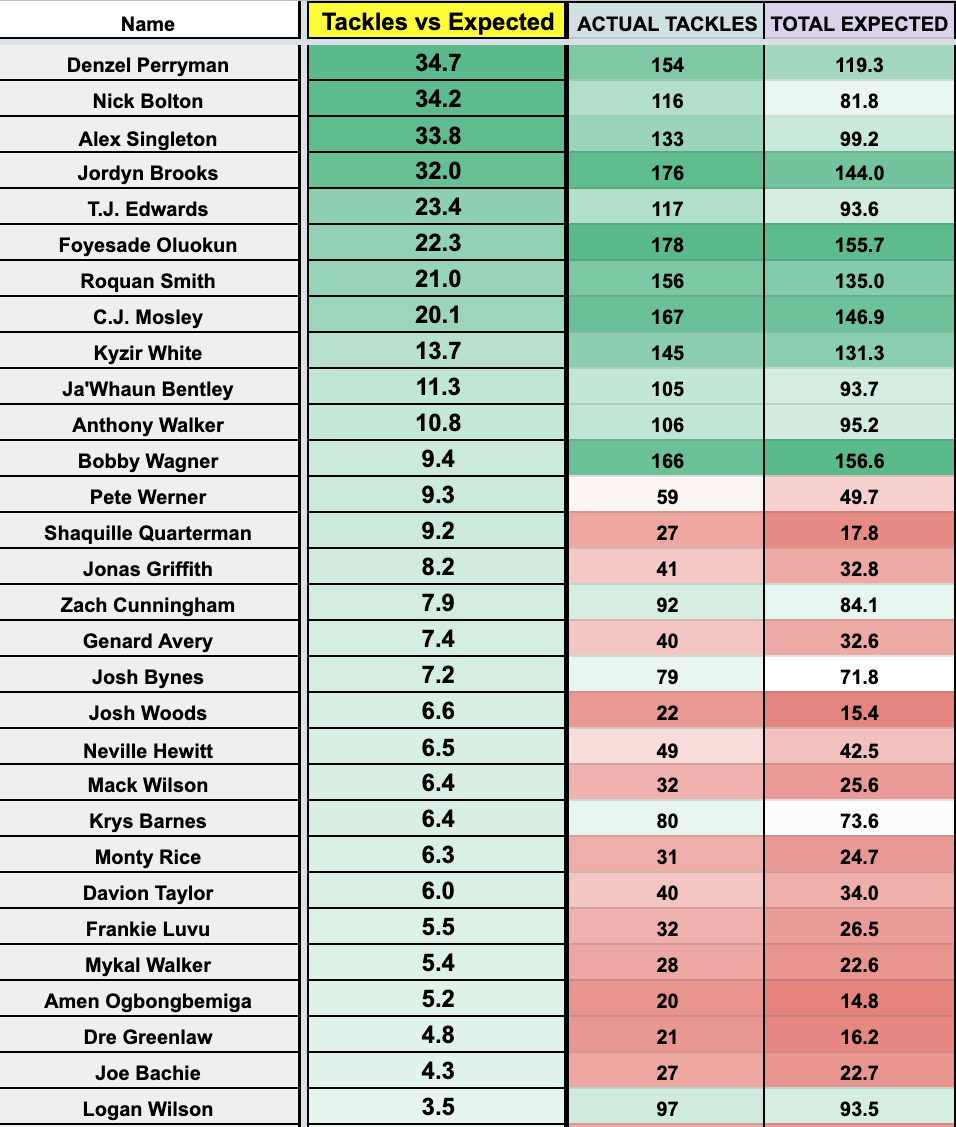
The linebacker tackle production vs. expected numbers evens the playing field a bit more by pulling the average tackle efficiency from each defensive alignment for every player, and then breaking that down to their role on that play (pass-rush, coverage, run defender). This creates a more accurate “expected” number. Here’s what it looks like with all of these considerations:
And those on the lower end of the spectrum:
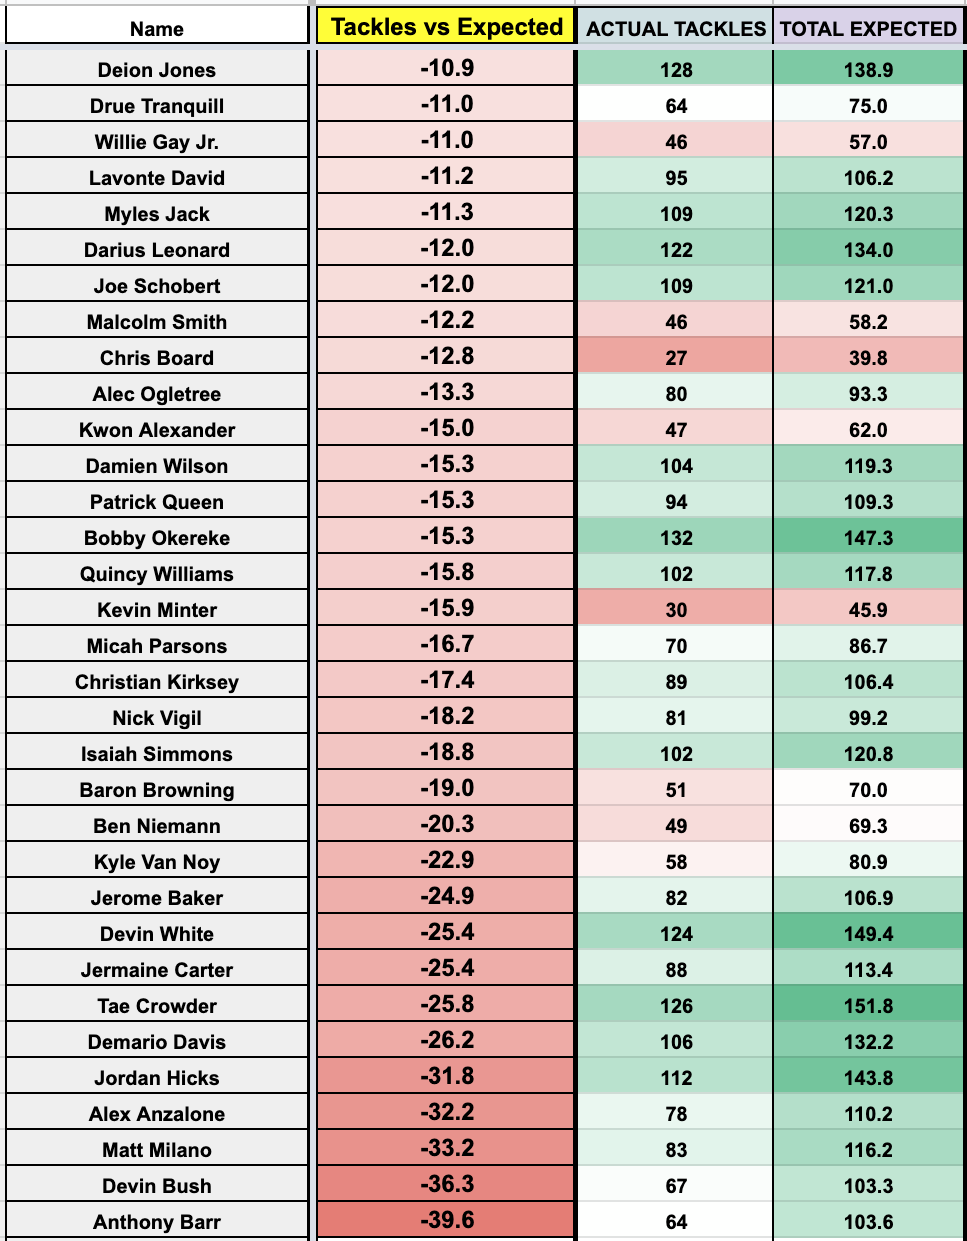
As you can see, Perryman greatly over-performed his expectations as a tackler in 2021, while Parsons still under-performed as a tackler even after factoring in all his man coverage and pass-rush snaps.
Another example: Bobby Okereke managed 132 total tackles in 2021, so IDP managers might think he had a great season. But that total could have been even better (147.3) given the number of snaps he played and the beneficial scheme, among other factors. The question going forward is whether or not this is an accurate portrayal of each player or if we can expect a form of positive or negative regression for players on the extreme ends of the spectrum.
My first instinct is that there will be a closer annual correlation between players at the bottom of the list of linebackers than those at the top, but we’ll revisit after the 2022 season concludes.
Summary: Whether these numbers are going to be indicative of future performances remains to be seen. For now, this should serve more as a way to provide a clearer picture of how a player actually performed relative to what was expected of them given their season as a whole. At the linebacker position, snap volume is far and away the greatest indicator of success, so pinpointing which of those players did the most/least with their opportunities can prove helpful in IDP evaluations.
Safeties also rely heavily on volume and alignment for production
The top safety producers over expected, based on what they were asked to do in 2021:
