PFF continuously strives to improve its data and processes, whether it's through improving the grading methodology, expanding the scope of the data collected or utilizing one-of-a-kind statistics to create even more intuitive metrics and models.
This year, we have developed three new metrics so that we can continue to dive deeper into the analytical realm of college and NFL football. So with that, now is a good time to explain some of the changes and the methodology behind them.
Click here for more PFF tools:
Rankings & Projections | WR/CB Matchup Chart | NFL & NCAA Betting Dashboards | NFL Player Props tool | NFL & NCAA Power Rankings
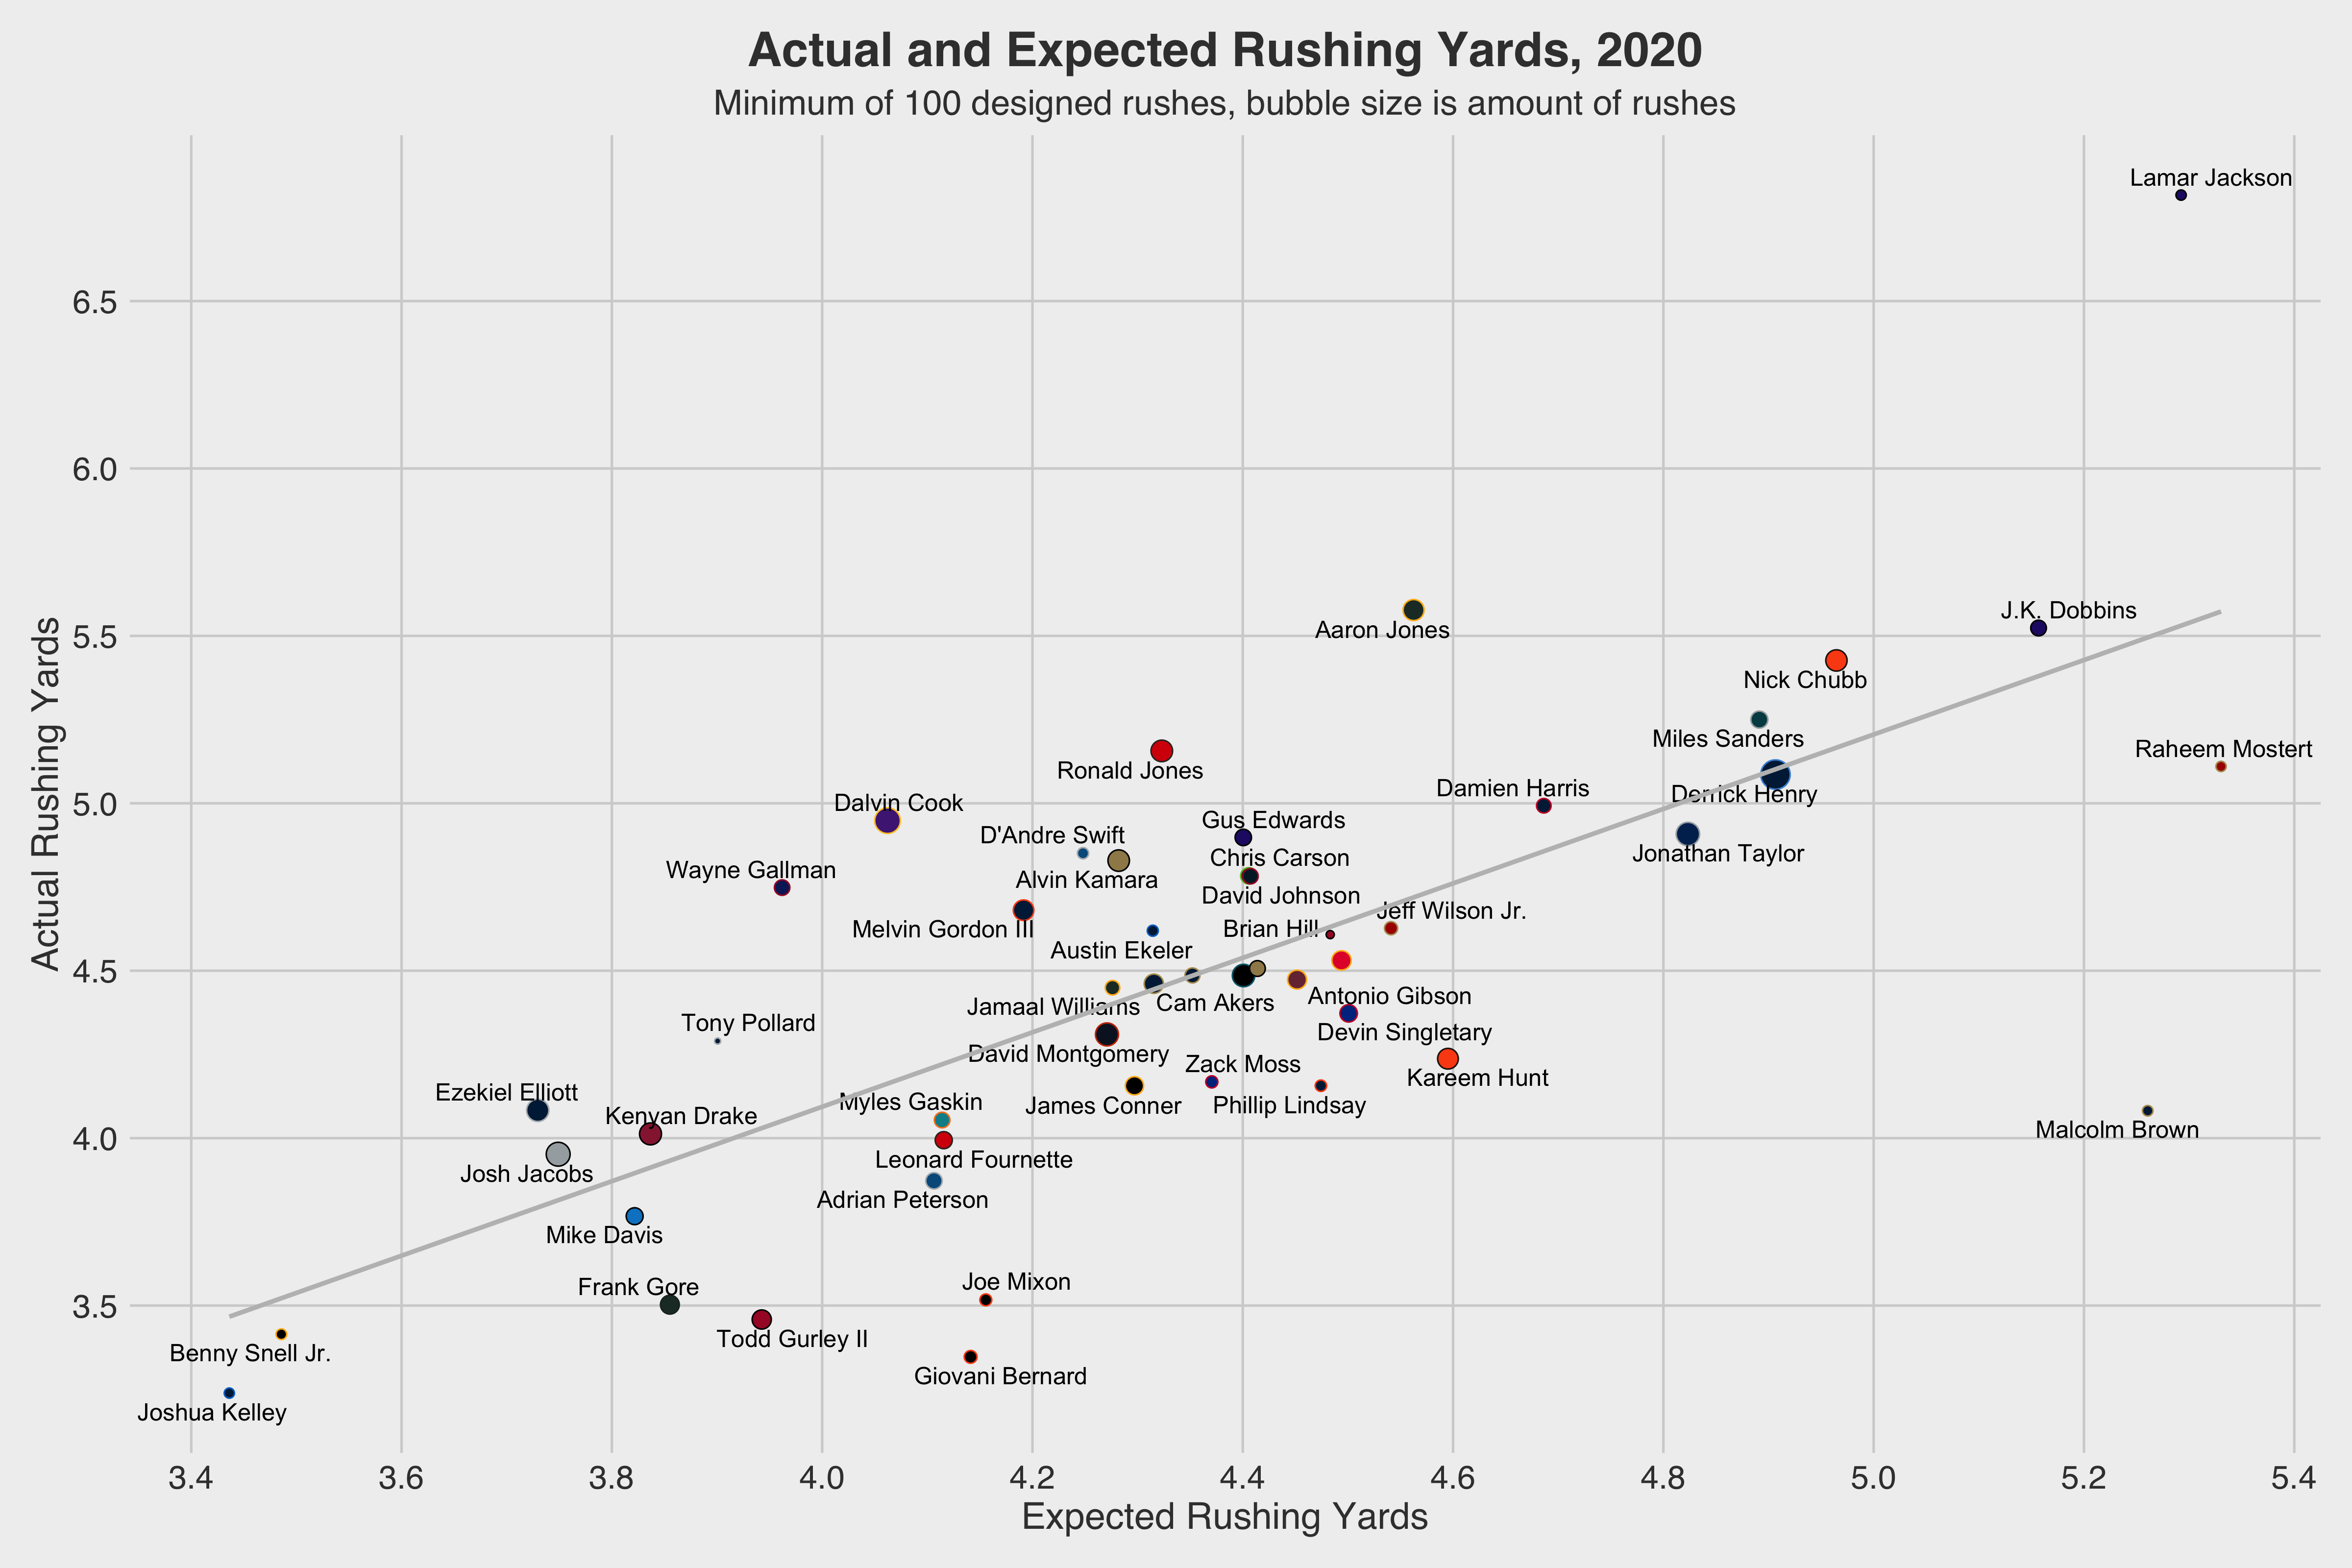
Rushing Yards Over Expected (RYOE)
Short Description
RYOE uses down, distance, yard line, defensive alignment and offensive line grades to determine the number of yards an average running back would gain in a given situation.
Long Description
Rushing yards over expected was created using an extreme gradient boosting model (XGBoost). The most important factor in determining expected rushing yards is the number of graded and negatively graded blocks on a play. The importance is followed by yards from the end zone, defensive strength, seconds left in the half and score differential.
This model can predict 22% of the variance in actual rushing yards and has a year-to-year correlation of 0.21. A shiny app to explore RYOE for each player can be found here.
Example
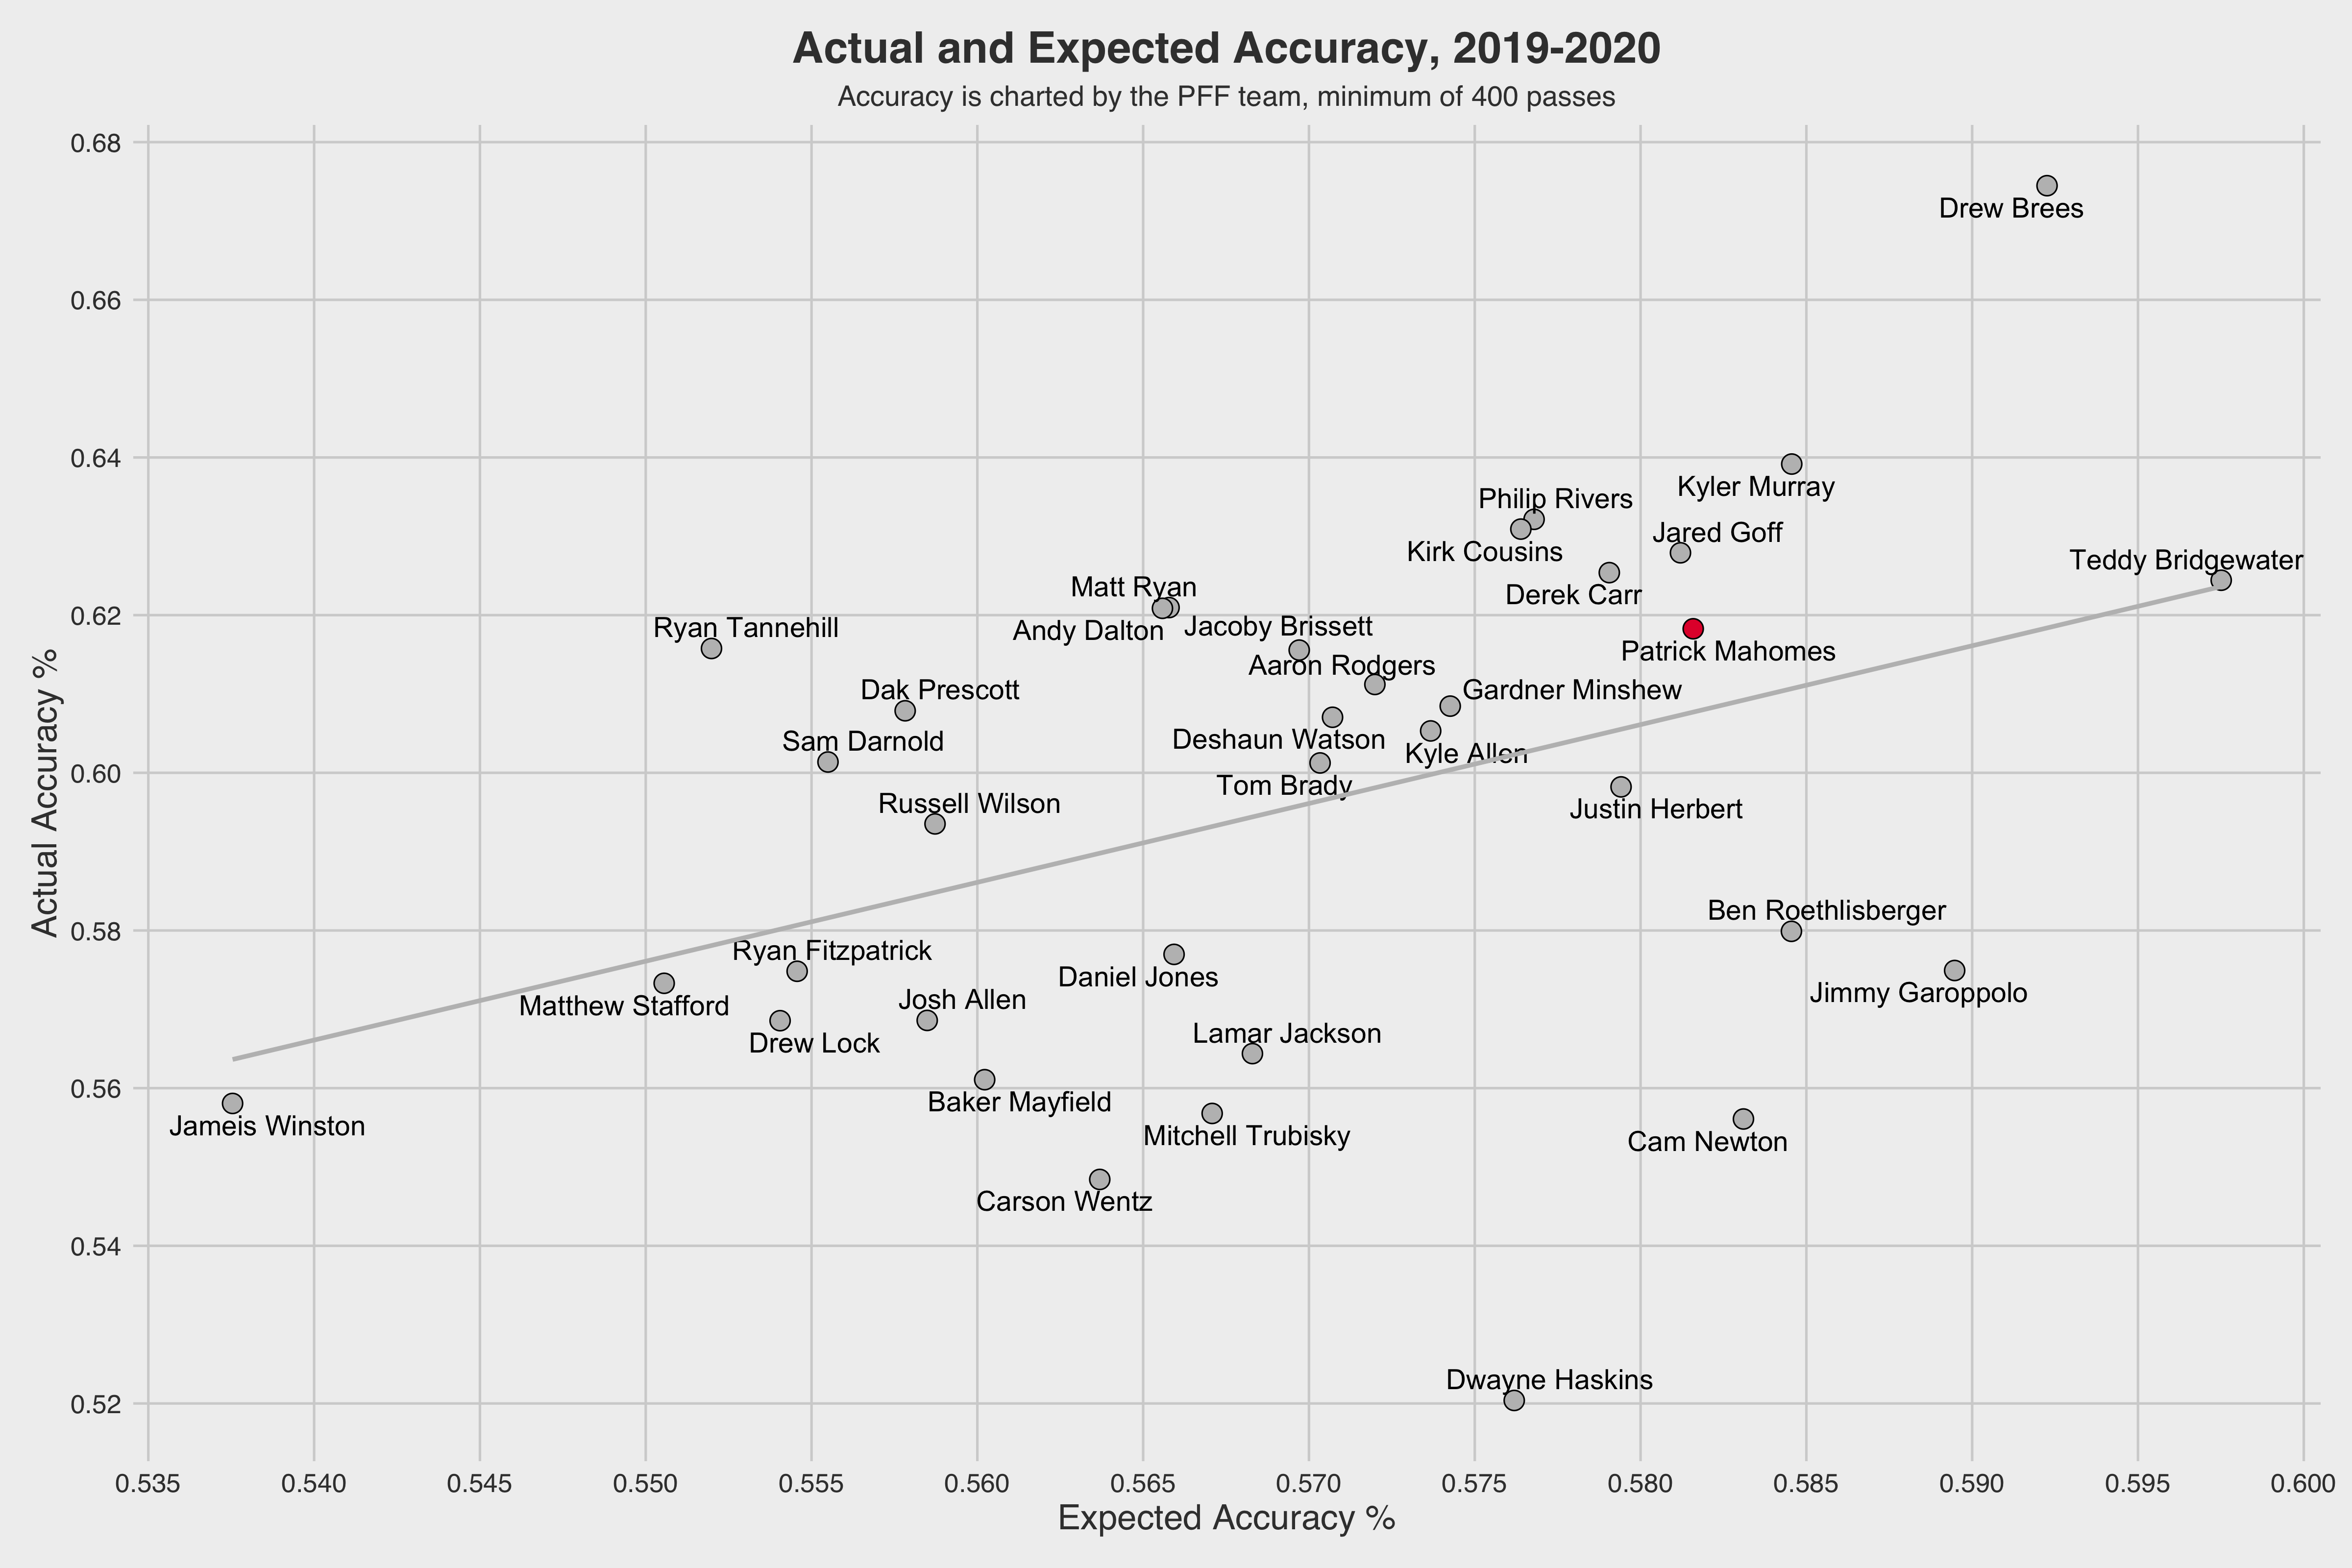
Accuracy Rate Over Expected (AROE)
Short Description
Accuracy is an important part of quarterback play, and PFF currently charts ball placement as a part of its grading process. However, it’s easier to be accurate when the pass is shorter and the receiver is open, so AROE adjusts for that to give an expected accuracy rate for an average quarterback, given the circumstances.
Long Description
Accuracy rate over expected was again created using an extreme gradient boosting model. The most important factor for determining expected accuracy was the pass depth, as passes with fewer air yards are usually more accurate. Another factor is the standard of coverage, which ranges from the receiver being “wide open” to the coverage being “tight.” Using AROE is more predictive than completion percentage over expected (CPOE), as it doesn’t need the receiver to complete their side of the pass. The quarterback just has to be accurate. We recently used this particular metric to analyze Patrick Mahomes' improvement in this area.
Example
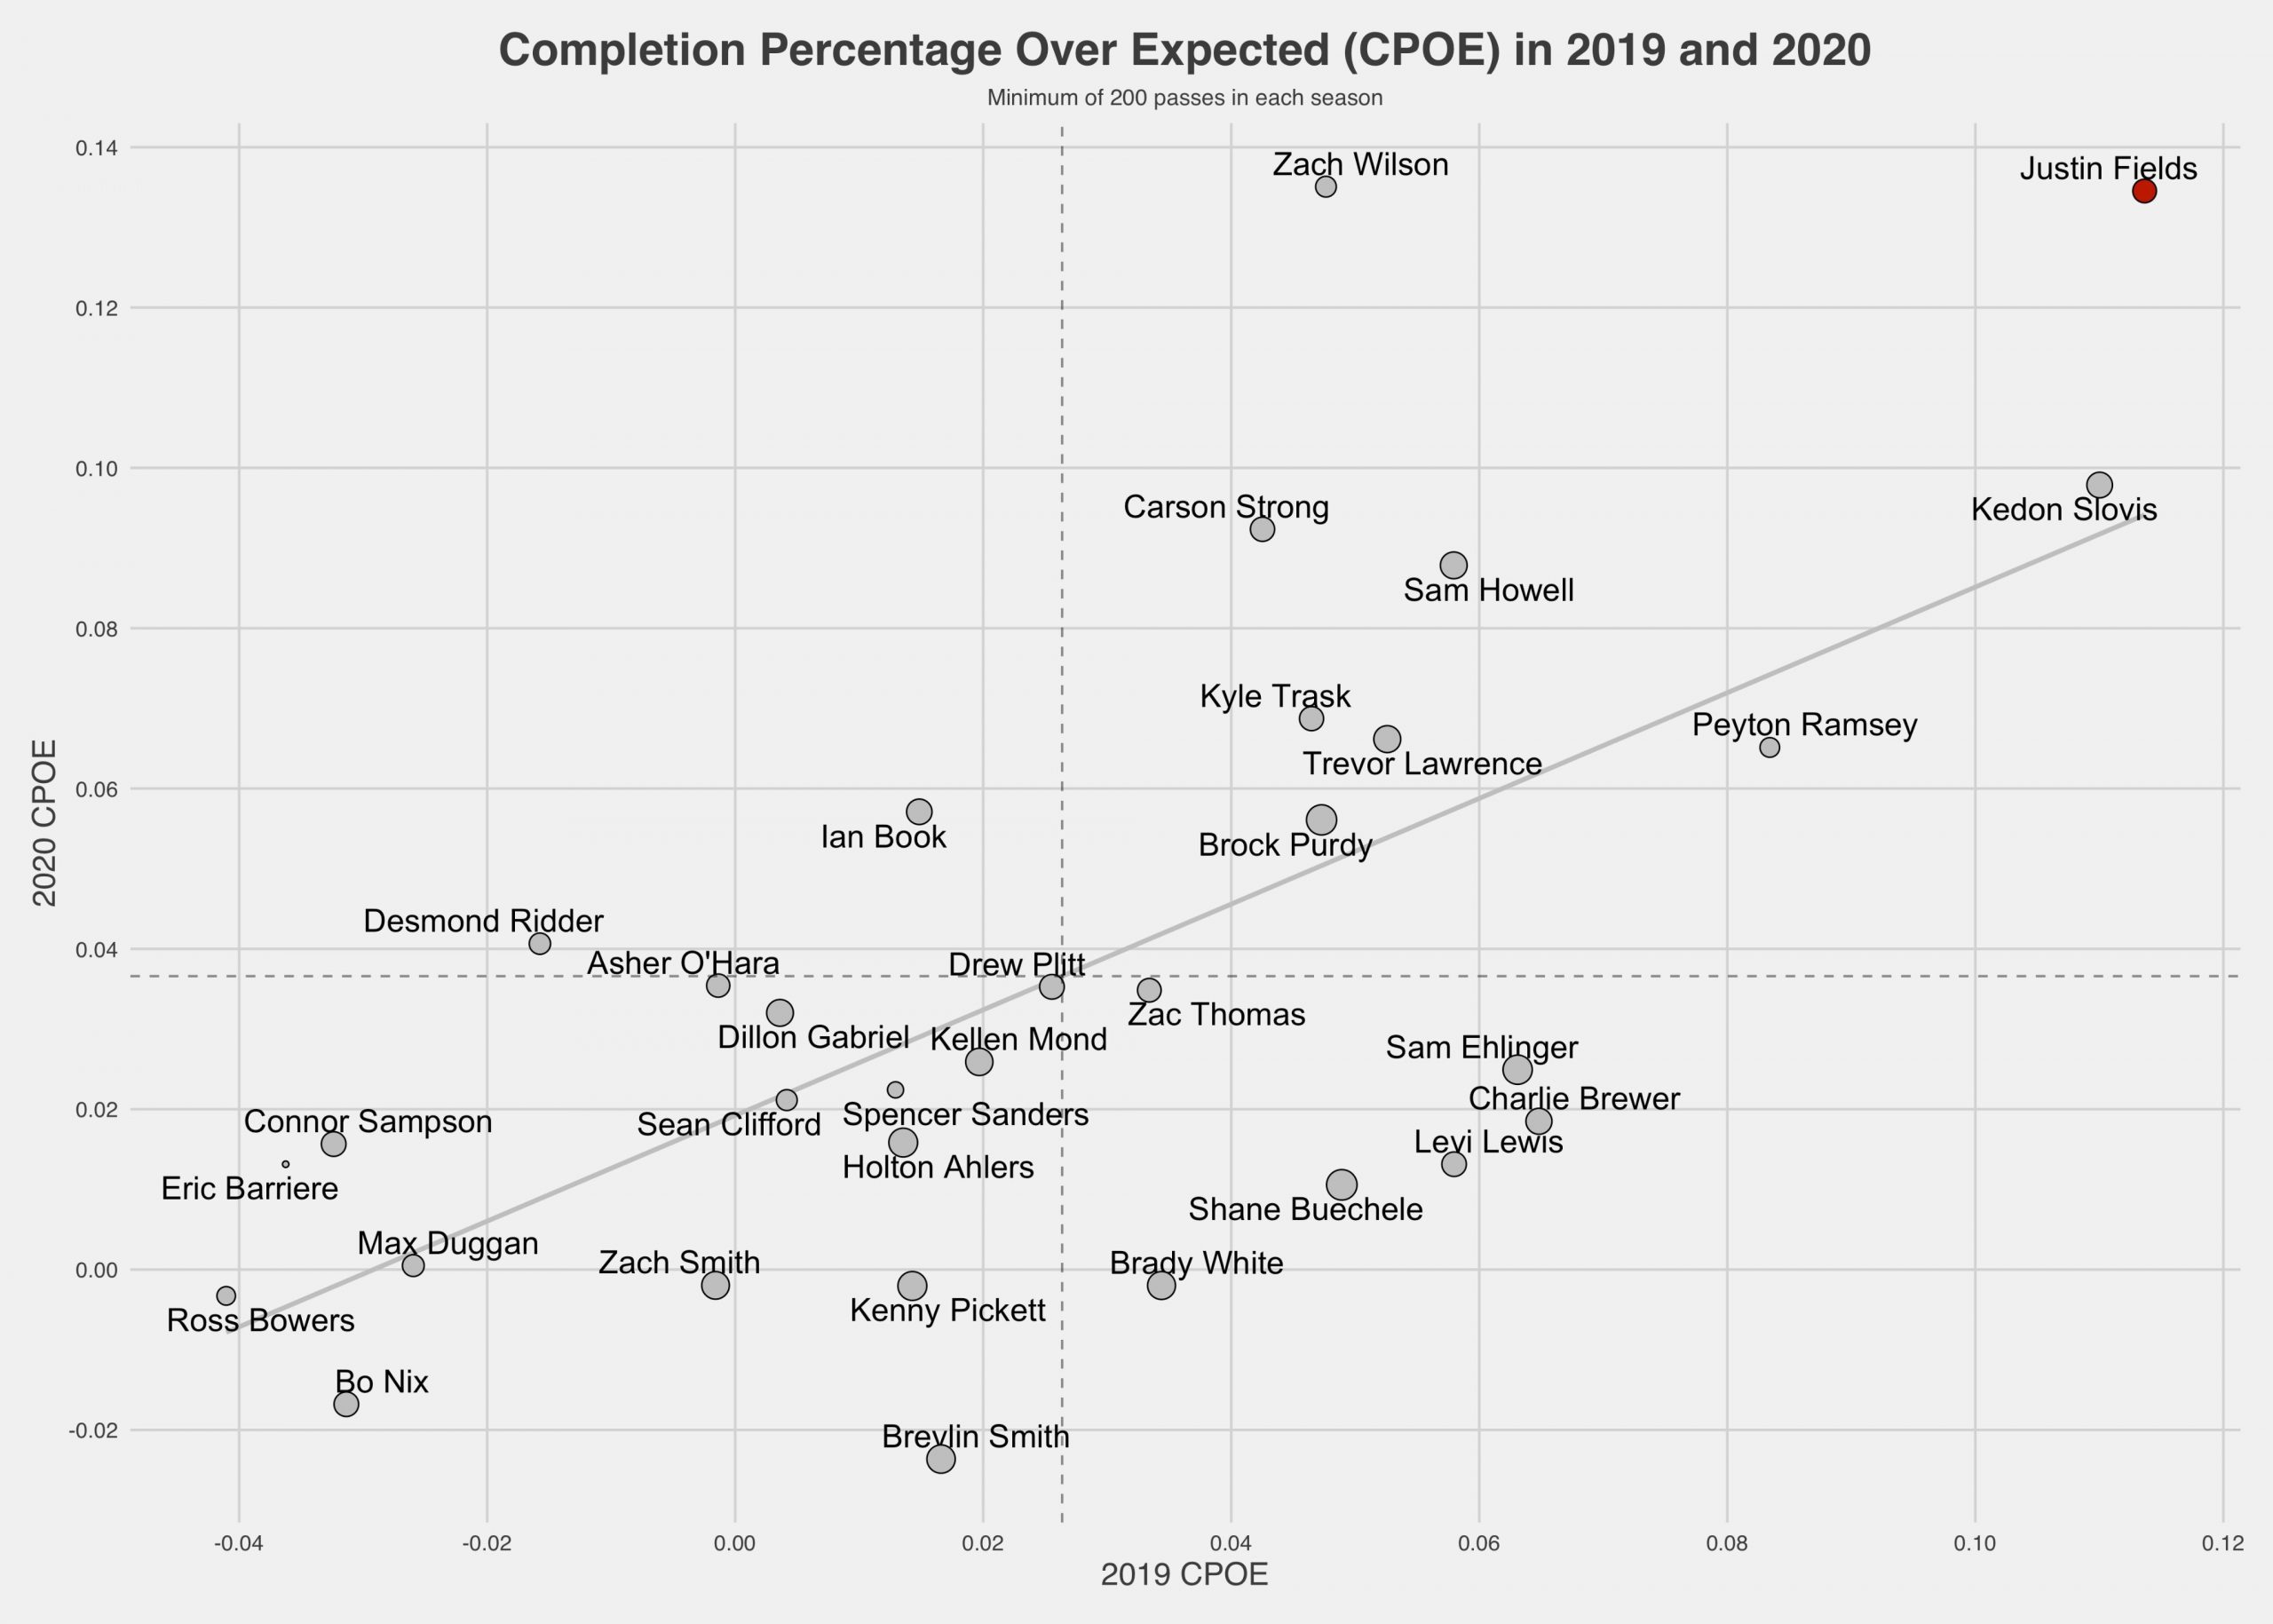
College Completion Percentage Over Expected (CPOE)
Short Description
Not all completion percentages are built the same way, as throwing shorter passes to more open receivers generally leads to a higher completion percentage. CPOE adjusts for that, using pass depth and receiver separation to determine the likelihood of an average college quarterback making any given throw.
Long Description
Again, completion percentage over expected was created using an extreme gradient boosting model. The most important factor was pass depth, as deeper passes are usually harder to complete. Receiver separation also played a significant role since it’s easier to complete a pass to an open receiver. This can be used congruently with accuracy charting, but it’s nice to have something backed by the numbers. A detailed description of college CPOE can be found here.
Example