We recently studied the relationship between a quarterback’s fantasy production and real-life game flow. The results were convincing: Game flow and fantasy production are closely related.
But which teams found themselves in certain game situations more often than others — and what was their pass-run ratio like in those scenarios? Simply knowing that game flow can have a big impact on a quarterback’s efficiency is only half the battle. The other piece of the puzzle is to make this data actionable, and the best way to do that is to find out which teams pass most often in each specific scenario.
To answer this question, we again used the most recent data available (from the 2017 season) to see how often each team was in each specified “game flow” scenario — either losing by a lot, losing by a little, tied, winning by a little, or winning by a lot.
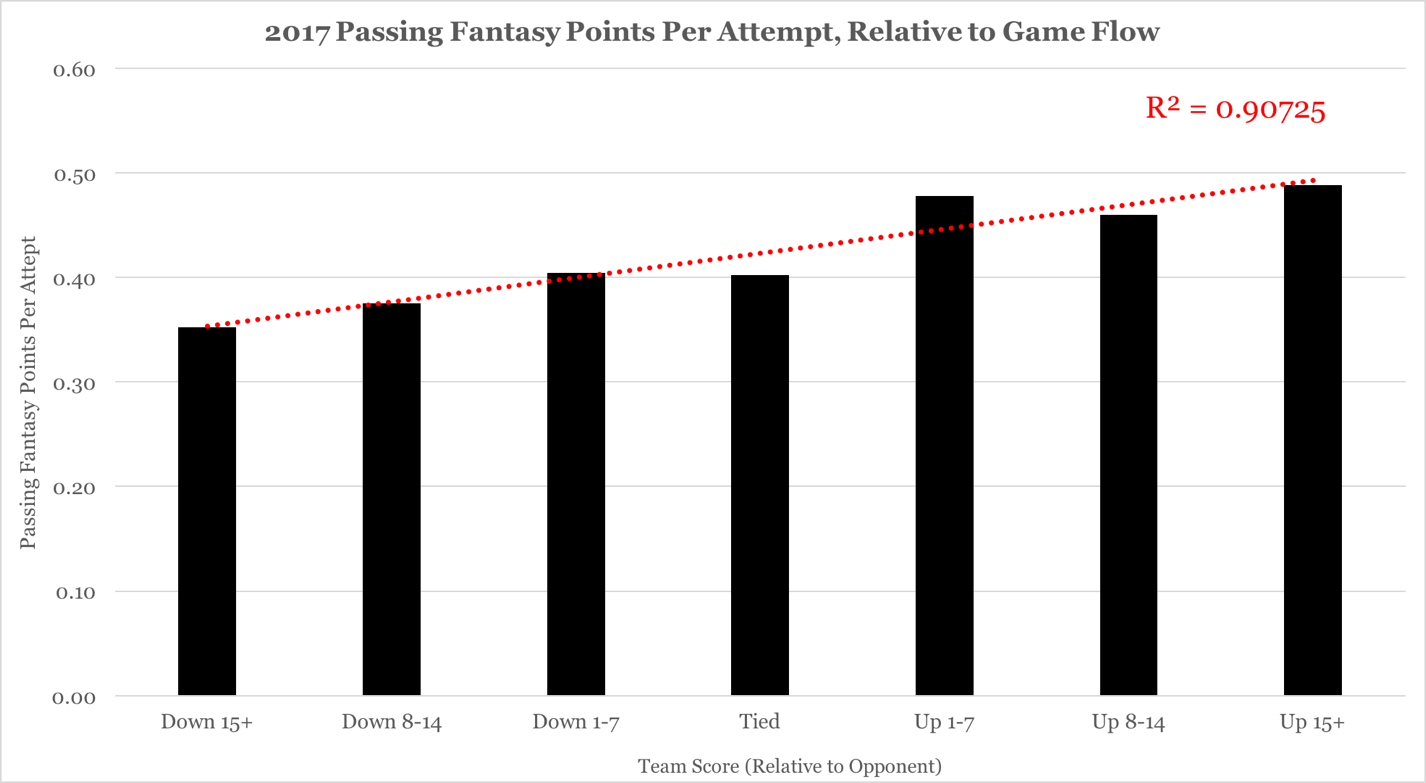
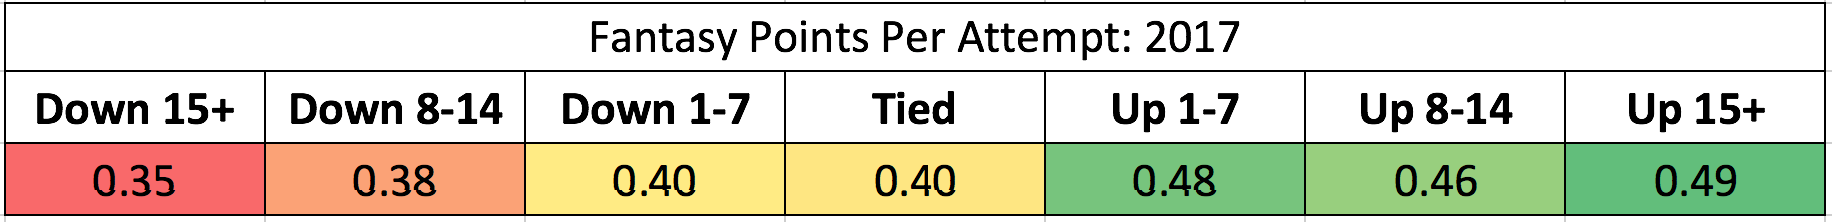
The close relationship between passing fantasy points and game flow
Here’s a quick refresher from the first article. Last year, the R-squared relationship between game flow and passing fantasy points was over 0.90, which indicates an extremely strong relationship.
…and the close relationship between game flow and pass/run ratios
The R-squared relationship between pass/run ratio and game flow is even stronger — at nearly 0.98.
