This analysis of DFS main-slate stacks is a variation of the methodology used in analyses on the single-game DraftKings showdown slates. It uses the combination of current projections, historical game results and similarity algorithms to simulate an upcoming game by looking back at the most similar historical matchups.
I’m taking the same outline and applying it instead to the DFS main slate by projecting the likelihood each team’s QB-WR, RB-DST, QB-WR-TE, QB-RB-WR stacks will be the highest-scoring of the slate. These are some of the most popular stack combinations employed in DFS strategy.
The information below is entirely in the form of plots and tables. If you’d like additional information and analysis on the same methodology broken out by position, please refer to the positional piece that also comes out every week.
Click here for more PFF tools:
Rankings & Projections | WR/CB Matchup Chart | NFL & NCAA Betting Dashboards | NFL Player Props tool | NFL & NCAA Power Rankings

METHODOLOGY
For each game on the DFS Sunday main slate, I looked through thousands of NFL matchups from 2014-2021 and found the closest analogies according to the following parameters: betting spread, over/under, average fantasy points scoring for the top-ranked positional players of both rosters (QB1, RB1, WR1, TE1).
Once I get the 75 most similar matchups for each upcoming game, I simulate the main slate 10,000 times by randomly choosing one of the 75 matchups for each game and then find the highest-scoring QB-WR, RB-DST, QB-WR-TE and QB-RB-WR stacks on the simulated slate.
Every match of historical and current games is not perfect, but the simulation allows us to smooth out the bumps and get a strong picture of how a slate of similar games would have played out.
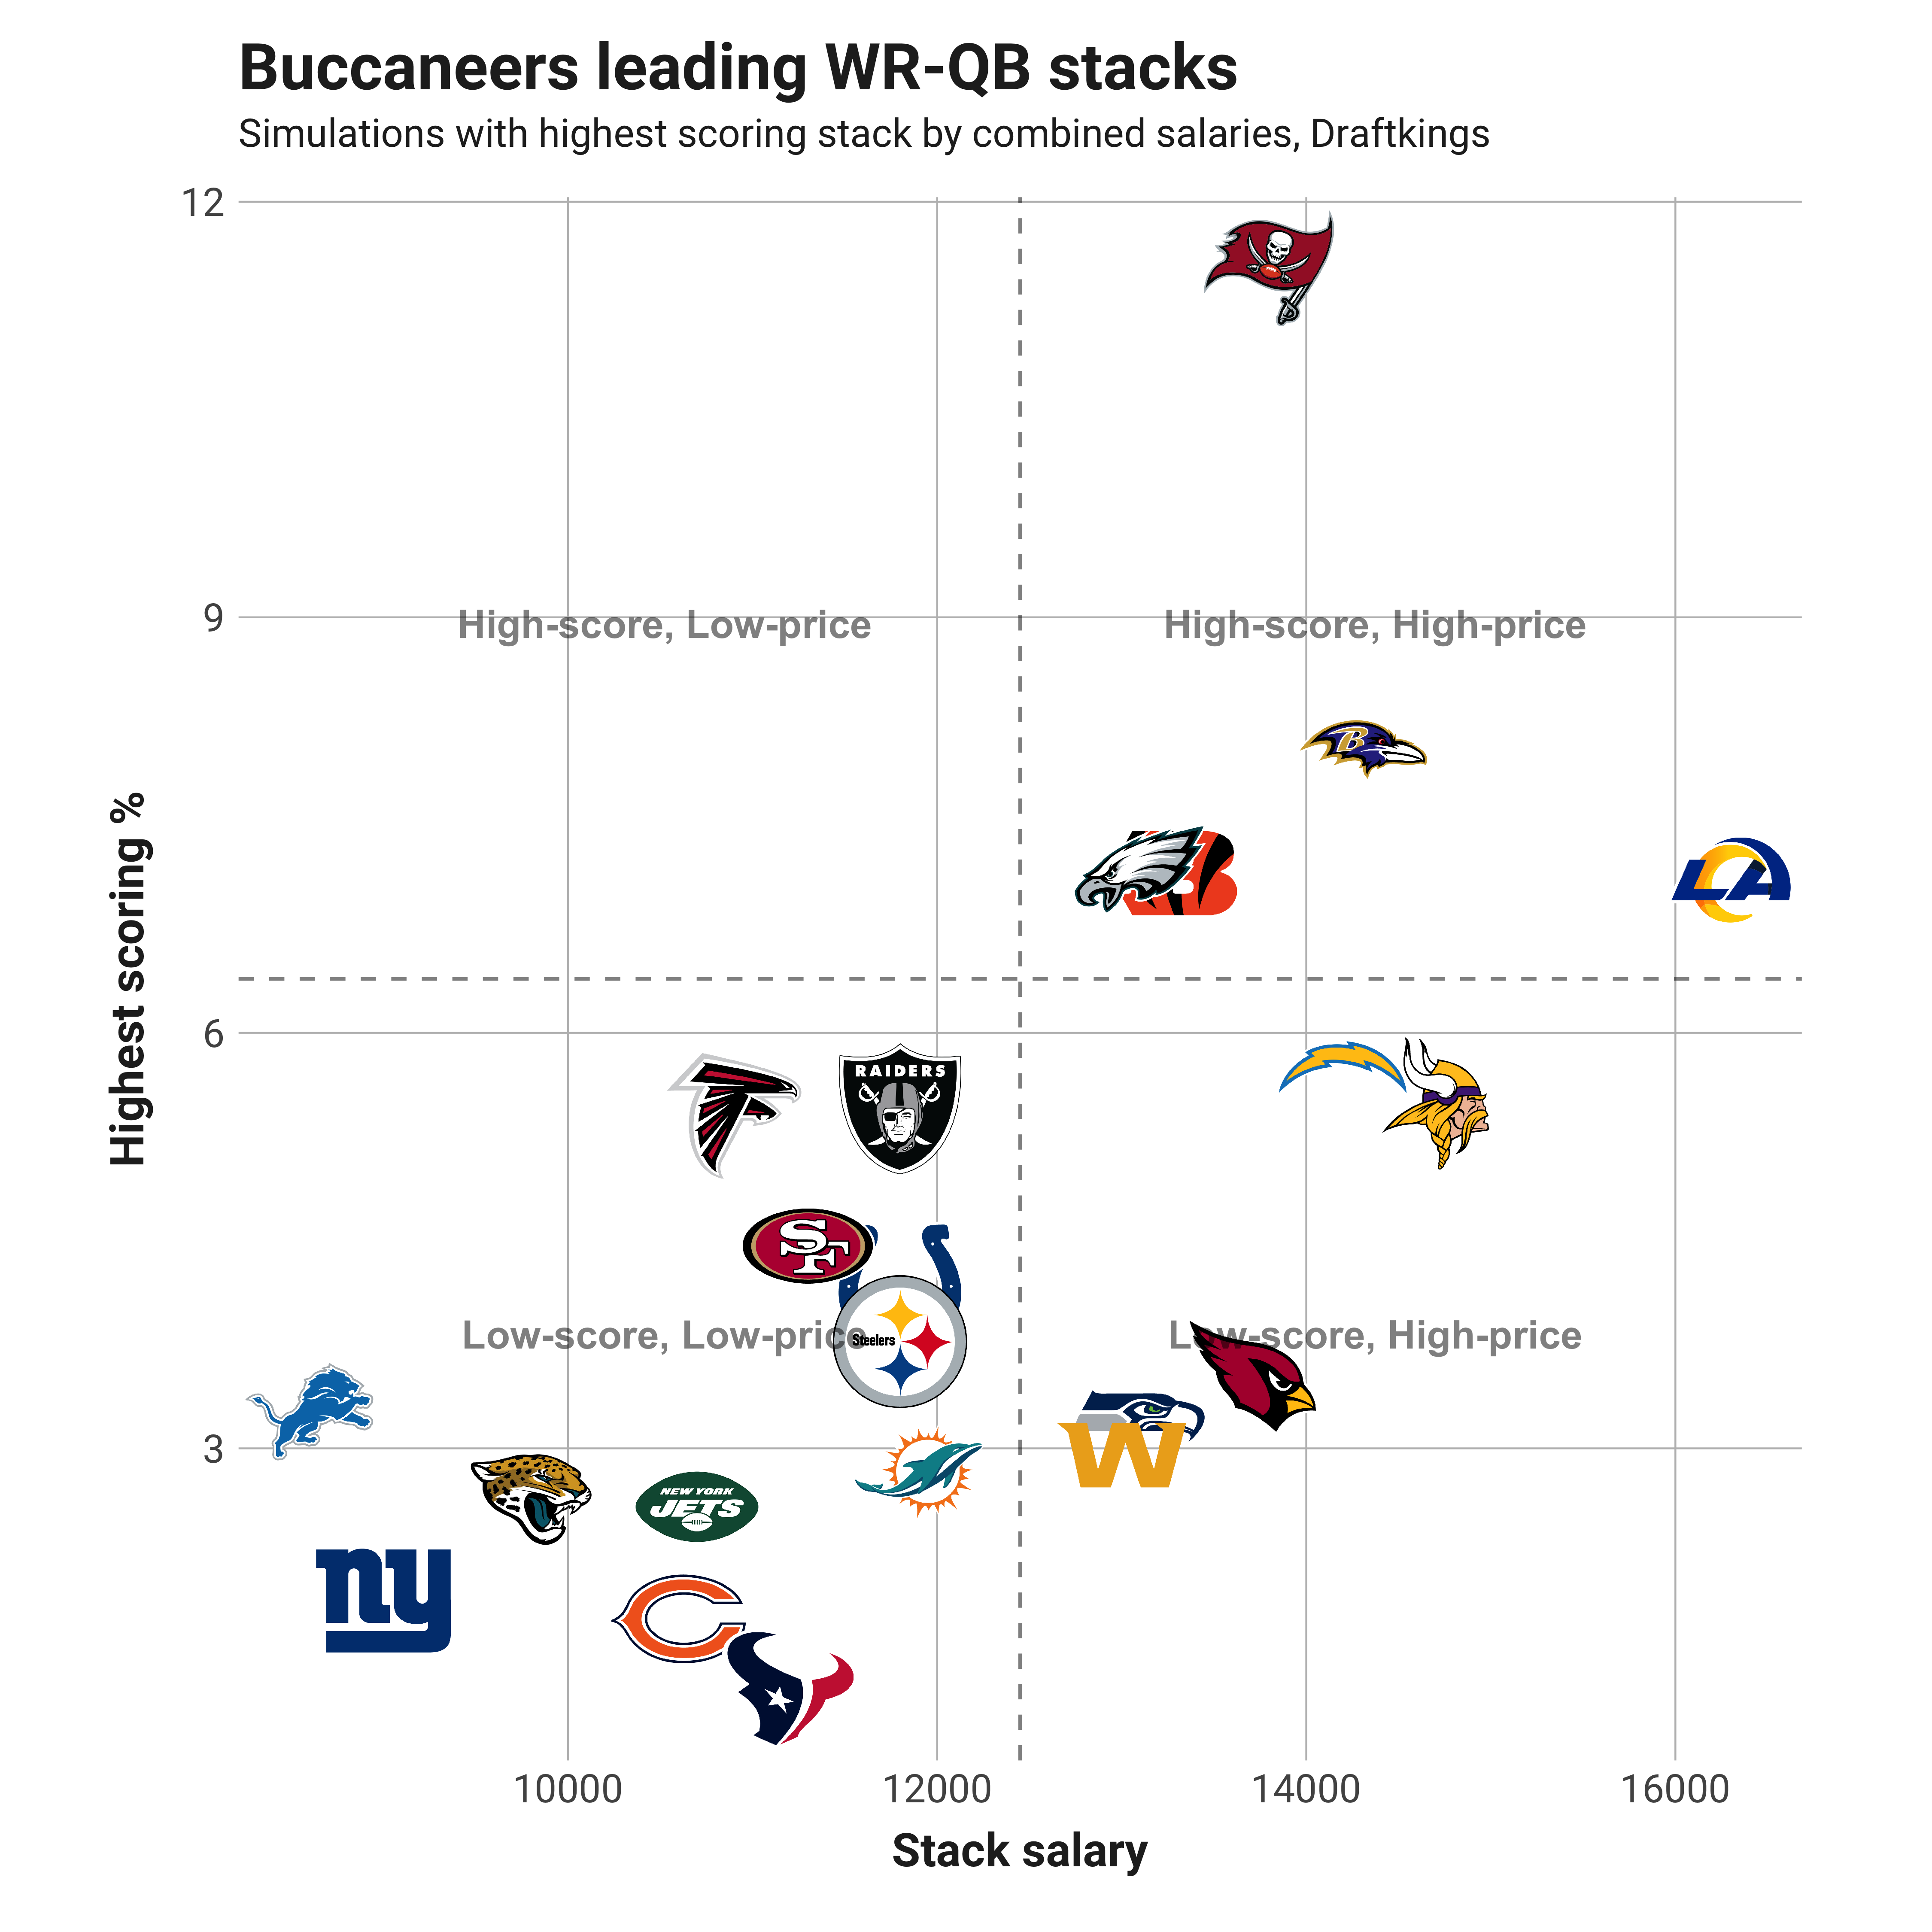
The last step is totaling up the number of times a particular team shows up as the top stack for each of the three stacks projected and then dividing that number by the total simulations. That number is what I call “highest scoring %” on the y-axis of the plots below labeled by team logo. Below the plots by team, I join the highest projected players that make up the stacks for that team and list their projected fantasy points and salaries for DraftKings and FanDuel.
HOW TO VIEW THE PLOTS
Each plot below has every team on the main slate positioned by the combined salary of the stack and the percentage of time that team’s stack was the highest scorer in the simulations.
One way to look at them is that anything above the dashed horizontal line is a good scoring stack, and anything to the right of the dashed vertical line is a high-priced stack. You should pay most attention to the upper-right (high-scoring and high-priced) and upper-left (high-scoring and low-priced) quadrants. Ideally, you’ll find something in the upper-left that you’re confident in, but often paying up and moving into the upper-right can be beneficial.
QUARTERBACK/WIDE RECEIVER STACK
QB/WR players
| Team | Highest % | Player | Pos | DK Fpts | DK Salary | FD Fpts | FD Salary |
| TB | 11.5 | Tom Brady | QB | 27.7 | 7,200 | 25.4 | 8,100 |
| TB | 11.5 | Chris Godwin | WR | 17.7 | 6,600 | 13.9 | 7,600 |
| BLT | 8.0 | Lamar Jackson | QB | 24.5 | 7,800 | 22.9 | 8,500 |
| BLT | 8.0 | Marquise Brown | WR | 13.2 | 6,500 | 10.5 | 7,100 |
| PHI | 7.2 | Jalen Hurts | QB | 23.8 | 7,000 | 22.4 | 8,000 |
| PHI | 7.2 | DeVonta Smith | WR | 14.5 | 6,100 | 11.5 | 6,300 |
| CIN | 7.2 | Joe Burrow | QB | 21.1 | 6,300 | 19.6 | 7,400 |
| CIN | 7.2 | Ja'Marr Chase | WR | 18.5 | 7,000 | 14.7 | 7,500 |
| LA | 7.1 | Matthew Stafford | QB | 22.7 | 7,300 | 20.9 | 7,800 |
| LA | 7.1 | Cooper Kupp | WR | 25.2 | 9,000 | 19.2 | 9,000 |
| LAC | 5.7 | Justin Herbert | QB | 20.9 | 6,700 | 19.5 | 8,200 |
| LAC | 5.7 | Keenan Allen | WR | 16.2 | 7,500 | 12.3 | 7,300 |
| MIN | 5.5 | Kirk Cousins | QB | 22.6 | 6,500 | 21.1 | 7,700 |
| MIN | 5.5 | Justin Jefferson | WR | 20.5 | 8,200 | 16.3 | 8,000 |
| LV | 5.5 | Derek Carr | QB | 20.7 | 6,000 | 19.2 | 7,500 |
| LV | 5.5 | Hunter Renfrow | WR | 14.8 | 5,800 | 11.5 | 6,400 |
| ATL | 5.4 | Matt Ryan | QB | 19.5 | 5,600 | 17.9 | 6,800 |
| ATL | 5.4 | Russell Gage | WR | 10.8 | 5,300 | 8.4 | 5,900 |
| SF | 4.5 | Jimmy Garoppolo | QB | 18.5 | 5,700 | 17.3 | 6,600 |
| SF | 4.5 | Brandon Aiyuk | WR | 16.2 | 5,600 | 12.9 | 7,000 |
| IND | 4.2 | Carson Wentz | QB | 19.2 | 6,100 | 18.0 | 7,500 |
| IND | 4.2 | Michael Pittman Jr. | WR | 13.7 | 5,700 | 10.9 | 6,800 |
| PIT | 3.8 | Ben Roethlisberger | QB | 14.5 | 5,000 | 13.5 | 6,500 |
| PIT | 3.8 | Diontae Johnson | WR | 14.2 | 6,800 | 10.9 | 7,200 |
| ARZ | 3.5 | Kyler Murray | QB | 22.4 | 7,500 | 21.3 | 8,300 |
| ARZ | 3.5 | DeAndre Hopkins | WR | 12.9 | 6,200 | 10.2 | 7,200 |
| DET | 3.3 | Jared Goff | QB | 17.0 | 5,200 | 15.7 | 6,400 |
| DET | 3.3 | Josh Reynolds | WR | 11.4 | 3,400 | 9.0 | 5,100 |
| SEA | 3.2 | Russell Wilson | QB | 20.9 | 6,400 | 19.6 | 7,300 |
| SEA | 3.2 | D.K. Metcalf | WR | 16.9 | 6,700 | 13.5 | 7,300 |
| WAS | 3.0 | Taylor Heinicke | QB | 20.1 | 5,600 | 18.8 | 7,100 |
| WAS | 3.0 | Terry McLaurin | WR | 18.6 | 7,400 | 14.4 | 7,200 |
| MIA | 2.8 | Tua Tagovailoa | QB | 18.3 | 5,500 | 17.3 | 6,900 |
| MIA | 2.8 | Jaylen Waddle | WR | 13.1 | 6,400 | 10.1 | 6,900 |
| JAX | 2.6 | Trevor Lawrence | QB | 16.5 | 5,100 | 15.4 | 6,700 |
| JAX | 2.6 | Marvin Jones Jr. | WR | 12.6 | 4,700 | 10.0 | 5,600 |
| NYJ | 2.6 | Zach Wilson | QB | 14.4 | 5,200 | 13.6 | 6,300 |
| NYJ | 2.6 | Elijah Moore | WR | 11.8 | 5,500 | 9.3 | 6,100 |
| NYG | 1.9 | Mike Glennon | QB | 18.9 | 4,000 | 17.5 | 6,100 |
| NYG | 1.9 | Kenny Golladay | WR | 12.3 | 5,000 | 10.1 | 5,800 |
| CHI | 1.8 | Justin Fields | QB | 17.8 | 5,000 | 16.7 | 6,600 |
| CHI | 1.8 | Darnell Mooney | WR | 13.0 | 5,600 | 10.2 | 6,700 |
| HST | 1.3 | Tyrod Taylor | QB | 18.4 | 5,300 | 17.2 | 7,000 |
| HST | 1.3 | Brandin Cooks | WR | 15.7 | 5,900 | 12.2 | 6,700 |
RUNNING BACK/DST
