When the Cincinnati Bengals announced they would stay put with the fifth pick in the 2021 NFL Draft, they sparked a debate over how that pick should be used. Should the team select LSU wide receiver Ja’Marr Chase or Oregon offensive tackle Penei Sewell?
However, the conversation quickly morphed into a broader discussion of positional value. For a franchise looking to build around a young quarterback in Joe Burrow, would an investment in the receiving corps be more valuable than one in the offensive line? More generally, which position — wide receiver or offensive tackle — generates more value in today’s NFL?
Cincinnati made the correct call by going with Chase, for reasons we'll examine below. But NFL teams frequently come out on the wrong side of these decisions.
The following is a look at a new PFF metric called Pro-Adjusted Wins Above Average (PAWAA) that values college football players according to their expected impact in an NFL game, which can be extremely valuable information for comparing draft prospects across positions. By better understanding positional value in the NFL draft, we can examine how teams are factoring in these elements of positional value with their draft decisions.
Subscribe to
Positional Value in the NFL Draft
Positional valuation is a crucial element of sound NFL draft strategy and team-building strategy as a whole. The utility of draft picks is twofold: Teams get to acquire talented players and do so at a discount relative to market value, thanks to the rookie wage scale. Since rookie contracts are fixed across positions, teams that draft at the most valuable positions not only maximize their on-field return from each player but they open up more cap space to spend across the rest of the roster.
For example, Russell Wilson’s rookie deal (less than $750,000 APY) gave the Seattle Seahawks considerable flexibility during their multiple Super Bowl runs in 2014 and 2015. That first contract was nothing compared to the $35 million per year Wilson makes now. Similarly, Patrick Mahomes’ rookie APY of ~$4.1 million pales in comparison to the 10-year, $450 million deal Mahomes and the Chiefs agreed to last July. You can’t find discounts like that outside of the draft.
Grading and ranking players within a position provides enough challenge for NFL front offices on its own; adding in these comparisons across positions makes it significantly harder to identify the best value available at each pick. At PFF, we have developed a Wins Above Replacement (WAR) metric for NFL players and a similar Wins Above Average (WAA) metric for college players, both of which quantify an individual player’s contribution to his team’s win total using PFF grades.
These grades are split by facet of play rather than position, meaning that a typical linebacker would contribute to his team’s overall run defense, pass rush and coverage grades, and possibly even his team’s special teams grade. The total WAR generated by the top 32 players at each position during the 2020 NFL season is shown below:
| Position | 2020 WAR |
| QB | 53.3 |
| CB | 26.9 |
| S | 25.3 |
| WR | 21.0 |
| LB | 9.86 |
| EDGE | 7.46 |
| T | 6.00 |
| TE | 5.37 |
| G | 4.89 |
| DI | 4.31 |
| HB | 2.99 |
| C | 2.53 |
By now, we have established that the quarterback position eclipses all others in importance, which is why the first team selecting in each of the last four drafts (and 18 of the last 23) has taken a QB. In the modern, pass-dominated NFL, it follows that defensive back and receiver — positions heavily involved in the passing game — are next on the list.
There is far from consensus on this hierarchy after the QB position, a problem further complicated by differences in market value and scarcity across positions. But perhaps the most underappreciated and unexplored wrinkle when considering positional value in the draft is this: While NFL and college football are the same sport, they aren’t the same game.
In other words, positions have different value in the college game than they do in the NFL. And that has ramifications for how teams judge a player’s college performance.
Below, we can see the WAA accrued by the top 32 players at each position during the 2020 college football season:
| Position | 2020 WAA |
| QB | 18.2 |
| WR | 9.14 |
| CB | 8.78 |
| HB | 7.00 |
| LB | 6.82 |
| S | 6.45 |
| EDGE | 6.20 |
| DI | 4.71 |
| TE | 3.83 |
| T | 3.78 |
| G | 2.88 |
| C | 2.50 |
In college football, the running game and trench play are greater focal points than in the NFL, and that means players involved in those facets of the game can stand out and generate value. Running backs have a notoriously minimal impact in the NFL. To a lesser extent, so do interior defensive linemen, but that can’t be gleaned from watching players’ college tape.
When a running back — say, Saquon Barkley — stands out in college, teams might project him to exhibit the same dominance as a pro, even though the dynamics of the NFL game don’t allow for running backs to make that much of an impact on their own. The same could be said for a run-first defensive tackle like Quinnen Williams.
And yet, the Giants took Barkley with the second overall pick in 2018 and the Jets took Williams with the third pick in 2019. If college WAA was the only information we had going into the draft, PFF might have easily made similar errors.
Introducing Pro-Adjusted Wins Above Average (PAWAA)
To better adjust for NFL positional value when evaluating college players, we created Pro-Adjusted Wins Above Average (PAWAA). PAWAA utilizes the same general methodology as our usual college WAA but replaces the collegiate positional weights with coefficients derived from NFL data.
PAWAA weights rushing, run-blocking and run-defense grades less heavily than WAA and places more value on pass blocking and pass coverage. PAWAA is also more evenly spread across players on each team, as there are fewer dominant individual players in the NFL.
A complete analysis of positional value in the draft would also have to account for how predictability in performance varies across positions, which we do not consider for this analysis. The total PAWAA generated by the top 32 players at each position in 2020 can be seen below:
| Position | 2020 PAWAA | 2020 WAA |
| QB | 17.5 | 18.2 |
| CB | 9.36 | 8.78 |
| WR | 7.97 | 9.14 |
| HB | 6.54 | 7.00 |
| S | 6.24 | 6.45 |
| LB | 5.86 | 6.82 |
| EDGE | 4.07 | 6.20 |
| TE | 3.24 | 3.83 |
| T | 3.20 | 3.78 |
| DI | 2.48 | 4.71 |
| G | 2.35 | 2.88 |
| C | 2.02 | 2.50 |
Interestingly, running back remains relatively high on the list. While this could be seen as support for the “Running Backs Do Matter” movement, it’s more likely a function of the heavy usage of top running backs in college football, both running the football and catching passes out of the backfield. Aside from running back, PAWAA clearly values cornerback play more than WAA, while WAA is higher on defensive line play.
How well do teams incorporate positional value?
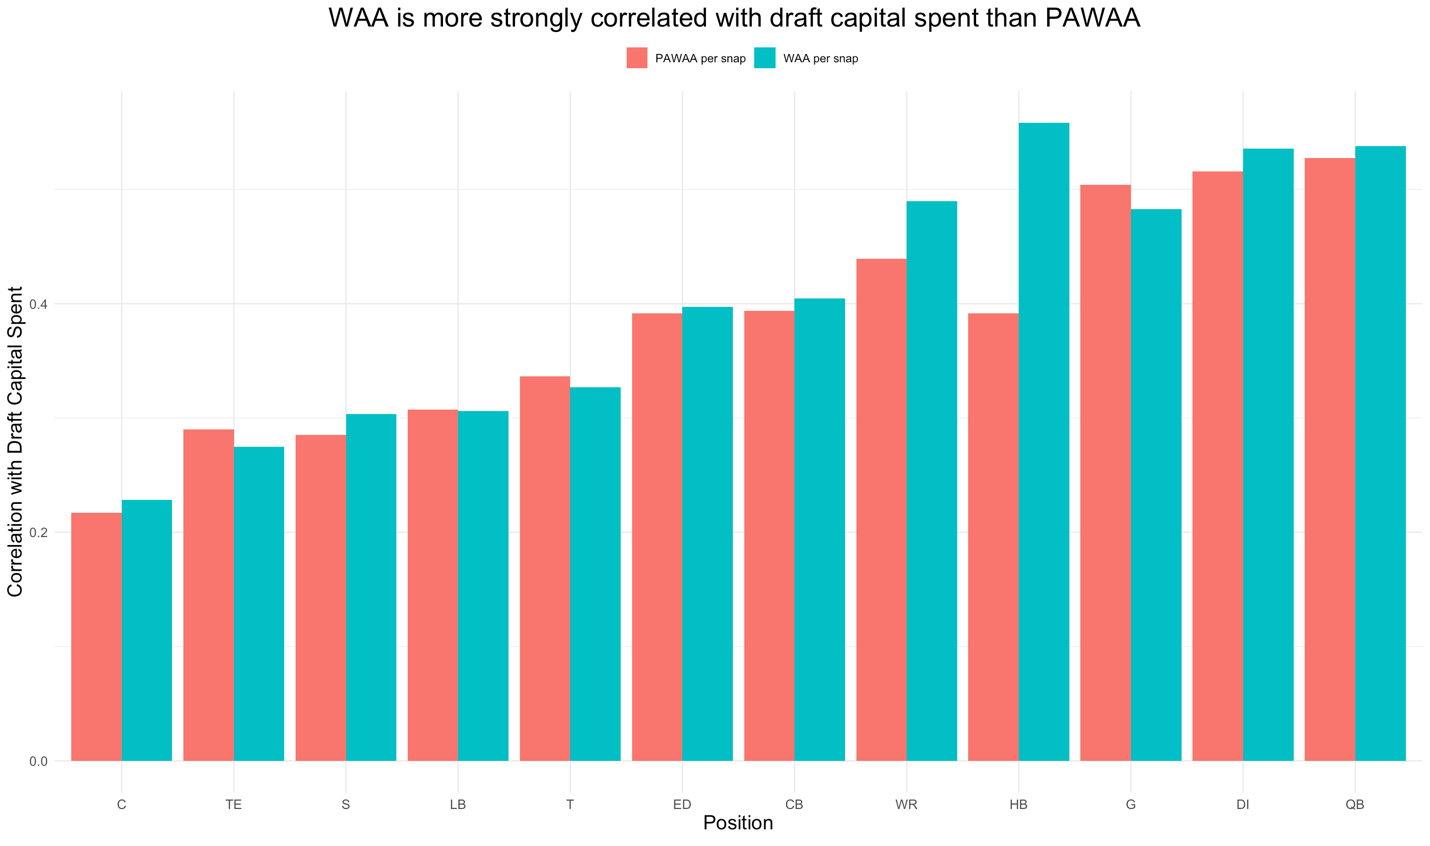
If NFL teams are fully factoring in these elements of positional value with their draft decisions, PAWAA should be more strongly correlated than WAA with where teams spend their draft capital. Yet this is not the case.
Among drafted players, a player’s total college WAA and WAA per snap are both more highly correlated with draft capital spent (r = 0.397 and r = 0.411) than total PAWAA and PAWAA per snap (r = 0.365 and r = 0.367). To quantify draft capital spent, we mapped each draft slot to an expected PFF WAR value, but the same trend holds when just using raw draft pick.
This discrepancy is even present within some positions, notably running back. Among drafted running backs, the correlation between WAA per snap and draft capital spent is 0.558, compared to the 0.392 correlation between PAWAA per snap and draft capital spent for the same group of players. So not only are teams overdrafting the running back position as a whole, they appear to be drafting the wrong traits in running backs as well.
We see a similar, less extreme phenomenon at the wide receiver position (among others). Across many positions, teams insufficiently discount facets of the game linked with success in the run game. All within-position correlations for the two metrics on a per-snap basis are displayed in the plot below:
There is a clear market inefficiency in the way teams value positions in the NFL Draft. The consequences of errors in this domain don’t dissipate immediately after draft night, either.
When the Dallas Cowboys drafted Ezekiel Elliott fourth overall in 2016, their investment in Elliott didn’t end there. The Cowboys ran the ball at the fourth-highest frequency in the league during Elliott’s rookie season and later signed him to a six-year, $90 million extension, despite Elliott’s underwhelming efficiency as a runner. Dallas continued to feed Elliott touches and dollars to seemingly justify their initial use of the fourth pick to draft him. Not only did the Cowboys miss out on an elite cornerback in Jalen Ramsey, whom the Jacksonville Jaguars drafted one pick later, but committing to Elliott also cost Dallas the opportunity to re-sign 2015 first-round pick Byron Jones, a formidable corner who likely would have substantially improved their 29th-ranked secondary in 2020.
This is not an exact science, and perhaps Dallas could have found a way to pay Jones if it had truly wanted to. Yet NFL teams consistently fall victim to sunk cost fallacy, confirmation bias and regret aversion like the Cowboys did with Elliott. Draft position is correlated with future salary even when conditioning for performance, meaning players are paid more four or five years later simply because they were picked higher. So, in effect, these inefficiencies in positional valuation during the draft trickle down to create more mistakes down the line.
For these reasons, it is also difficult to assess how all of this information translates to projecting NFL performance. Every metric we use to capture a player’s value once they reach the NFL — second-contract compensation, WAR, Approximate Value, etc. — has some measure of positional value already baked in and depends on highly skewed usage patterns.
What is not particularly difficult to distill from all of this information is that NFL teams’ notions of positional value are flawed. The league’s sharper teams have started loading up on defensive backs and investing heavily in the passing game, yet we still saw two running backs selected in the first round of this year’s NFL Draft.
Separating player ability and positional value from the context of the college game is a tough challenge that NFL teams spend copious time and resources trying to crack in the months leading up to the draft. Many franchises have gradually adjusted to the pass-heaviness of the modern NFL by changing their play calls on both sides of the ball, but on the player acquisition side, many front offices are still lagging behind.
In drafting Ja’Marr Chase with the fifth overall pick, it is overwhelmingly clear that the Bengals made the smart choice in terms of positional value. The wide receiver position consistently generates more WAA and PAWAA than offensive tackle. No matter how you slice it, Chase generated more value in college than Sewell and did so in fewer total snaps. It wasn’t even close.
| Player | PAWAA | WAA | Snaps |
| Ja’Marr Chase | 0.705 | 0.870 | 1,157 |
| Penei Sewell | 0.252 | 0.304 | 1,377 |
Navigating the NFL's salary cap and consistently building through the draft are crucial elements of continued success for every franchise. The fact that so much of this data on positional value is still debated, let alone neglected by so many teams, shows that the league has a long way to go.
