
With only two teams remaining to compete in the Super Bowl, the offseason is in full swing for the rest of the NFL and football pundits. We at PFF are also getting into the action with the launch of our 2021 Draft Guide and Free Agency Rankings tool, which allows you to sort by position and team needs and includes contract projections from Over the Cap as well as historical grades and wins above replacement (WAR) numbers for the past three seasons.
This article is part of a series going through our top-ranked free agents (excluding quarterbacks) by position group, using their past stats to match them with historical players.
We started with one of the strongest free agent wide receiver classes ever, and this article turns to free-agent running backs. Once we have a sample of similar players, we can see how those similar players performed in subsequent seasons to get an idea of the current player’s range of outcomes. I’ll also include any potential bargain free agents who aren’t at the top of our rankings but look better than expected in WAR projections.
This system is similar to FiveThirtyEight’s CARMELO NBA player projections, except that it is applied to football and uses PFF’s WAR metric as the proxy for player value.
Buying wins in free agency is an expensive proposition, but the value of each incremental win for a playoff-caliber team cannot be understated. This year, teams are going to have tough decisions about how to spend that money.
What will become apparent from the value numbers below is that our WAR numbers probably see the running back position as less impactful than some NFL decision-makers. However, the numbers will also show that the position generally has a lower floor when players don’t meet expectations.
METHODOLOGY
For each of the running backs below, the closest comparable players were found by measuring the similarity between them based on several features — age (within one year), weight, WAR, previous-year WAR, targets per game, rush attempts per game, PFF rush grades, PFF route grades and WAR per snap.
The most similar players across these metrics are grouped together to calculate the expected WAR numbers for 2020 and 2021, with the weight of each comp reflecting the level of similarity. I didn’t use the same number of comps for all players, as it is more difficult to find a wide range of comparable seasons for older players.
The first plot shows the relevant WAR numbers for the receiver’s closest comps. The second plot displays past and future performance for the free agent based on the comps. And the final table shows the dollar values based on positional WAR baselines for each outcome (expected, ceiling and floor) through 2022.
I decided to restrict the forecasts to the next two years to maximize the number of comparable players we have in the dataset, reduce error for longer forecasts and reflect the fact that all but the top-tier free agent contracts in the NFL are glorified two-year deals that give teams the option to continue.
NO. 44: AARON JONES
Jones has been a top-12 running back, according to PFF WAR, over the past two seasons, ranking third in 2019 and 11th in 2020. After the Green Bay Packers drafted A.J. Dillon in the second round, speculation swirled that the move presaged the Packers letting Jones go into free agency without putting up a fight. Jones’ comps include a fringe Hall of Fame candidate in Maurice Jones-Drew and high draft picks who flamed out of the league after successful age 25 seasons. Jones doesn’t have much in the way of draft pedigree, but he has sufficiently established himself as a top running back over the course of his rookie contract.
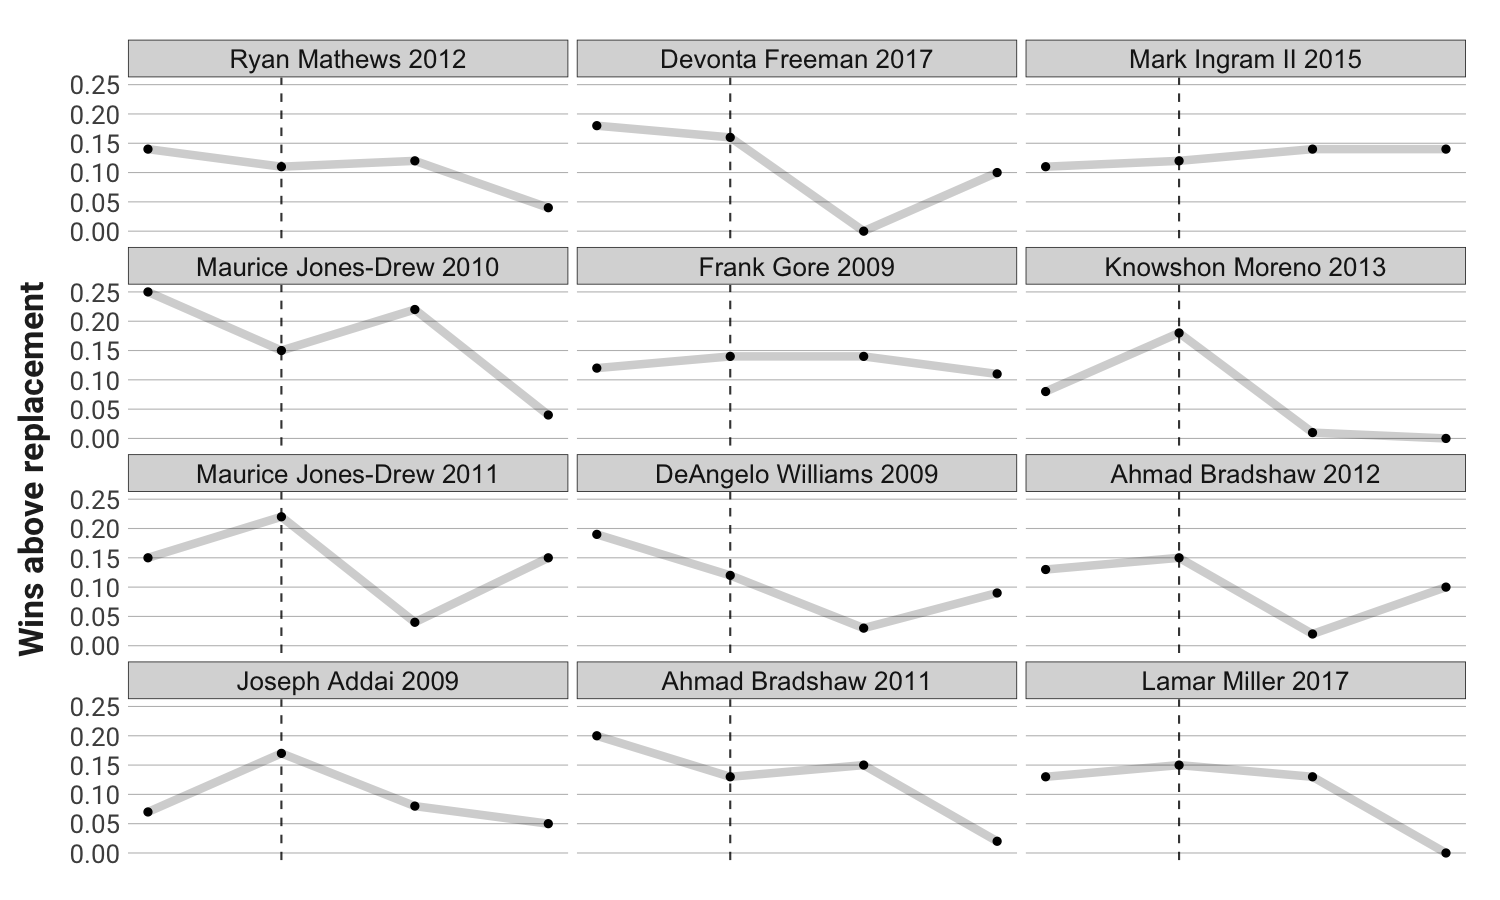
If you assume that only the higher-end comps above, such as Jones-Drew and Frank Gore, should be part of the calculation, Jones’ expected projection would look more like his ceiling on the plot below. The key is showing how rare of a season Jones had in 2019, which might end up being the peak of his career.
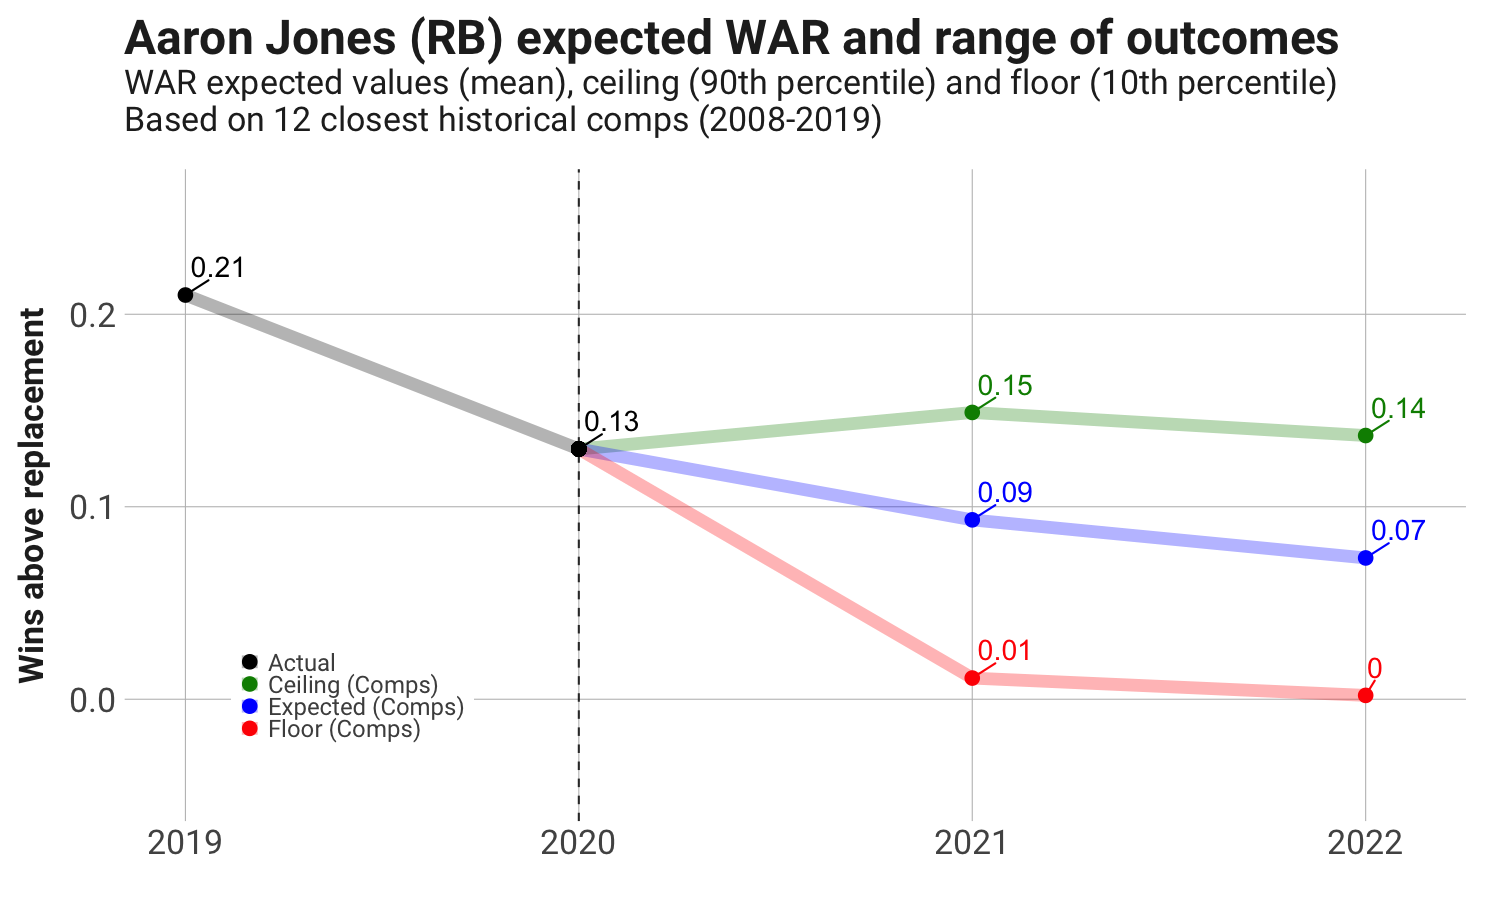
Even if you have an optimistic view of Jones’ ability to hit his ceiling, there isn’t a ton of value with his likely contract over our forecasted value of $10 million per season. But, the numbers are at least close, which is a positive sign for a position we see as generally overpriced.
| Outcome | 2019 | 2020 | 2021 | 2022 | Two-Yr Avg |
| Actual/Expected | $15.3 | $10.0 | $6.3 | $4.9 | $5.6 |
| Ceiling (90th) | N/A | N/A | $10.5 | $9.8 | $10.1 |
| Floor (10th) | N/A | N/A | $1.0 | $1.0 | $1.0 |
NO. 57: CHRIS CARSON
Carson’s numbers were suppressed the past few years by his inability to stay on the field, and his comps suffered as a result. But if you look at the upside comps for the 25-year-old, DeMarco Murray and Arian Foster aren’t bad company.
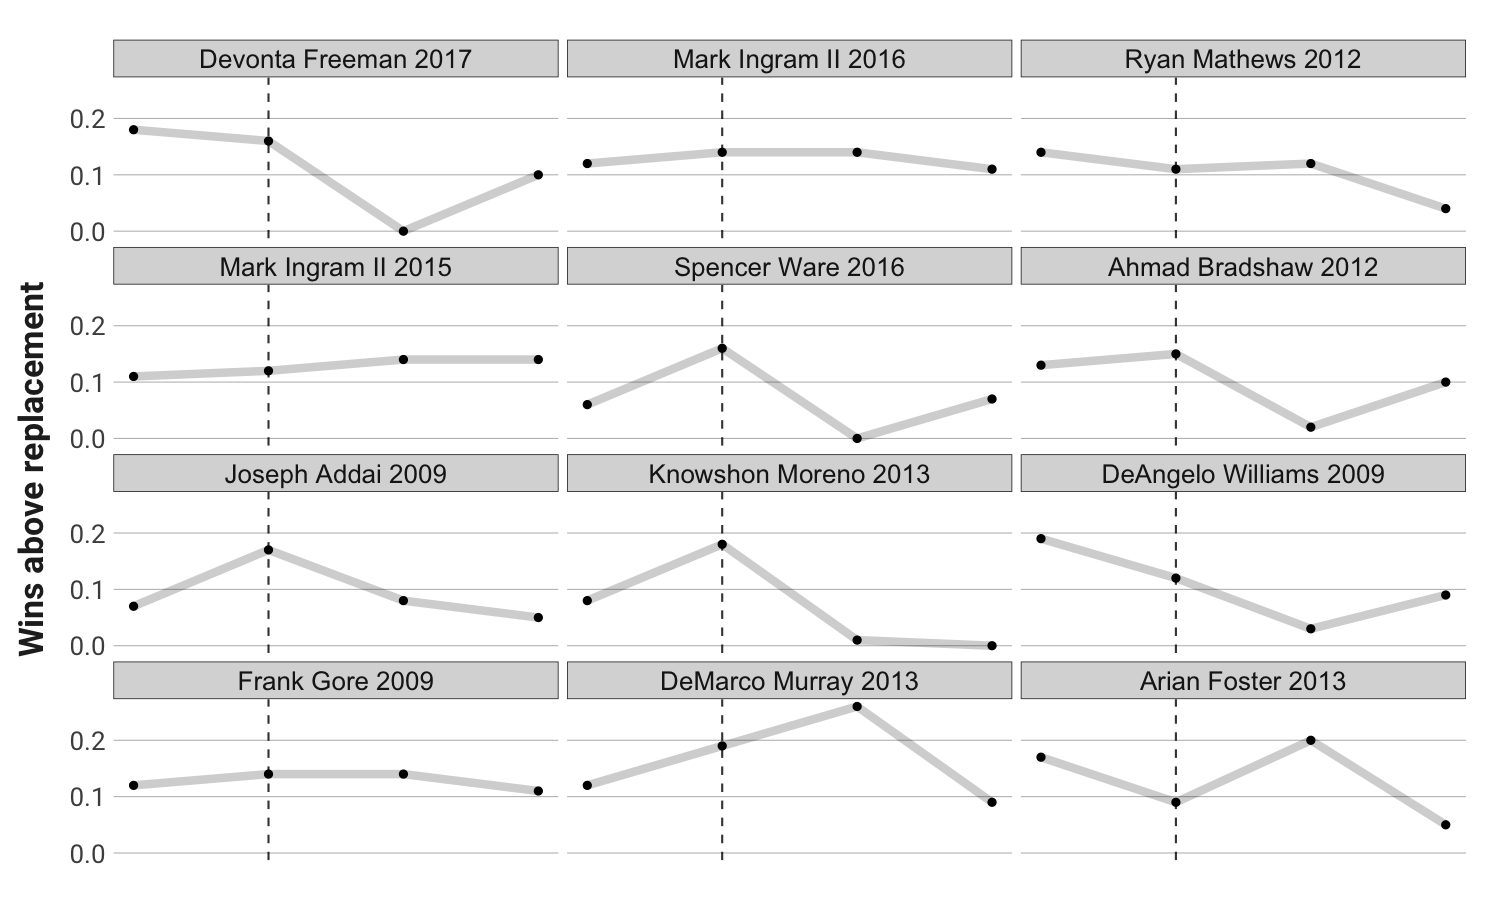
We mentioned Murray and Foster as comps for Carson before, and their careers illustrate the risk of a running back on a second contract. Our projections have upside for Carson in his second year, even more than we saw for Aaron Jones. But the ceiling projection declines significantly after two years.
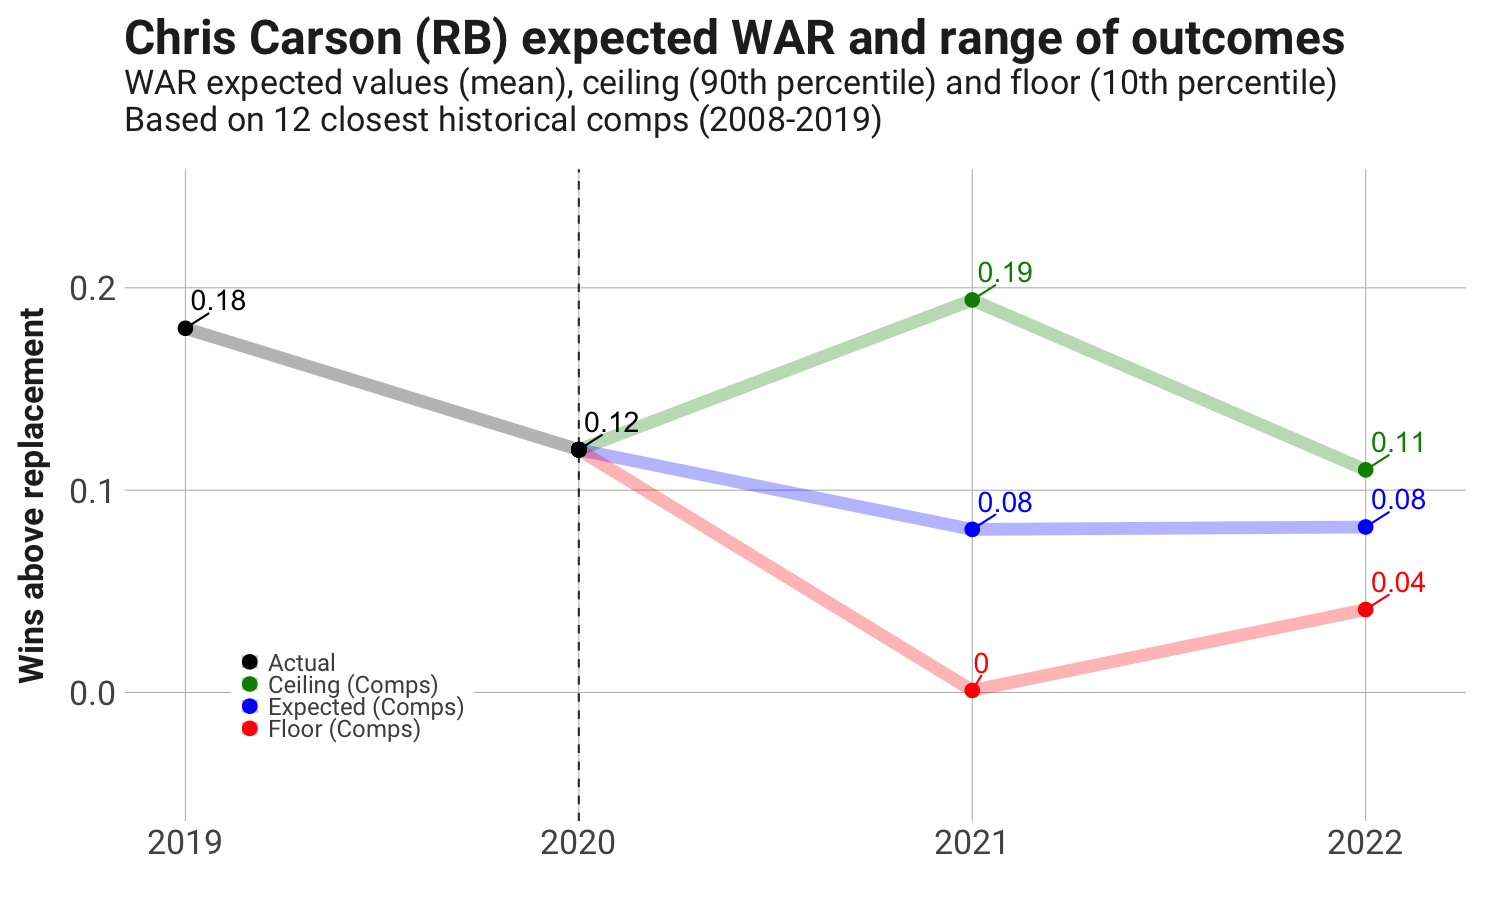
Teams may offer Carson only a glorified one-year deal to hedge against injury and age-related decline, and that looks like the wise move, according to our numbers. We see Carson as potentially creating $11.5 million of value in 2021.
| Outcome | 2019 | 2020 | 2021 | 2022 | Two-Yr Avg |
| Actual/Expected | $11.4 | $8.0 | $4.8 | $4.8 | $4.8 |
| Ceiling (90th) | N/A | N/A | $11.5 | $6.7 | $9.1 |
| Floor (10th) | N/A | N/A | $1.0 | $2.4 | $1.7 |
NO. 77: KENYAN DRAKE
Drake was a lightly used backup for most of his career before breaking out in the second half of 2019 after being traded to the Arizona Cardinals. Drake’s numbers fell back to earth in 2020, as he largely shared the workload with Chase Edmonds. And his comps are littered with failed breakouts.
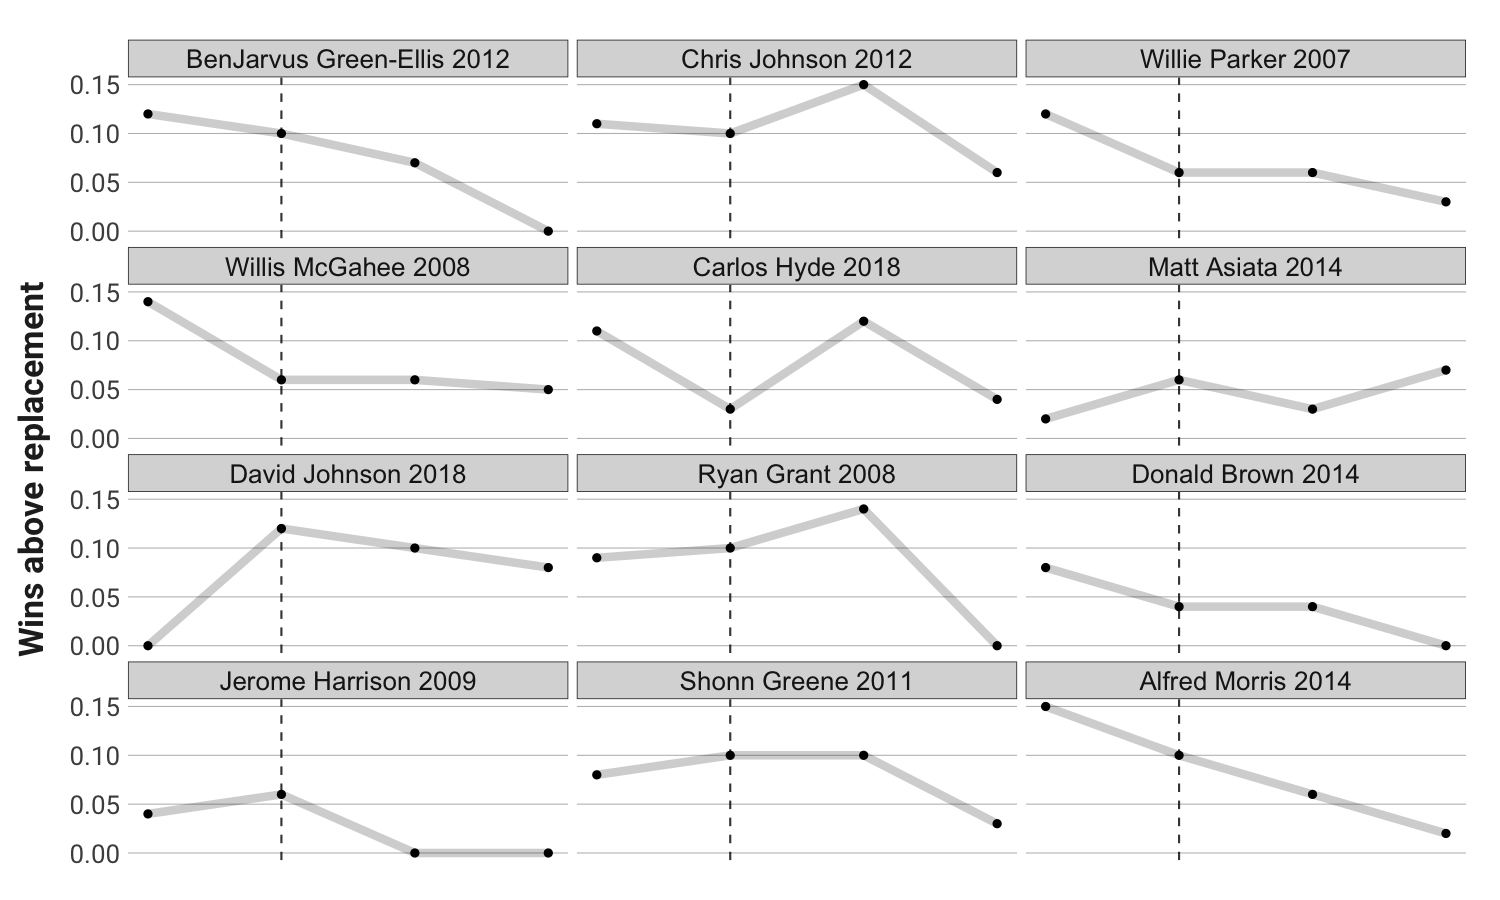
There is some hope in the ceiling comps for Drake, but his baseline projection is to be slightly above replacement level.
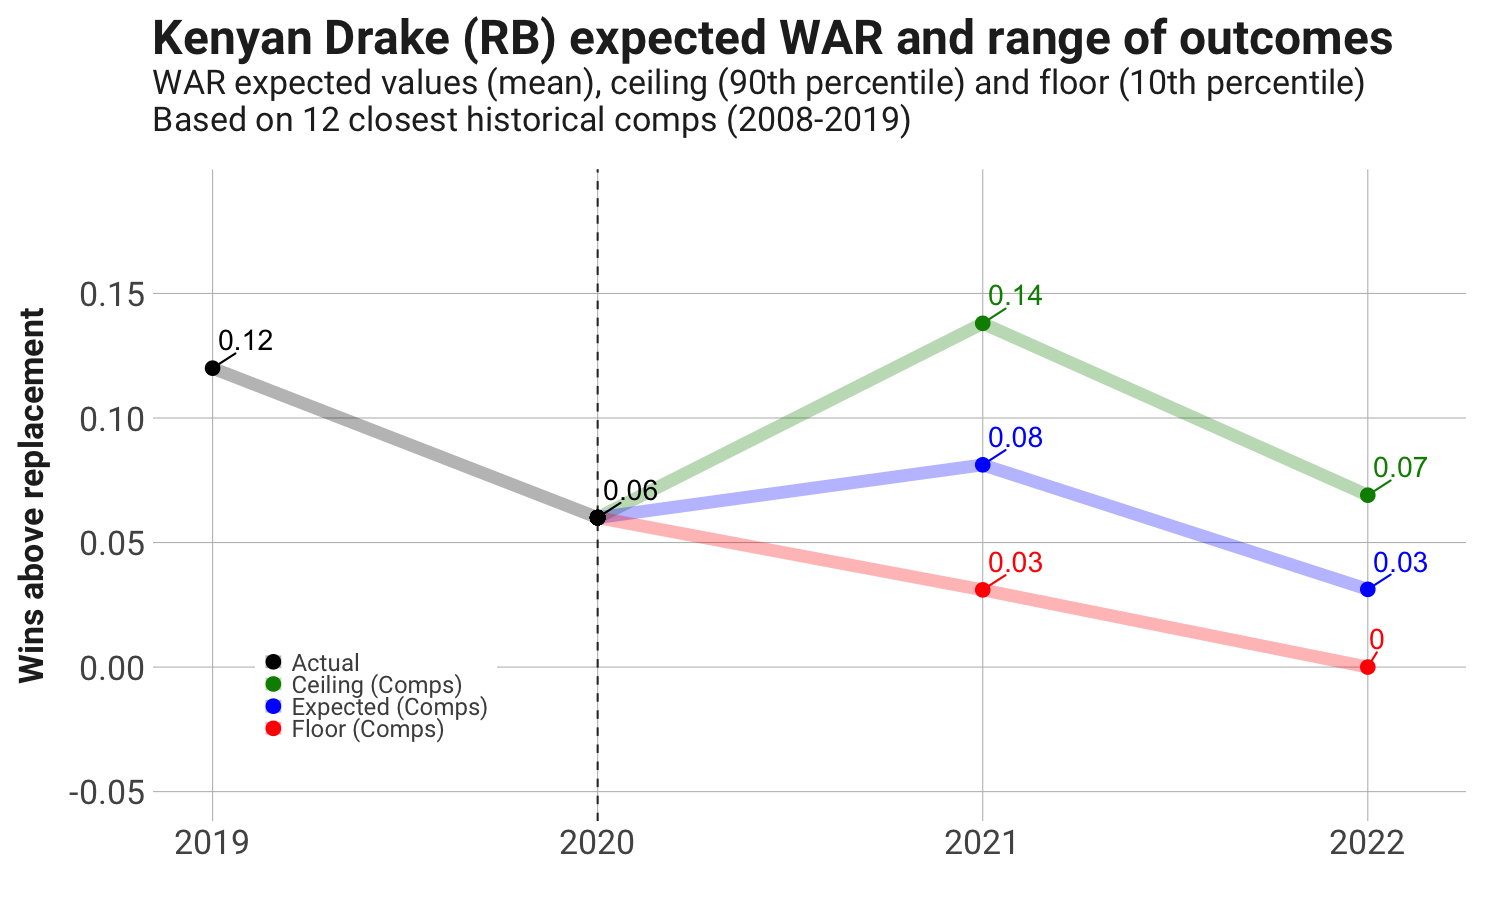
Drake made $8.4 million on the transition tag in 2020, and we don’t see the upside to justify a similar contract going forward. Our ceiling (90th percentile) projection for Drake has a value of $6.4 million per season.
| Outcome | 2019 | 2020 | 2021 | 2022 | Two-Yr Avg |
| Actual/Expected | $7.6 | $4.0 | $4.8 | $1.8 | $3.3 |
| Ceiling (90th) | N/A | N/A | $8.5 | $4.2 | $6.4 |
| Floor (10th) | N/A | N/A | $1.8 | $1.0 | $1.4 |
NO. 81: JAMES CONNER
At 25 years old, Conner is slightly younger than other free agents, which helps his projections. He gets great seasons of C.J. Anderson, DeAngelo Williams and Ryan Grant in his top-12 before they fall off two years out.
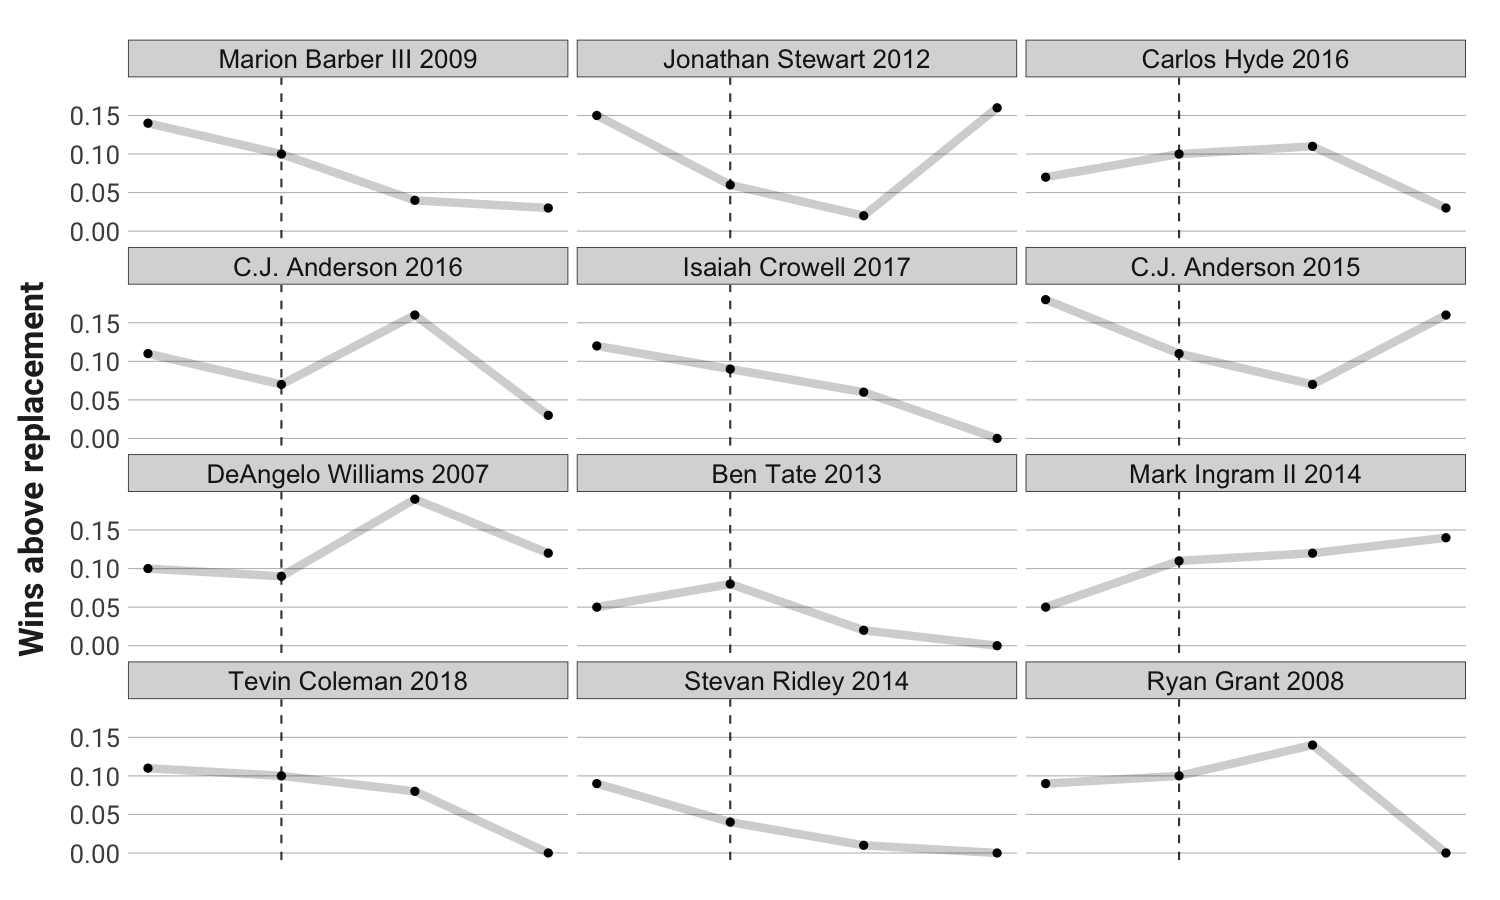
Conner is one of the few free agents to have the expected outcomes equal his output from the past couple of seasons. Unfortunately for Conner, we're using only the past two years in the comp-matching process — not three years ago when he produced the seventh-most WAR.
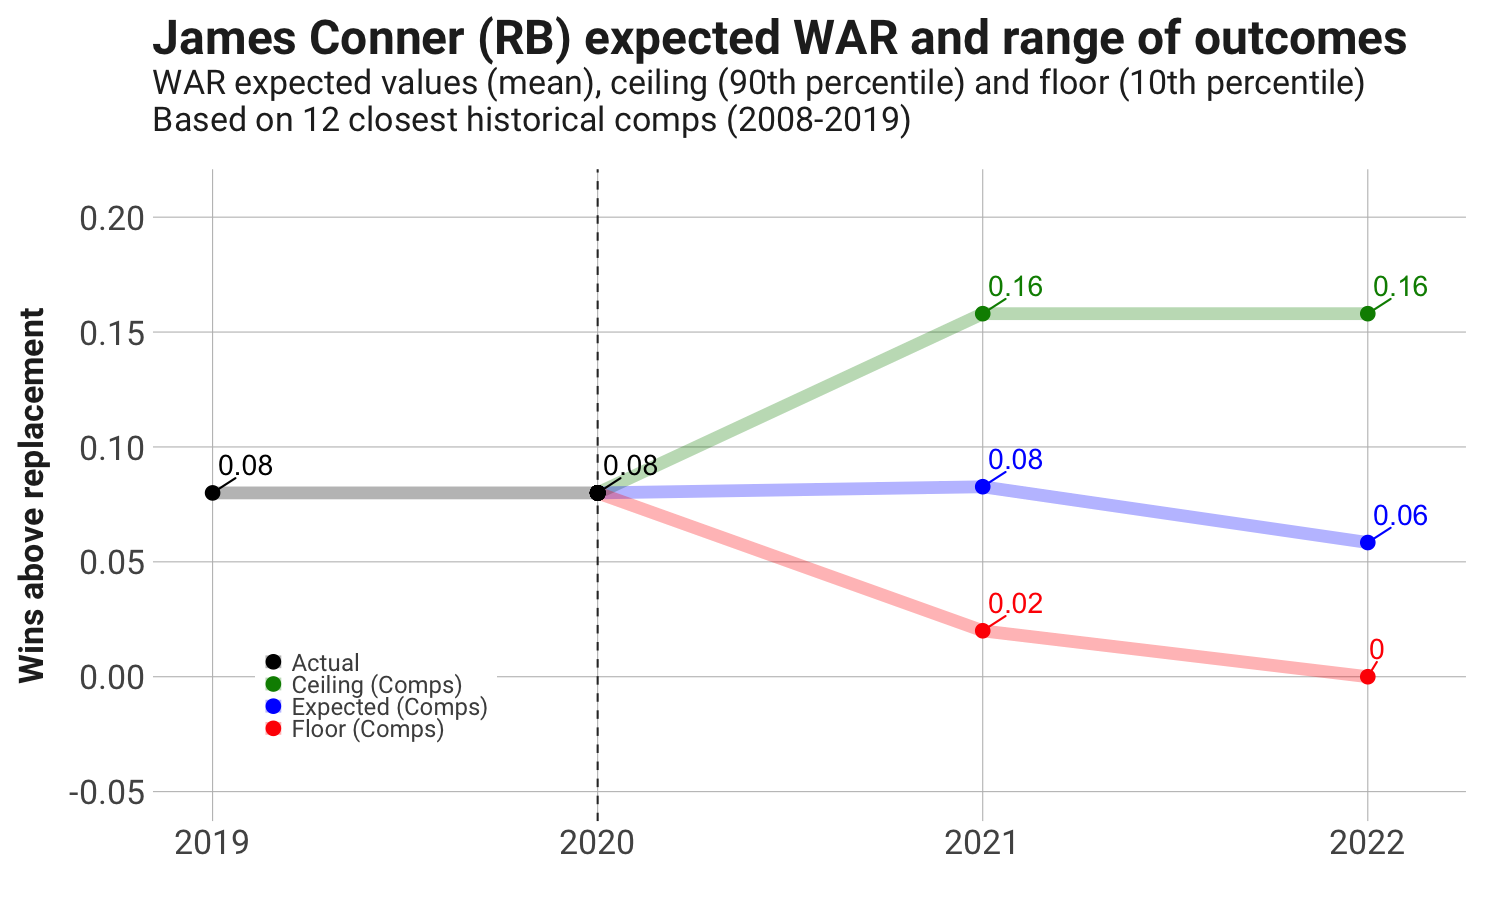
We see Conner getting a contract around $6 million, which looks good versus our projections. He might not be viewed as a top pickup this year, but he will be a solid choice at the right price.
| Outcome | 2019 | 2020 | 2021 | 2022 | Two-Yr Avg |
| Actual/Expected | $5.1 | $5.3 | $4.8 | $3.6 | $4.2 |
| Ceiling (90th) | N/A | N/A | $9.7 | $9.7 | $9.7 |
| Floor (10th) | N/A | N/A | $1.2 | $1.0 | $1.1 |
NO. 82: MIKE DAVIS
Davis broke out midway through last season after Christian McCaffrey went down with an injury, and he almost equaled the starter’s production. Davis ranked eighth in running back WAR in 2020 but outside the top 100 in four of his seven previous seasons. He is a bit on the older side entering his age 28 season.

We don’t know if Davis will get an opportunity and workload to produce as he did with the Carolina Panthers last season. But his ceiling projections are still attractive. Davis has at least some sample of showing he can be the workhorse for an NFL team.
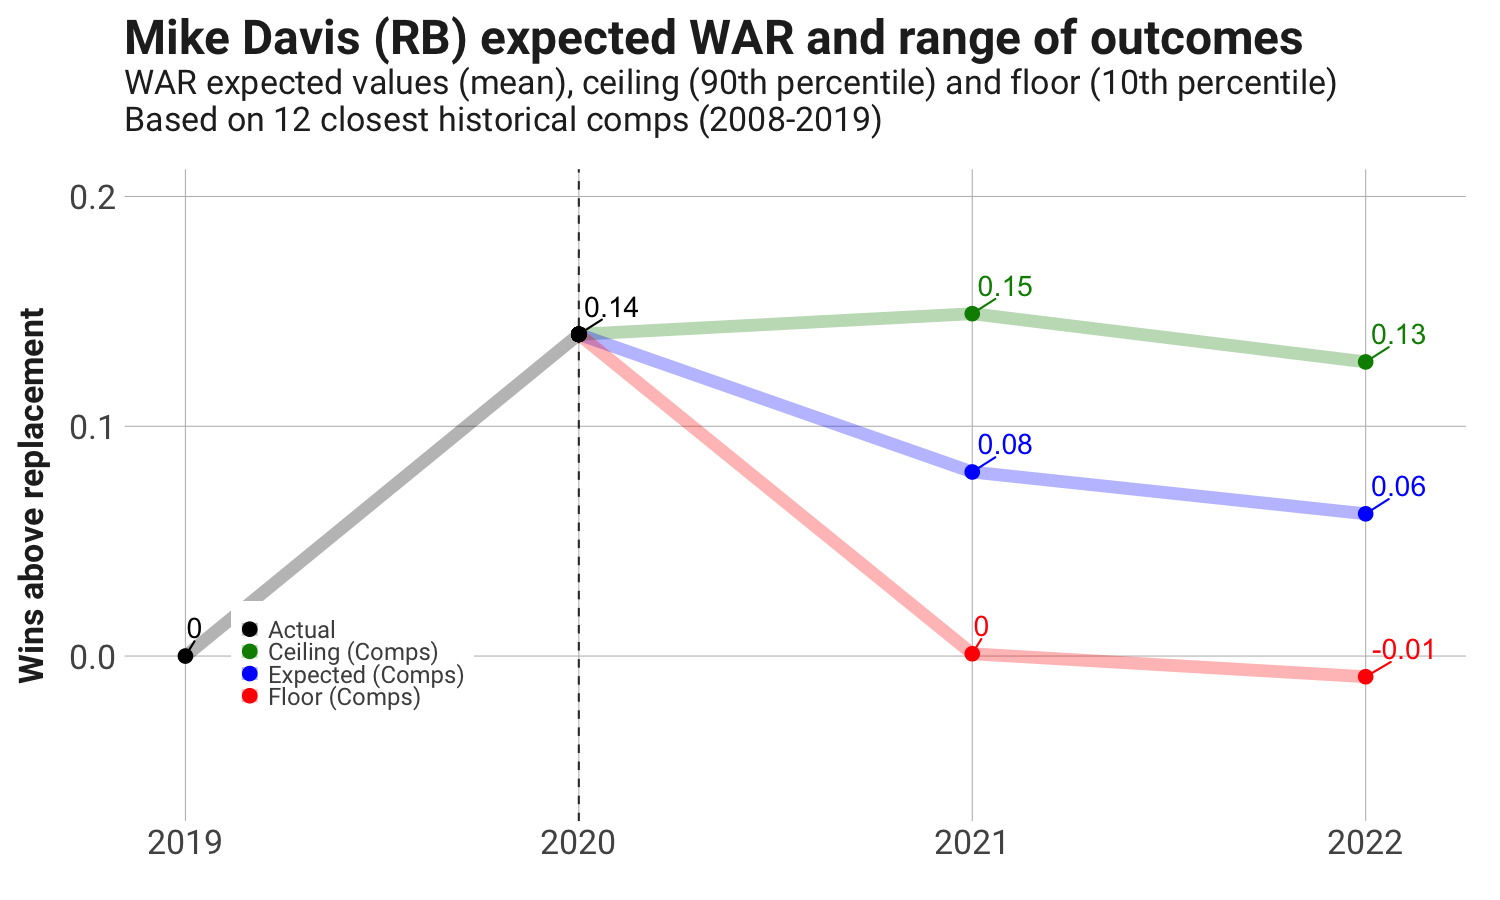
If a team can sign Davis for less than $5 million per season, that would be a valuable deal. The important thing with Davis is his ability to function in the rushing and receiving games.
| Outcome | 2019 | 2020 | 2021 | 2022 | Two-Yr Avg |
| Actual/Expected | $0.0 | $9.3 | $4.8 | $3.6 | $4.2 |
| Ceiling (90th) | N/A | N/A | $9.1 | $7.9 | $8.5 |
| Floor (10th) | N/A | N/A | $1.0 | $1.0 | $1.0 |
