NFL teams love to copy what successful teams have done in the past.
After the success of the Seattle Seahawk’s Cover 3 Legion of Boom in the early 2010s, many teams tried to emulate that, which is why that coverage is still a staple today in the NFL. After the Los Angeles Rams’ experienced the No. 1 defense in the NFL in 2020, many teams have adapted the Rams' two-high safety shell approach to their defenses in 2021.
In this piece, we can explore who has and hasn't shifted toward the Rams' 2020 coverage schemes.
Click here for more PFF tools:
Rankings & Projections | WR/CB Matchup Chart | NFL & NCAA Betting Dashboards | NFL Player Props tool | NFL & NCAA Power Rankings
With the NFL passing the mid-way point of the season, we now have a large enough sample size to evaluate a team’s schematics. The way we are going to do this is to run a K-Means Clustering algorithm to assign NFL defenses to clusters.
We take in a variety of factors that NFL play-callers use in their schemes and translate them onto a standard scale. We look at how frequently defenses play Cover 0, 1, 2, 2-Man, 3, 4, and 6 as well as how often they keep the middle of the field open (OPEN) and rotate their safeties from pre-snap to post-snap (ROTATE).
Related content for you: PFF Data Study: Coverage scheme uniqueness for each team and what that means for coaching changes via Tej Seth and Ryan Weisman
How a K-Means Clustering Algorithm Works
Once we have these factors on a standard scale, we run the algorithm. Picking the right predictors is very important, as each one has equal weight. A K-Means Clustering algorithm takes in a specified number of clusters (we chose six) and spreads each centroid into random locations across the same number of dimensions as the predictors. After this is done, the distance between a centroid and each team’s standardized predictor value is calculated, and then that team is assigned to the closest centroid. The centroid is then recalculated by computing the average value of each team’s value within the centroid, and this average is the new centroid. This is how we numerically assign NFL defenses to a cluster based on their coverage scheming.
In the figure below, we see the cluster makeups for each predictor. This tells us how many standard deviations away from the mean each centroid is for a certain cluster. The higher the number, the higher the usage.
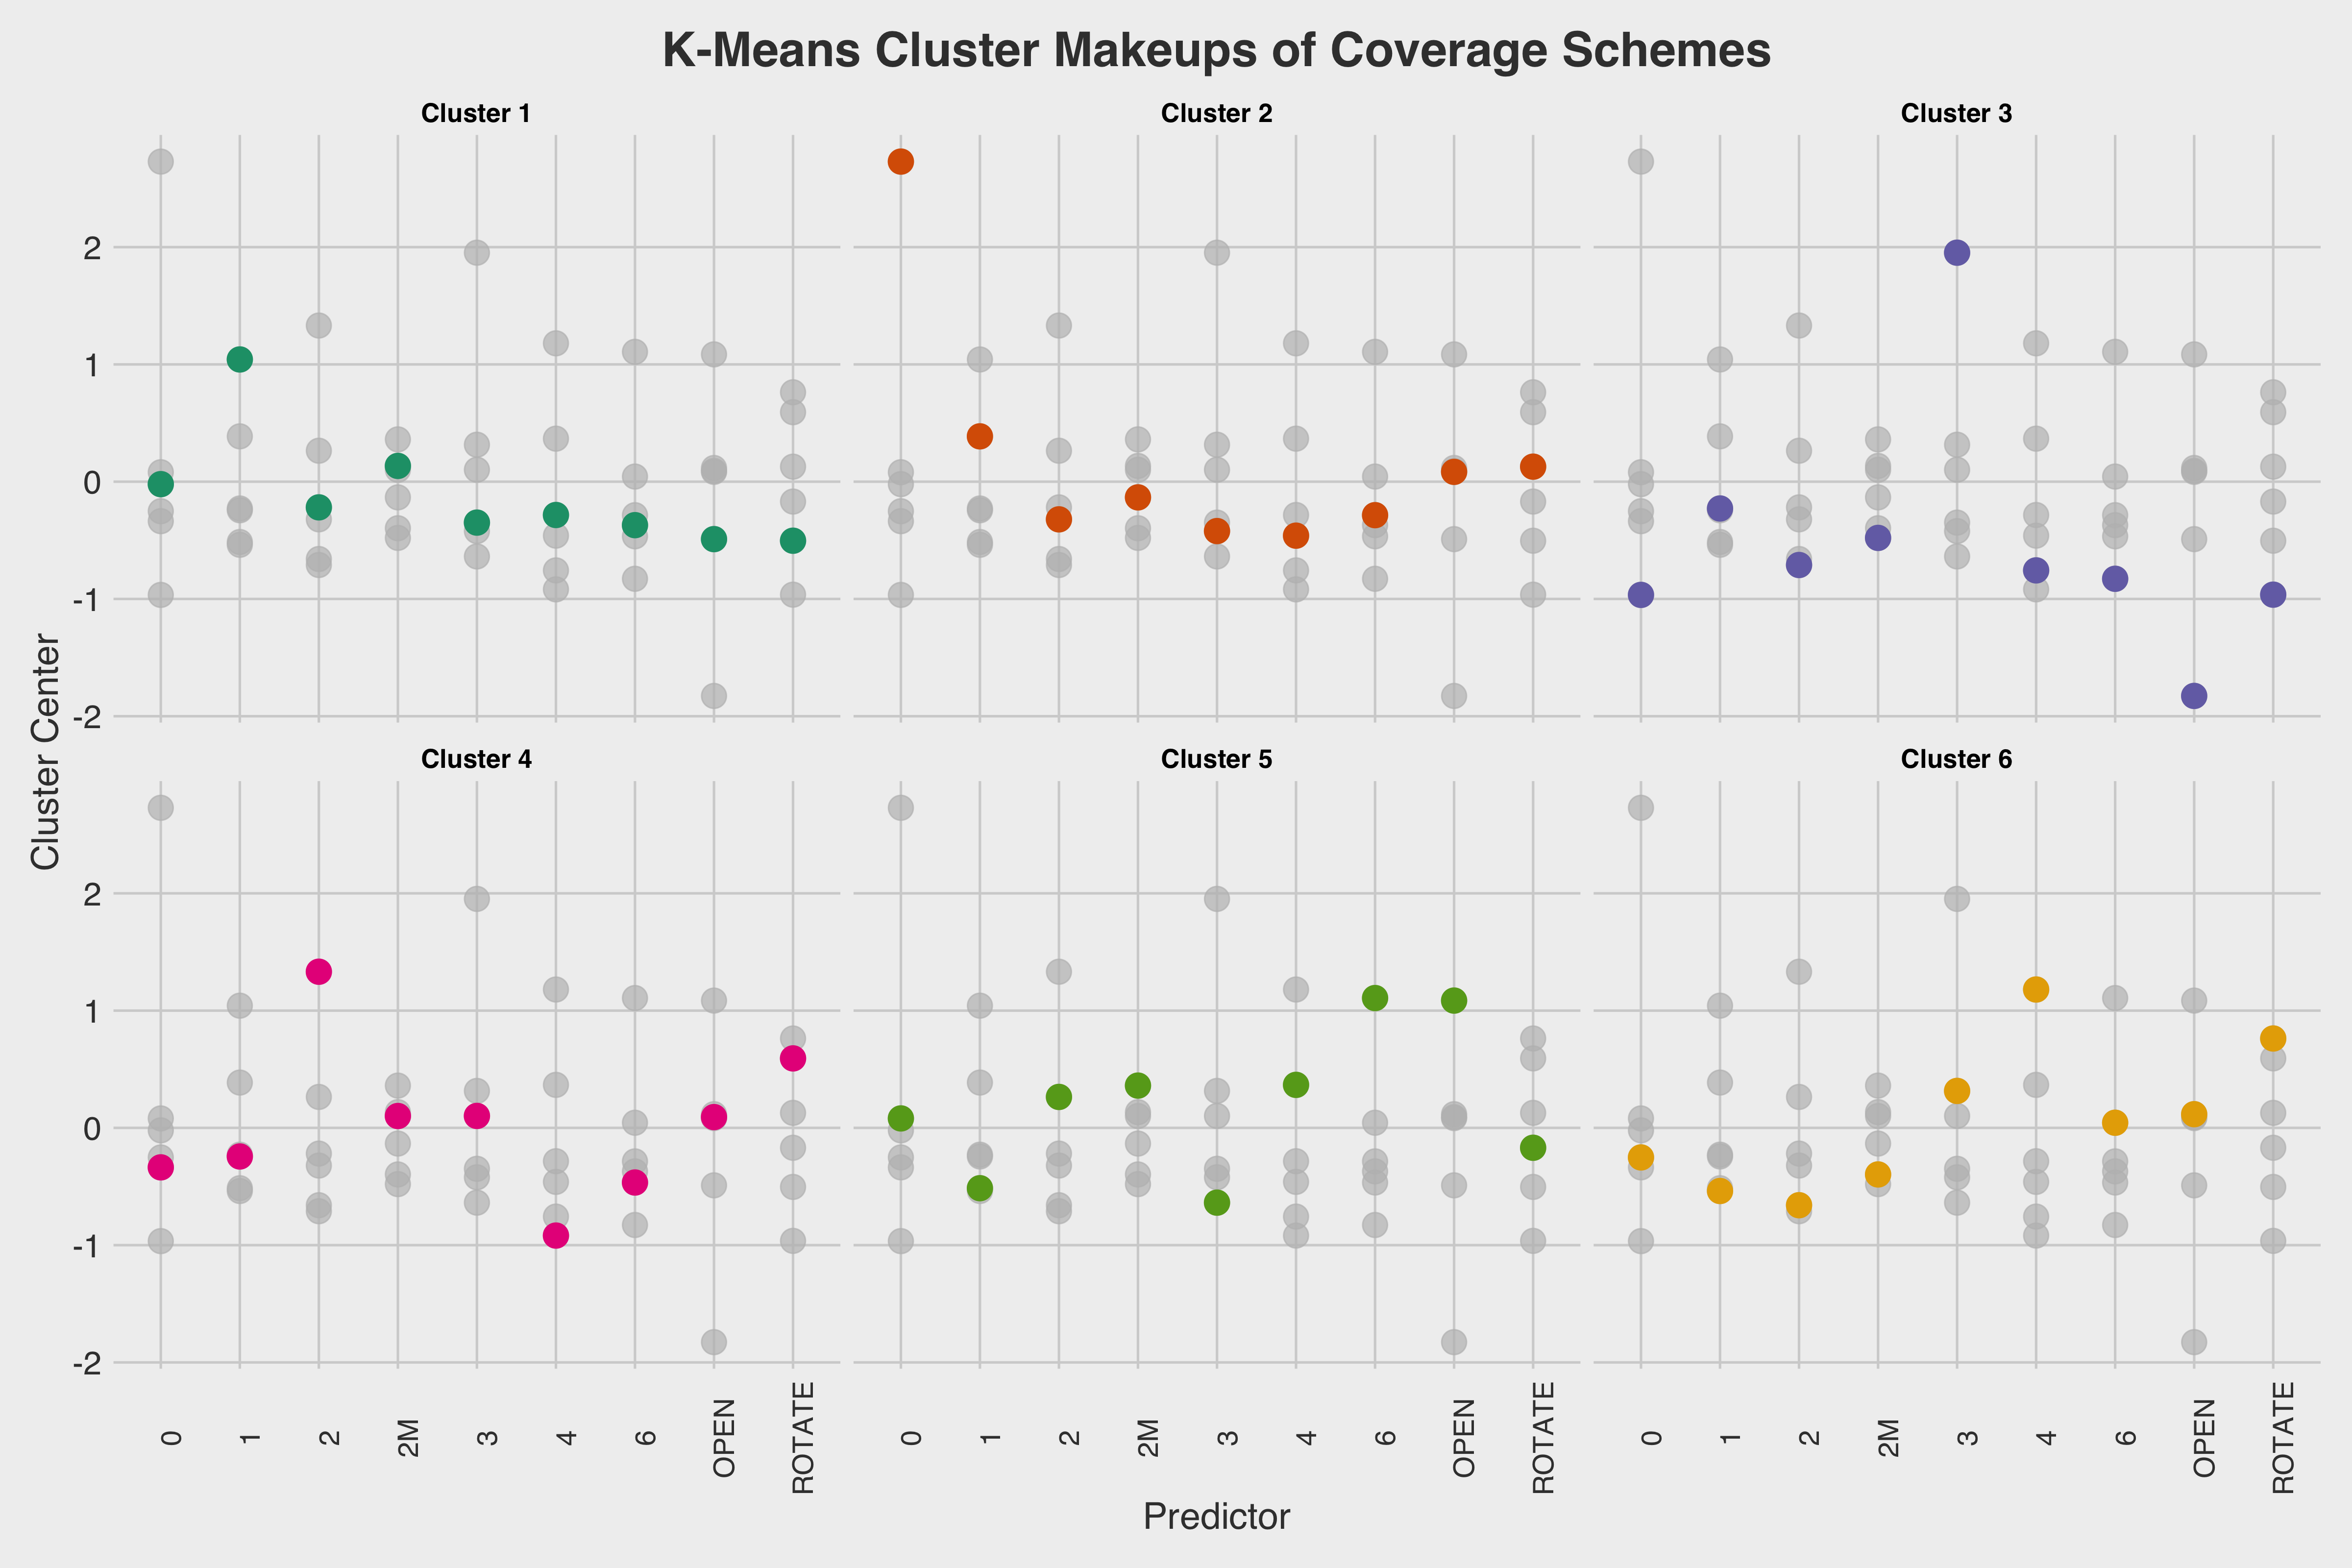
One could infer from this figure that teams in cluster 4 have the highest rate of cover 2, while teams in cluster 3 have the lowest rate of cover 1.
- Cluster 1: This cluster features the highest Cover-1 rate as well as the second-highest Cover-2-Man rate. Defenses assigned to this cluster have played a heavy amount of man coverage throughout the season. The New England Patriots fall into this cluster having the highest Cover-1 rate (40%).
- Cluster 2: Defenses in this cluster play the highest Cover-0 rate while keeping the rest of their coverage usage rates around an average level. A team that emulates this cluster is the Kansas City Chiefs, who play Cover 0 at an 11% rate — the highest in the league.
- Cluster 3: Zone-heavy teams are featured in this cluster. They have the highest Cover-3 rate, by far, and the second-lowest Cover-1 rate. They also have the lowest middle-of-the-field-open rate as well as the lowest rate of coverage disguises, by far. The only team that fits this cluster is the Las Vegas Raiders, who play Cover 3 at a 61% rate — 15% higher than the next highest team.
- Cluster 4: Teams that are assigned this cluster play the highest amounts of Cover 2 while playing the lowest amounts of Cover 4. The Atlanta Falcons fit this cluster perfectly, as they simultaneously have the highest rate of Cover 2 and the lowest rate of Cover 4.
- Cluster 5: This cluster features high usages of Cover 6 and Cover 4 as well as the highest middle-of-the-field-open rate. They also play the lowest Cover-3 rates. An example of a team that would fit this cluster is the Chicago Bears, who have the highest Cover 6 rate (25%).
- Cluster 6: Teams in this cluster have the highest rate of coverage disguises (the ‘ROTATE’ predictor) as well as the highest Cover-4 rate. We can call this the Brandon Staley cluster, as the Los Angeles Chargers and Rams disguise their coverage at very often.
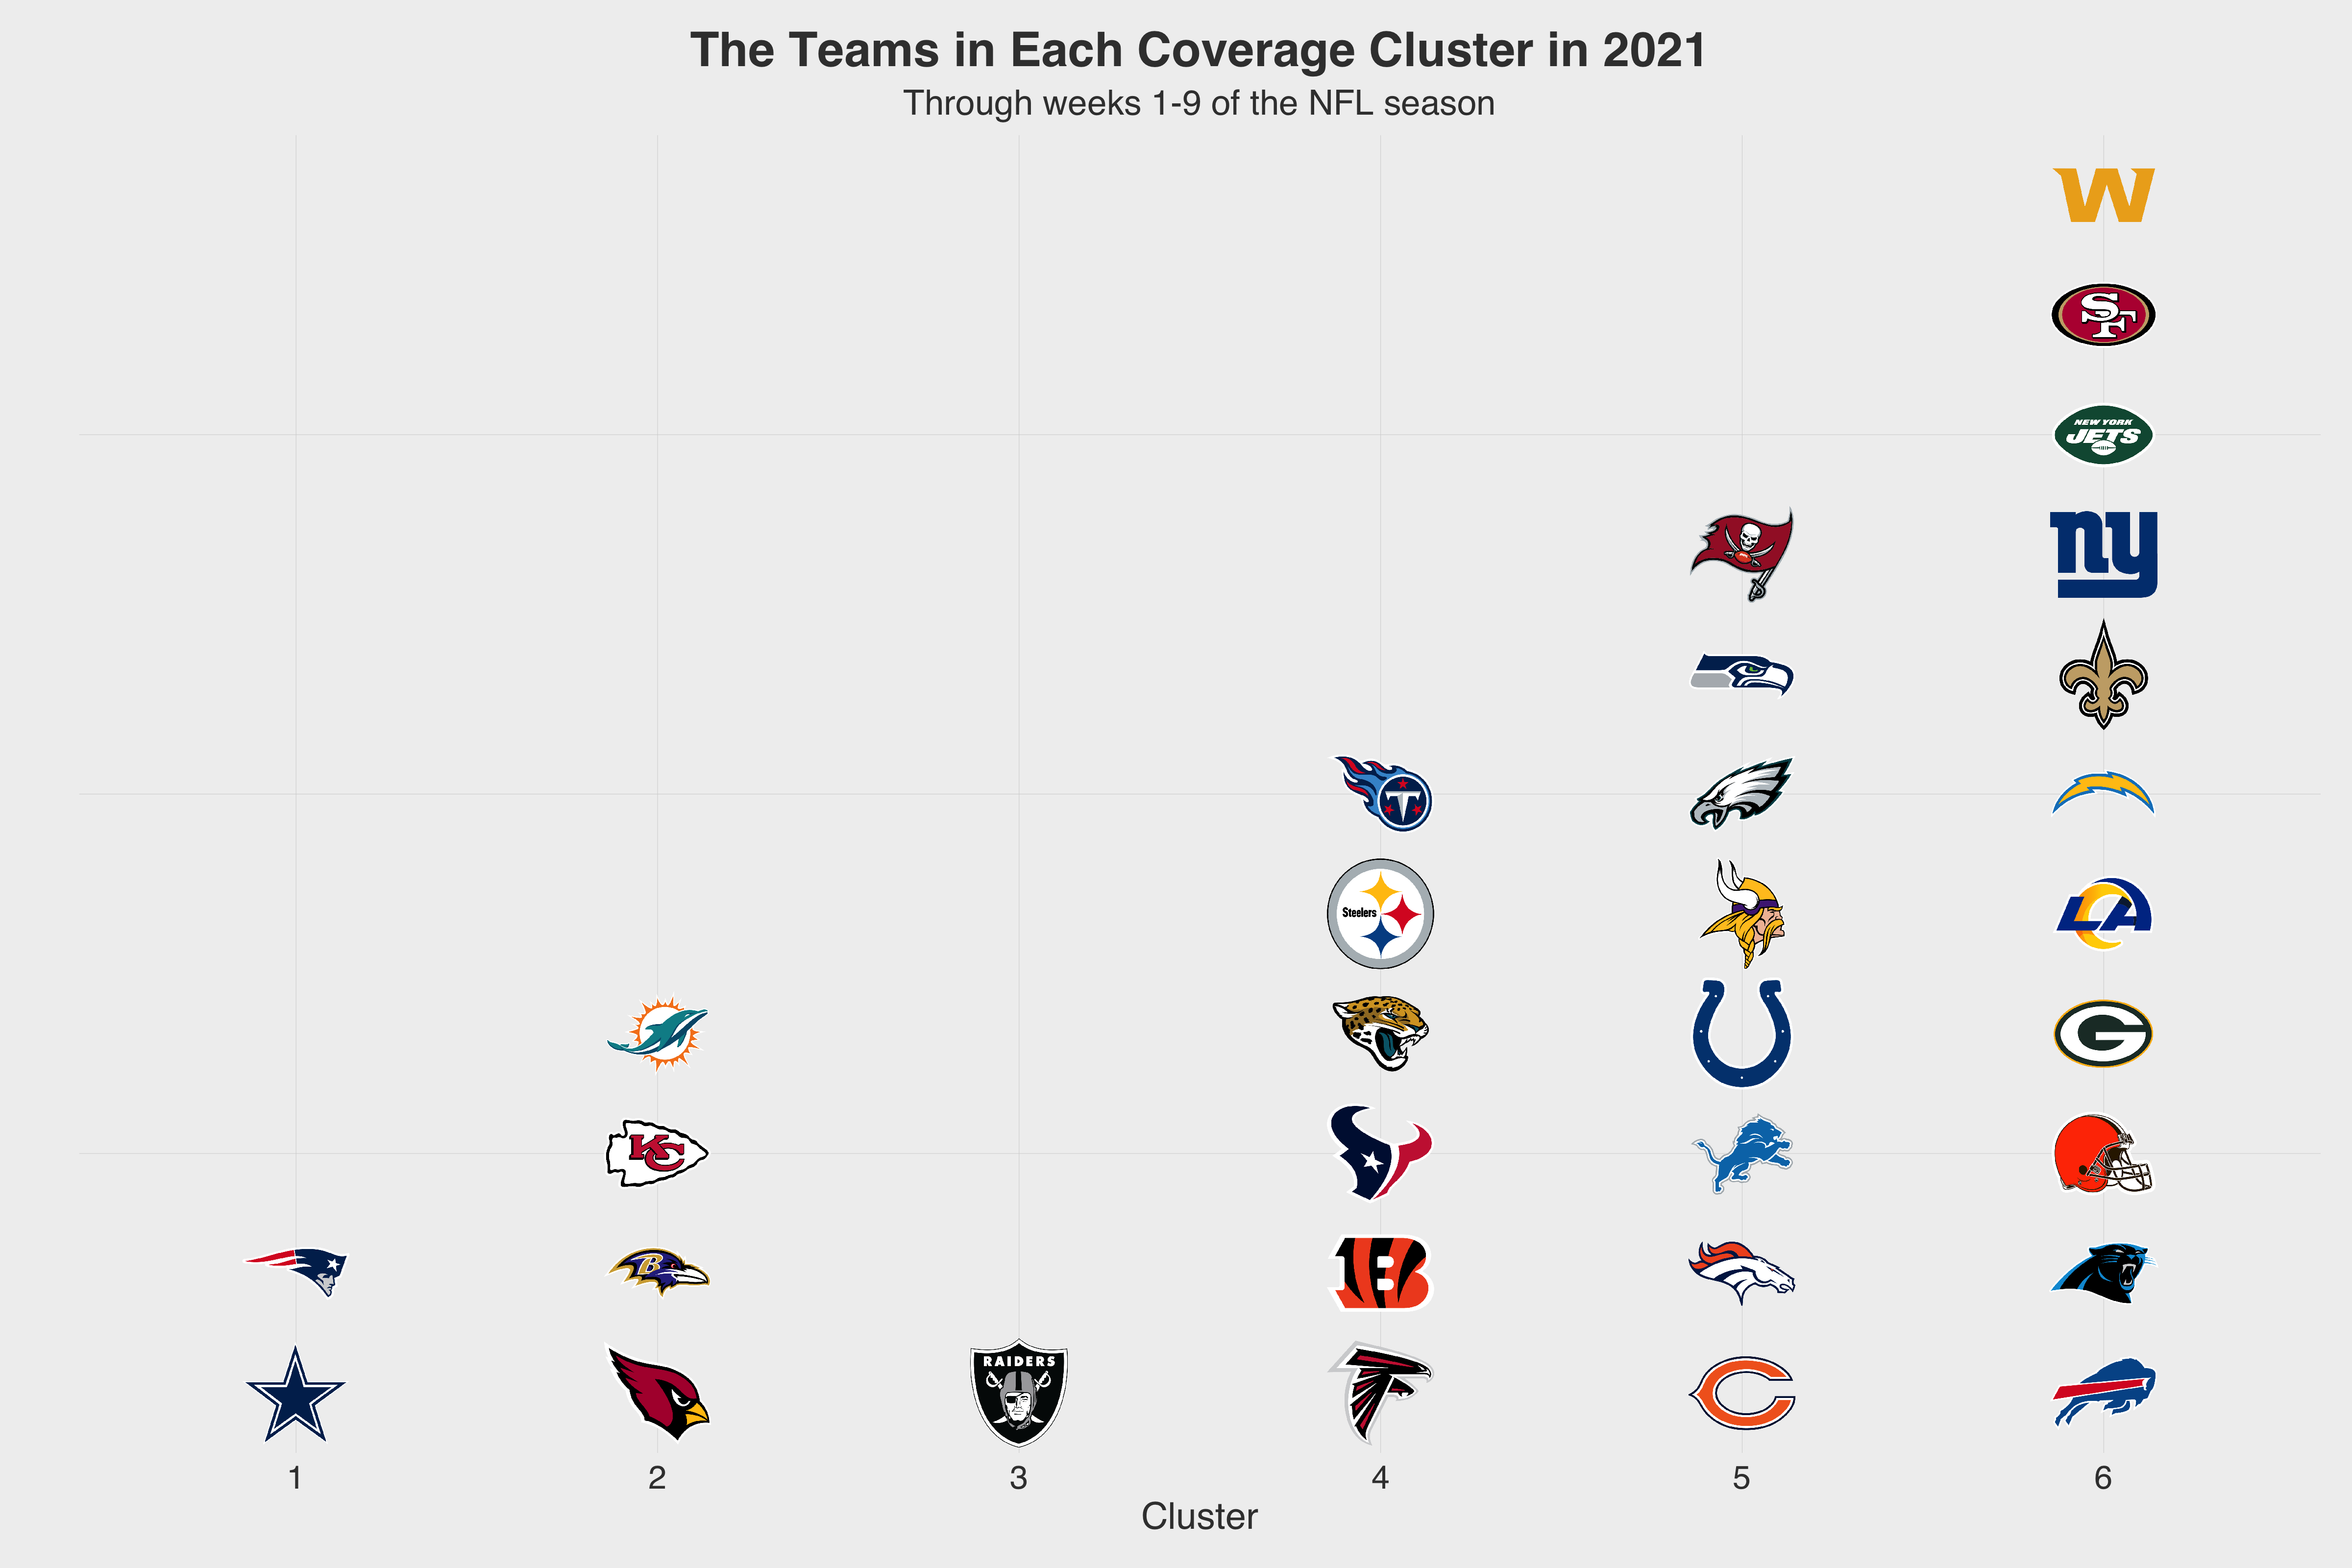
We can fully visualize each team’s cluster through this figure.
