We try to caution NFL fans every year that “winning” the offseason in March does not correlate with winning football games as cleanly as one would hope (in fact, there’s often a negative correlation — just ask New York Jets fans).
The very nature of unrestricted free agency in the NFL will always lead to teams “overpaying” for the best available players. That can largely be explained with one simple truth: Teams aren’t going to let the best players in the NFL reach free agency.
There are too many mechanisms in place (i.e., the franchise tag) for NFL teams to retain top talent if they want to, so when they choose not to, that should probably be something of a sign. Sure, a team is sometimes too cap-strapped to retain a player they truly want back, but for the most part, guys are free agents for a reason.
This isn’t to suggest that teams should never spend in free agency, but they should have a better understanding of what they’re likely acquiring when they do.
Subscribe to
Historical success
The biggest misnomer with free agents is the expectation that the player will consistently produce at the same level as the year prior to signing. We often see guys elevate their play in contract years, and while we aren’t suggesting this has anything to do with effort levels, the data backs up the idea that players often perform at their best when they’re working toward a new deal.
We decided to go back and look at big-ticket free agent production to see if we could identify any trends that may help inform our expectations going forward. We limited the focus to the year prior to signing and then the three following seasons. It’s rare that a free agent plays into the fourth year of a contract, and no team is ever signing a guy hoping he breaks out four years later.
Looking at free-agent signings from 2013-17, the goal was to use the 10 largest contracts (by average per year) at each position in each year. For some offseasons at positions with fewer starting jobs (center, quarterback, etc.), we set a minimum contract value so we weren’t including near-minimum signings in our sample of top acquisitions. To be clear, we’re looking at the pricey additions that generate headlines and excitement — not roster-fillers.
In total, our sample includes 464 free agent signings over five years — good for roughly 93 signings per offseason spread out across twelve positions (excludes special teams). By far the smallest cohort is at center, with just 13 total qualifying contracts. However, every other position had at least 35 out of the maximum 50 over five years.
The first thing we wanted to examine is how a player’s production in the three years after signing compares to the production in the year prior to signing.
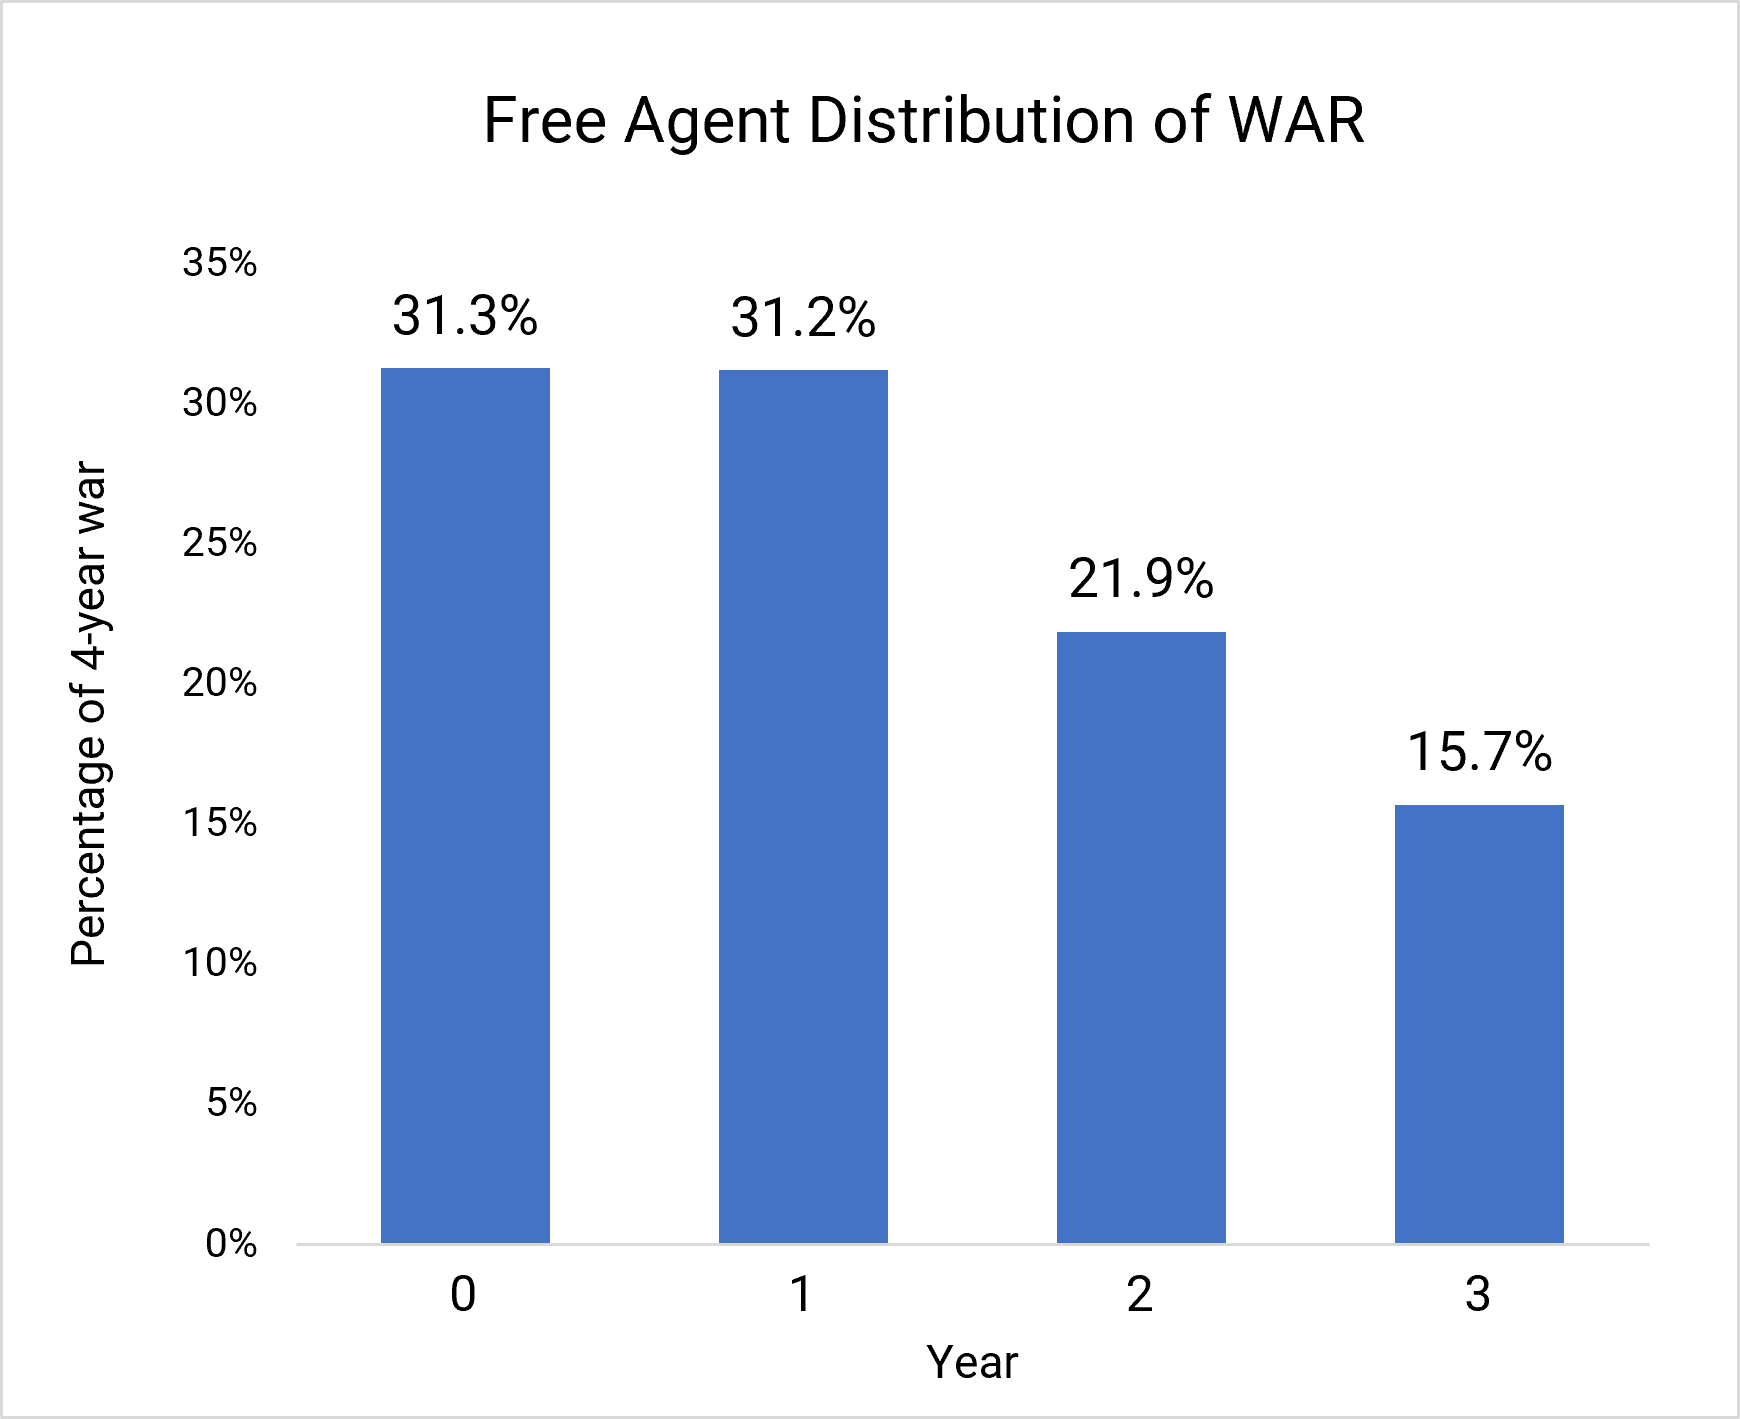
Above is the percentage of the total four-year wins above replacement figure (WAR) for all 464 free agent signings in each season. As you can see, even though it’s by a razor-thin margin, the year prior to signing (Year 0) makes up the largest portion of four-year WAR, at 31.3%. The first year of the new deal comes very close to matching that production, but then it falls off a cliff.
Looking at this on a granular level to illustrate how there aren’t a few players skewing the averages, 47.6% of free agents registered a higher WAR in the first year of their new deal than they did in the year prior to signing. So there was roughly a 50-50 shot that when a team signed a player, they got that level of production again in the first season with the new club.
Those odds aren't bad at all if you consider the context of free agency as we discussed above. However, big-ticket free agents don’t sign one-year contracts.
In the second year of the contract, the percentage of the total WAR drops almost 10 percentage points. Again looking at Year 2 on a case-by-case basis, less than 32% of free agents have a better Year 2 for their new team than Year 1. That means over two-thirds of top-of-the-market free agents will have their best season with the new team right away.
Broken down by position
Are these trends consistent across positions? Or are there perhaps different adjustment periods to a new system depending on a player’s role?
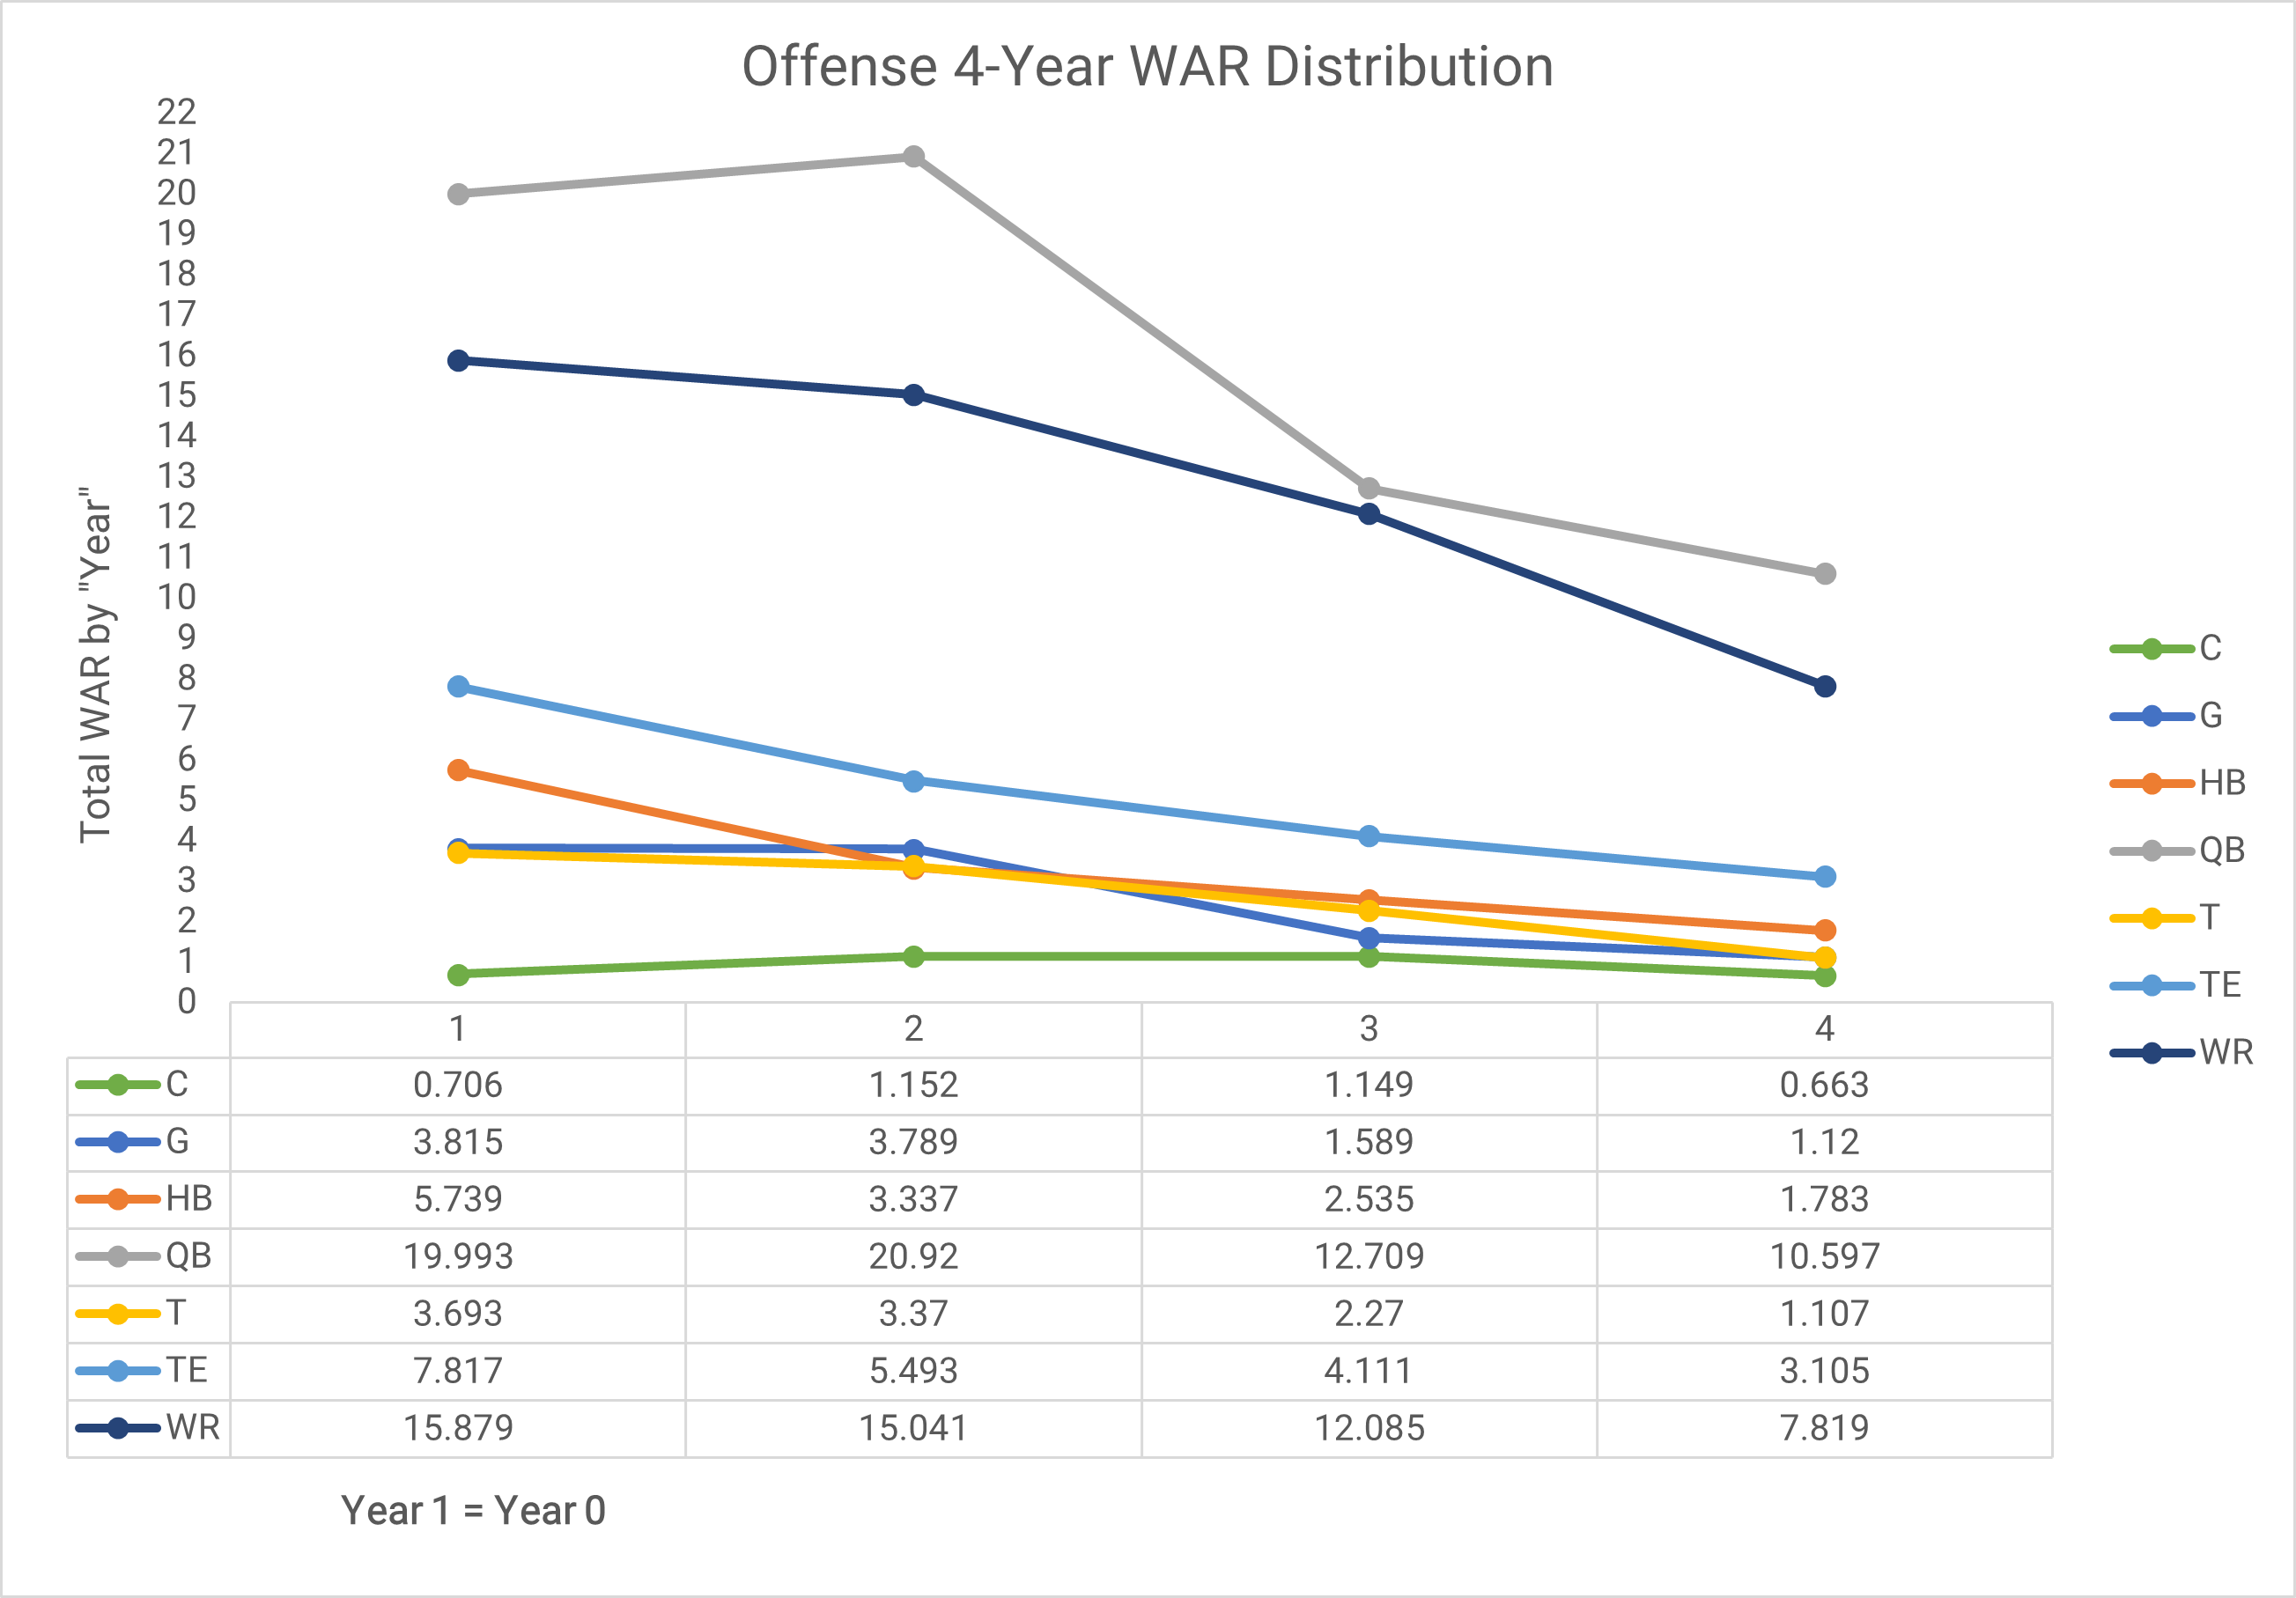
Here’s the breakdown for each offensive position:
And here’s the same for defense:
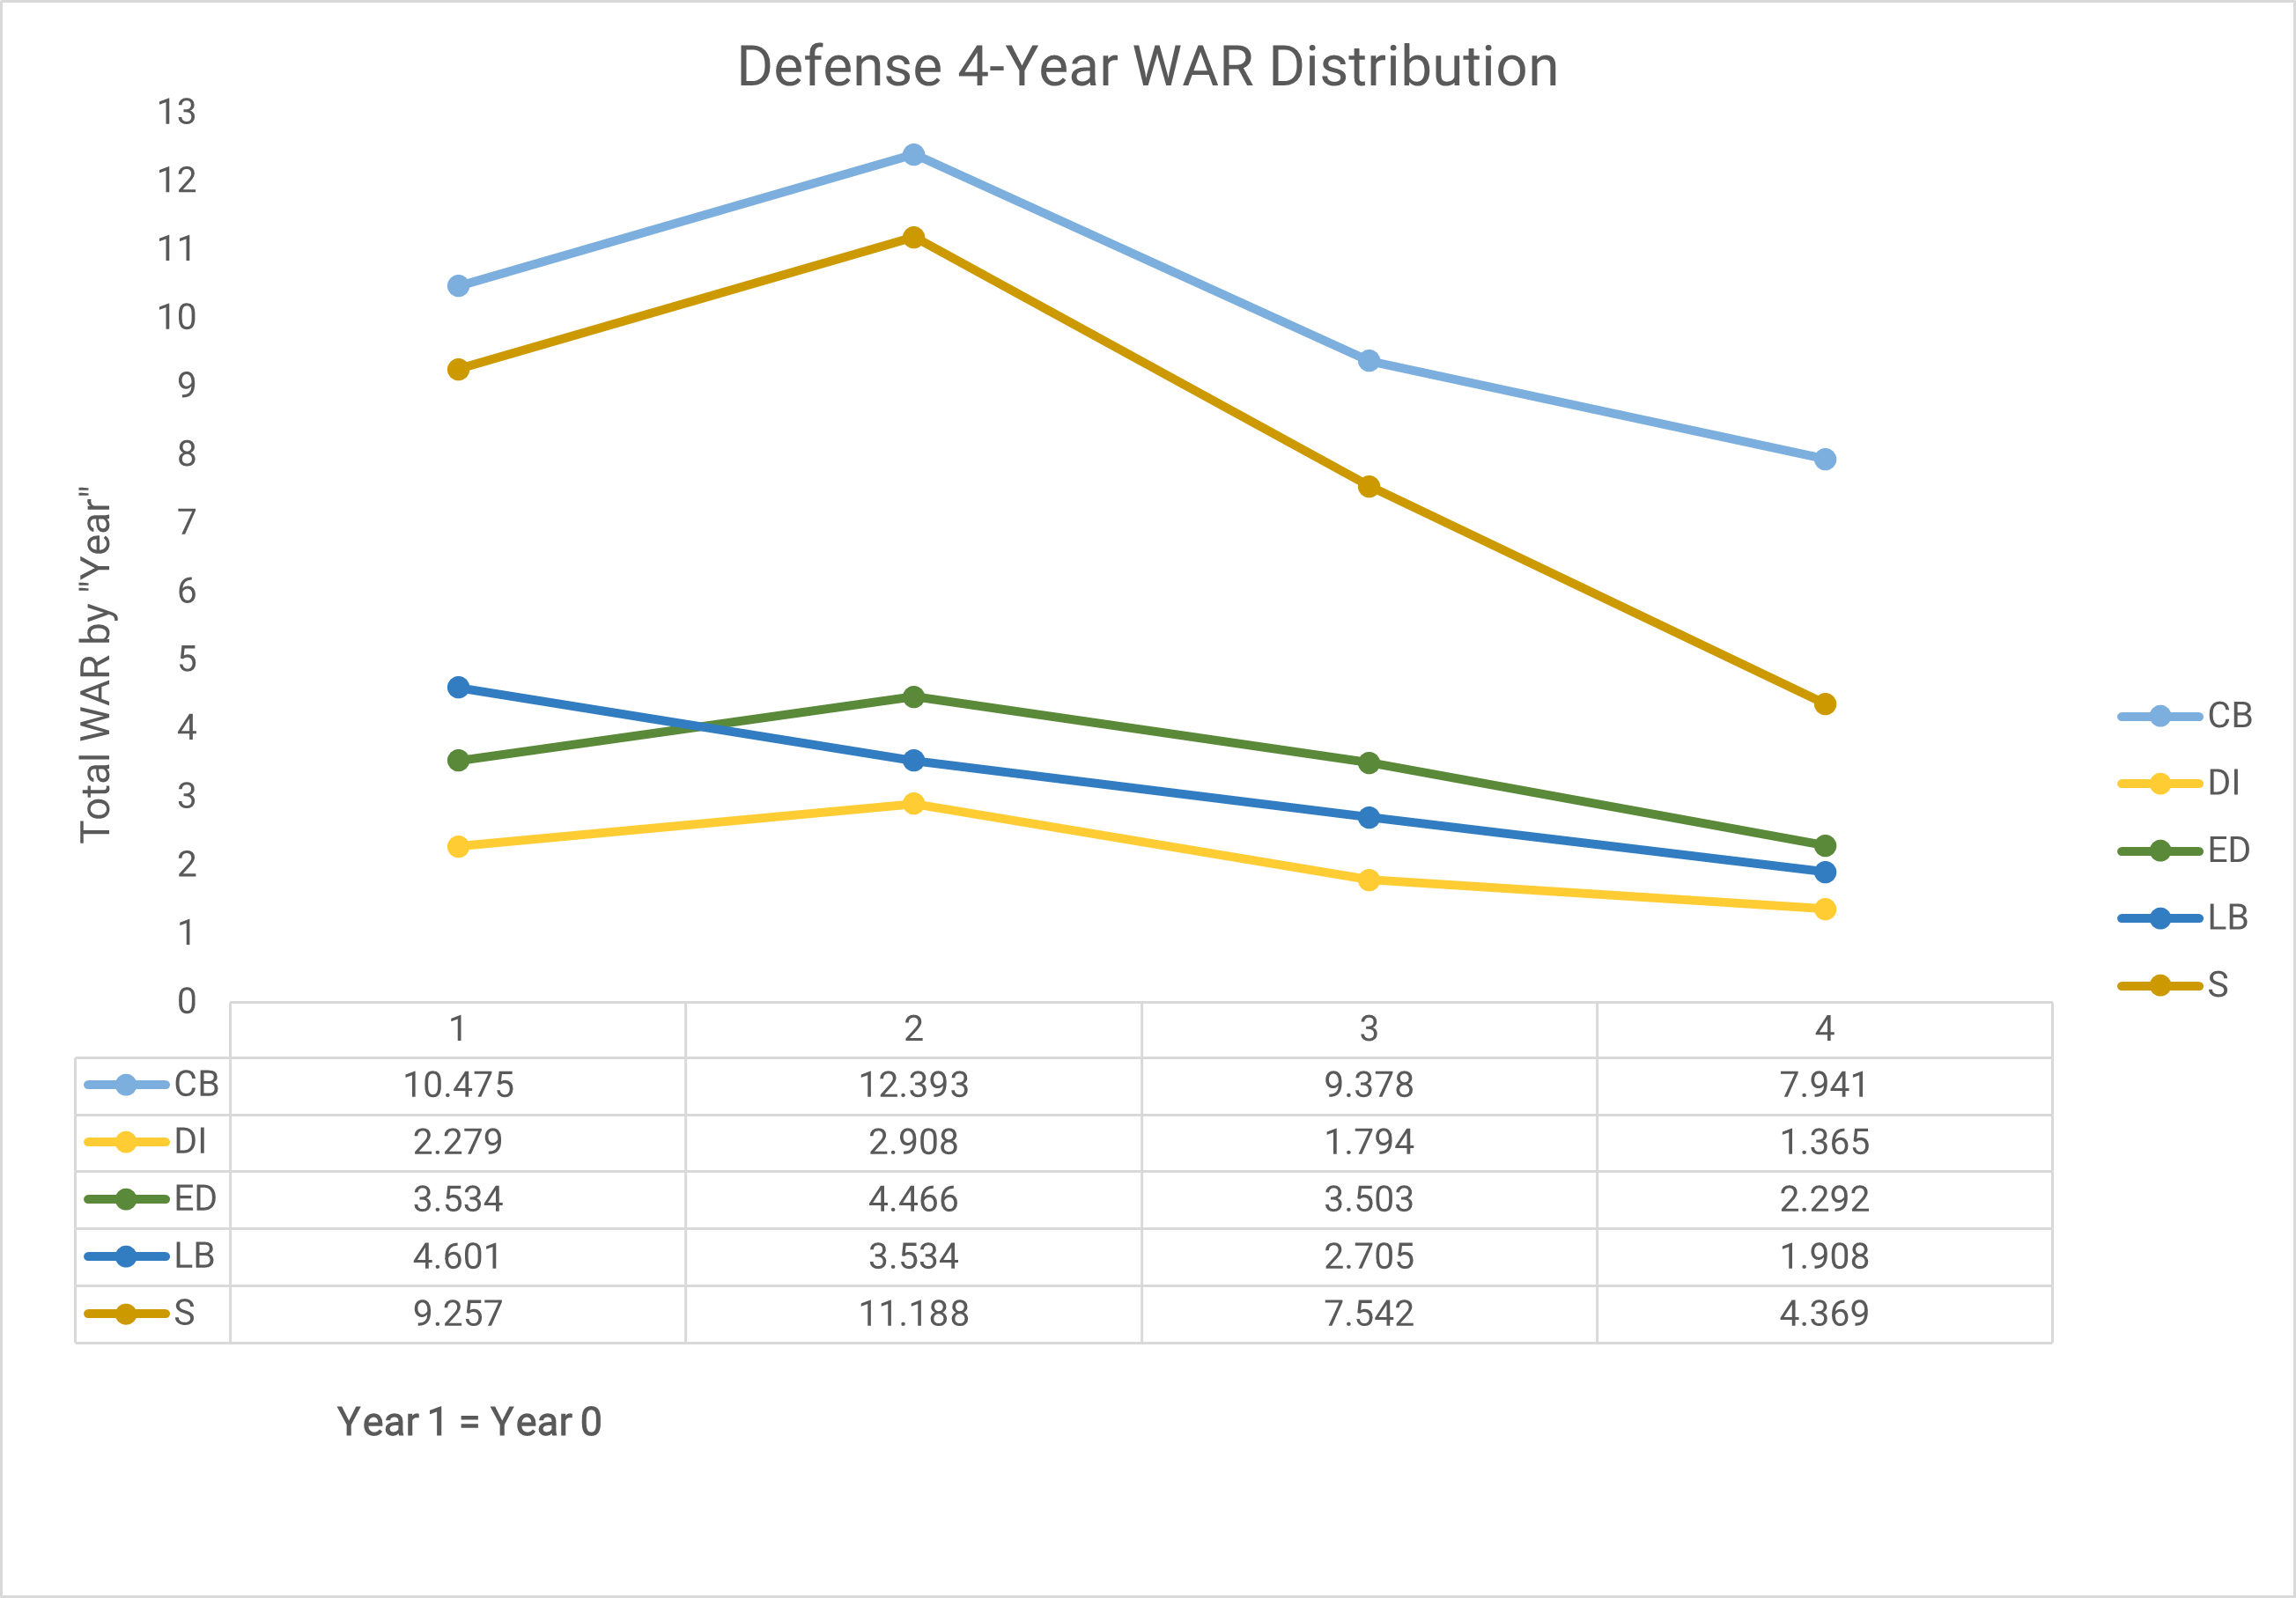
We see here that cornerbacks and safeties as a collective tend to outperform the season prior to signing in their first campaign with a new team, making them one of the better investments in free agency.
To once again examine these results on an individual basis, and to perhaps parse out learning curves for certain positions, we compared each player’s Year 1 WAR with Year 2 and Year 3 instead of looking back at the year prior to signing.
| Position | Y2 > Y1 | Y3 > Y1 |
| C | 38.5% | 30.8% |
| CB | 48.7% | 28.2% |
| DI | 26.2% | 19.0% |
| ED | 28.6% | 19.0% |
| G | 11.4% | 20.0% |
| HB | 37.5% | 25.0% |
| LB | 27.5% | 22.5% |
| QB | 25.7% | 17.1% |
| S | 35.0% | 10.0% |
| T | 35.1% | 21.6% |
| TE | 33.3% | 20.8% |
| WR | 35.6% | 11.1% |
| Total | 31.90% | 19.83% |
As shown, at no position was it more likely for a free agent to have a better second season with their new club than their first. Cornerbacks were close to a tossup at 48.7%, and they also had the second-highest rate of third seasons better than the first season, at 28.2%. Nevertheless, it's clear that the first season after signing, in general, will make up much of the reward.
A final note on the use of WAR as our barometer: We know from studying free agency that there is a strong correlation between PFF WAR and contract values, so presumably if teams are allocating resources in line with WAR, they also expect to be paying for that level of production to continue.
Should high-floor players be the goal?
At only two position groups in the sample was there a “Year X” in which more players were at or below replacement level than above. Only in Year 3 for running backs and guards were there more at or below replacement-level players than above — at every other position, the majority was positive in each year.
To use cornerbacks as an example: Among all cornerbacks in their Year 1, Year 2 and Year 3:
- 0/39 in Year 1 were at or below replacement level
- 6/39 in Year 2 were at or below replacement level
- 11/39 in Year 3 were at or below replacement level
At a position with as much volatility as there is at cornerback, the breakdown here demonstrates quality pro scouting.
This is an impressive finding for teams, even given the fact that the sample chosen (high-priced free agents) is by design supposed to consist of good players. Teams obviously aren’t looking to pay for slightly above replacement-level production in free agency. However, there is certainly value in high-floor players who tend to provide consistently baseline production at worst. This is especially true at premium positions, such as wide receiver, where making a consistent impact can provide tremendous value and open things up for other players on offense.
If teams can identify high-floor players in the middle to upper-middle tier of free agency, that could be one piece of a successful team-building strategy. The draft provides the opportunity for high-upside dart throws that can become special talents, and if teams can surround those players with consistently average to above-average players on veteran contracts that aren’t too substantial, they can build out a cost-efficient roster.
