Football is a noisy game. And as such, it's not always easy to discern what is happening on the field and how each action, in conjunction with other things, leads to winning.
Perhaps the best aspect of salary cap/contract research is that the data points are provided directly from NFL front offices. Every time these multi-billion-dollar organizations make multi-million-dollar decisions, they're telling us exactly how they value players, and this adds to our understanding of the game.
Does every investment always work out? Of course not. But every offseason, hundreds of veterans sign free-agent contracts or extensions, and water always finds its level. However, whenever people are forced to place a single value — or, in the case of contracts, a single set of terms — on a single player in a convoluted game, there is going to be disagreement when it comes to the value of his contributions.
Subscribe to
Herein lies the beauty of having a 32-team monopsony (single-buyer) market structure with a hard salary cap. The allocation of a limited supply of resources over an extended period will eventually lead to agreement on positional market values.
For the teams, this is obviously beneficial because it provides something of a ceiling for each position. Their job then simply becomes finding the best values within the established market.
That's where we come in. Before joining PFF, I co-authored a book with Jason Fitzgerald — our good friend at Over The Cap — that centered around creating a way to compare the contractual value between every player at each position. What we came up with was a relatively simple metric: Percent of top-five APY, or T5APY.
T5APY is calculated as such:
X player is a wide receiver
The top five highest-paid wide receivers in terms of average per year currently earn $22M per year, $20M, $19.25M, $18.171M (A.J. Green franchise tag, which we include) and $18M.
The average of those five figures is $19,484,200. Thus, the wide receiver T5APY is $19,484,200
If X player signs a four-year, $40 million contract, his average per year is $10 million
$10,000,000 / $19,484,200 = 51.32% T5APY
Player X has a T5APY of 51.32%
A 50-70% T5APY player would fall into the category of “second-level starter.” To provide an example, Robby Anderson signed a $10M APY contract at WR this offseason.
We ran this calculation for every free-agent signing from 2014-19, thousands of data points over six years.
You can nitpick the notion that NFL teams properly value each player, but over the long haul, they are not going to consistently throw tens of millions of dollars at bad players. There is very clearly a correlation between the amount of money a player earns on a per-year basis and the quality of that player.
No one contract metric is perfect — including APY — but the NFL community has effectively made APY the comparative metric through media reporting of contracts and how players stack against each other.
The next challenge naturally became, how can we predict these T5APY values based on player production?
Enter PFF WAR. When NFL agents prepare for an upcoming negotiation, they tend to focus on the two to three seasons prior when compiling their player's stats.
In a similar vein, we decided to look at the two-year cumulative PFF WAR for every player at each position before signing an unrestricted free agent contract or an extension.
So, for every player who signed in the 2016 offseason, we would look at their 2014-15 PFF WAR. We then ranked each player at each position by that two-year WAR value and finally took their ranking as a percentage of the total at the position (had to have logged at least one snap over the two years to be included). For example, if you were the NFL's No. 2 wide receiver in terms of PFF WAR, you'd be considered in the 99th percentile.
Without making a single adjustment, we wanted to see how close two-year WAR percentiles get you to predicting T5APY values. We grouped each WAR percentile across all (non-special teams) positions and then found the average T5APY for each percentile group. Here are the results:
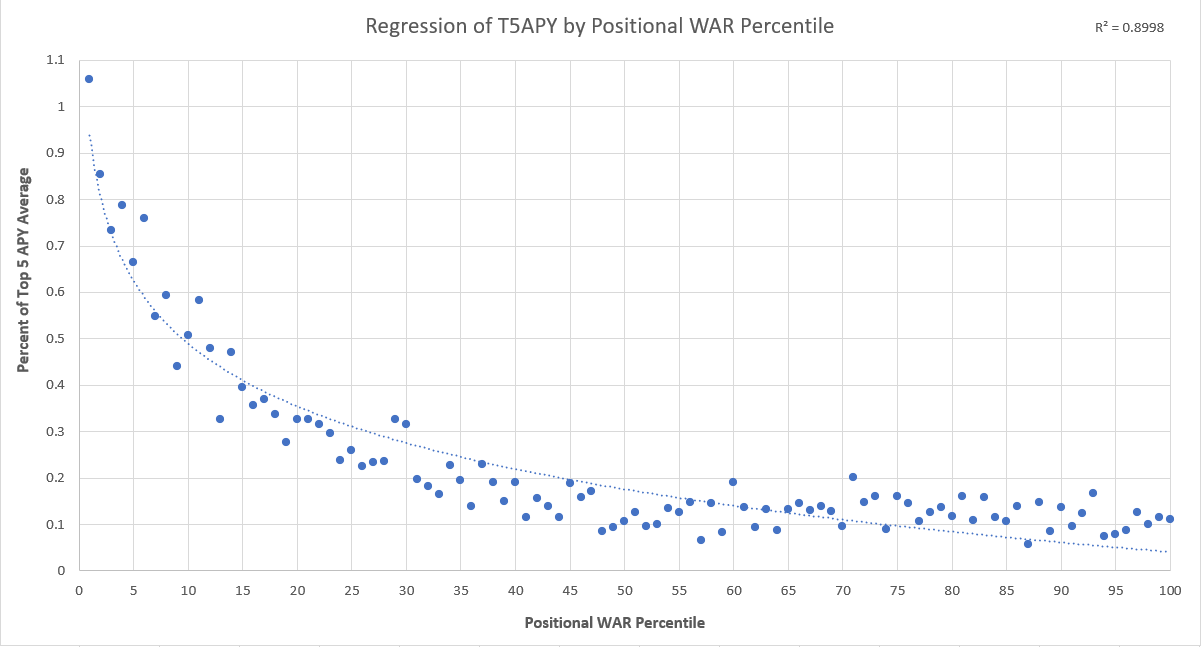
Two-year PFF WAR percentiles do a pretty remarkable job of identifying the players who deserve top-dollar at their respective position.
The next step was to begin adjusting the PFF WAR percentiles to better reflect the NFL marketplace. There are dozens of off-field variables that will impact how much a team is willing to pay a player, but we turned our attention to two obvious factors: age and draft status.
We found (not surprisingly) that younger players will earn more when PFF WAR percentiles are equal. It is also clear that teams struggle to get a player's draft position out of their minds, no matter how many years it has been since that draft and no matter how much bad tape that player has produced.
The last big adjustment we wanted to investigate was fun for several reasons because it challenged our priors a bit on positional value.
We here at PFF have been pounding the table for a few years now that coverage is more valuable than pass rush. So, after quarterbacks and wide receivers, cornerbacks and safeties have the highest WAR potential. So then how can the highest-paid cornerback and safety — Darius Slay at $16.683 million per year and Eddie Jackson at $14.6 million per year, respectively — earn more than $10 million less per year than Joey Bosa, who is set to receive $27 million per year under his new deal?
PFF WAR provided one key market insight that is reasonably intuitive: scarcity is a big driver of value. We simply took the top five players at each position according to two-year WAR and then found their average.
We then did the same for No. 6 through No. 10. The sixth- to tenth-best safeties had a two-year PFF WAR average that was just under 90% of the top-five safety average. This was by far the highest of any position, and it was followed by … you guessed it … cornerback.
Also unsurprisingly, edge rusher, interior defensive line and offensive tackle were near the other end of the spectrum.
This isn't the be-all and end-all, but it certainly helps to explain why it has been such a challenge for the NFL's top defensive backs to get paid top-dollar. If you're an NFL team that can get 90% of a top safety's production for maybe 75% of the price tag, you won't always feel inclined to allocate a lot of money to that position, even with how much more value they could potentially bring than a player at another position. We also know that edge-rush play is generally more stable from year to year compared to the play of defensive backs.
Teams love high-floor, safe investments. When you factor scarcity and stability into WAR values by position, it helps illustrate why the position markets are the way they are. After some tweaks to accommodate for age, draft status and position market, here is the adjusted chart:
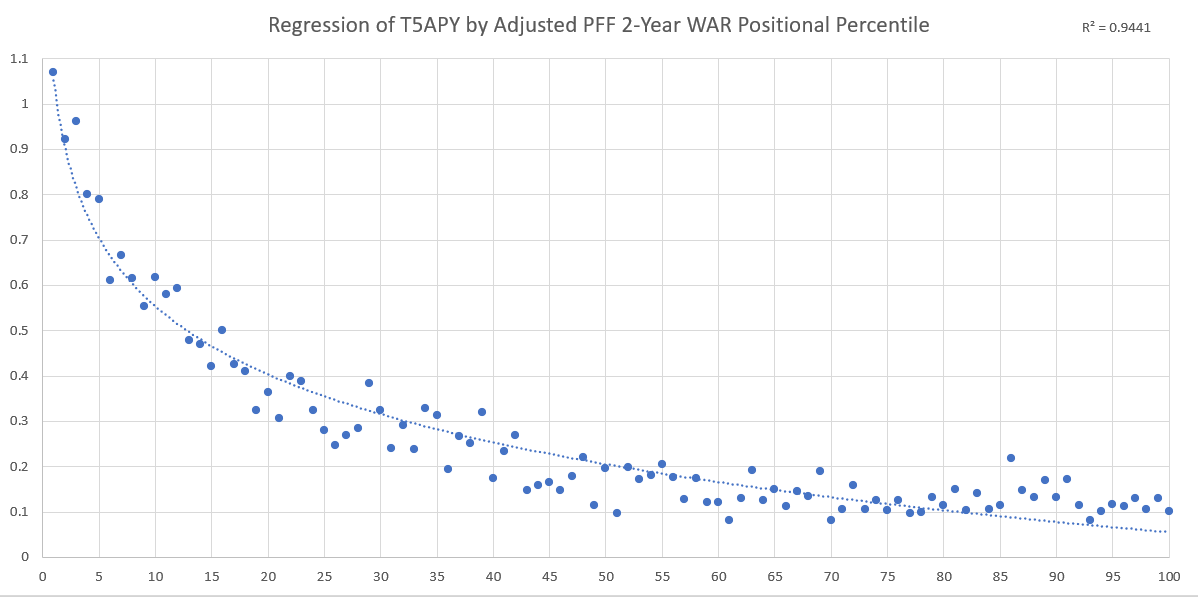
There is still work to be done, but by using some of this information and manipulating it a bit further, we can arrive at a pretty solid projection for the average-per-year of a given player's contract.
There are many directions to take this research, but our first inclination was to look at the biggest discrepancies between our projections and a player's true contract to see what we can learn. Here are some of the bigger disagreements over the past few years.
Players who deserved to get paid much more
CB Casey Hayward, Los Angeles Chargers — 2016
Back in 2016, Hayward signed a three-year, $15.3 million deal, with the $5.1 million average per year equating to about 36% of T5APY at cornerback. Two years later, he signed an extension for $11.4 million per year, about 80% of T5APY at cornerback. At the time, Hayward was likely being paid for his ability as a slot cornerback, a role that he excelled in during his time in Green Bay, but now that he's one of the best outside corners in the game, his value is immense.
S Tre Boston, Arizona Cardinals — 2018
Boston signed a one-year, $1.5 million deal that equated to about 13% of T5APY at safety. The Panthers signed him for cheap again the following year, and though he still got a raise to $2.125 million for 2019, this was our 32nd-ranked underpay from 2016-2020. Boston signed a three-year, $18 million contract this offseason, good for almost 43% of T5APY. And yes, we still think he's a bit underpaid.
Players who got overpaid
LB Alec Ogletree, Los Angeles Rams — 2017
In 2017, Ogletree signed a four-year, $42 million extension with a $10.5 million average per year that put him among the highest-paid off-ball linebackers in the NFL. The Rams traded him to the New York Giants six months later and now remains unsigned after two years with New York.
T Donovan Smith, Tampa Bay Buccaneers — 2019
We got a live one here, as Smith has only played one season so far on his three-year, $41.25 million extension from 2019. An APY of $13.75 million at left tackle was good for 93% of T5APY at left tackle. Though he did not grade very well before signing his extension, Smith was alright in 2019, grading out as PFF's No. 19 tackle. This deal made Smith one of the top-paid tackles in the NFL, which is still reasonably good process, given what we now know about tackles in the NFL — if a team finds an average to above-average starter, they tend to lock that guy up.
Our projections are not always right, but far more often than not, the player's performance in the two years after signing the contract was more in line with our WAR expectation than the contract would imply (not including players who missed significant time to injury and/or suspension).
One of our bigger whiffs was on now-Arizona Cardinals cornerback Robert Alford. We believed Atlanta's decision to extend him early in 2016 was a bit of an overpay based on his performance in 2014 and 2015. Still, they clearly saw something we didn't and were ultimately very smart to get him extended before he hit free agency — he stepped his game up and was very strong in 2016 and 2017.
There is much more to learn and many more avenues to explore with PFF Contract Projections. We can evaluate full rosters and better understand why decisions are made, have a better understanding of cap casualties and refine our WAR estimates based on the “wisdom of the crowds” phenomena that are NFL contracts.
We plan to provide consistent analysis for you, the reader, as these moves are made (for example, check out our work on the Patrick Mahomes deal and the subsequent Chris Jones deal), as well as develop products that are of the quality our subscribers are accustomed to.
Buckle up!
