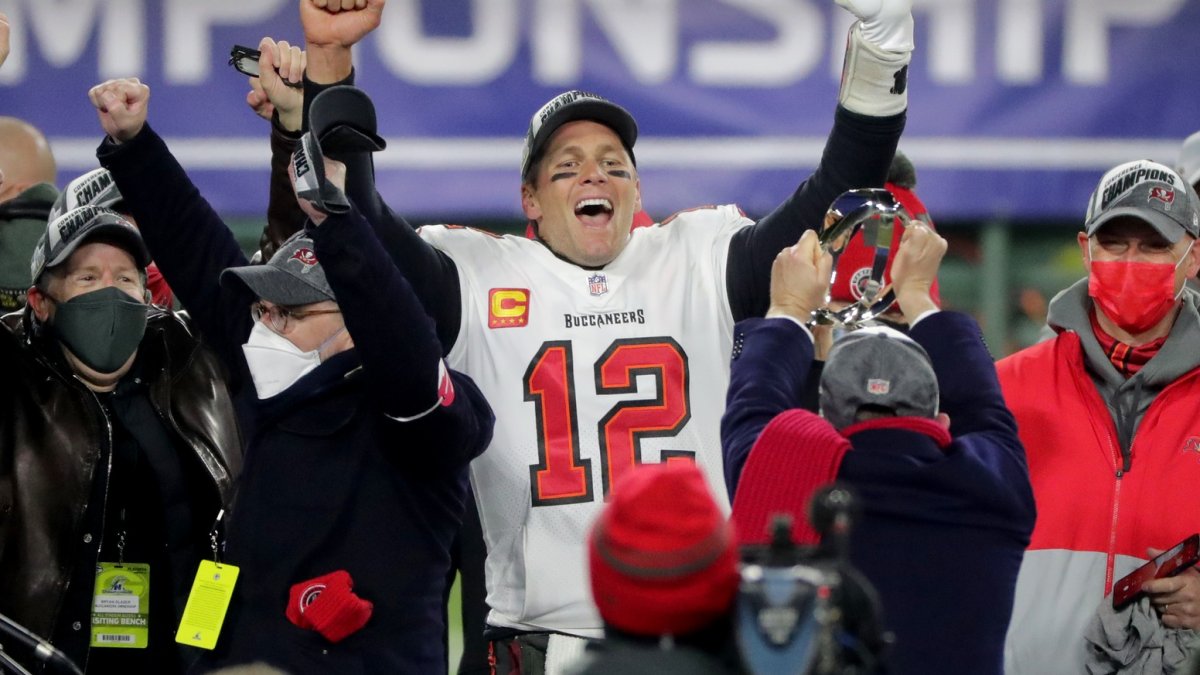
Tampa Bay Buccaneers quarterback Tom Brady has aged like a fine wine. He just won a Super Bowl at age 43 and signed a virtually guaranteed contract that will keep him in Tampa for his age-45 season.
Of course, not all players age as gracefully as the G.O.A.T., and this begs a couple of questions: How fast does the average NFL player age, and how does it vary through different positions?
With the first wave of NFL free agency all but over, the offseason needs for all 32 NFL teams set in stone and teams well into 2021 NFL Draft preparation, we want to use this article to investigate these questions.
More from PFF's live free-agency coverage:
2021 NFL Free Agency LIVE Deal Grader | The 100 best available NFL free agents remaining | 2021 NFL Free Agency Tracker | PFF Improvement Index for all 32 teams | Fantasy Football Free Agency Tracker
Beware of the selection bias
Any analysis centered around aging can be deceiving, as there are several biases one can fall for when looking at the data.
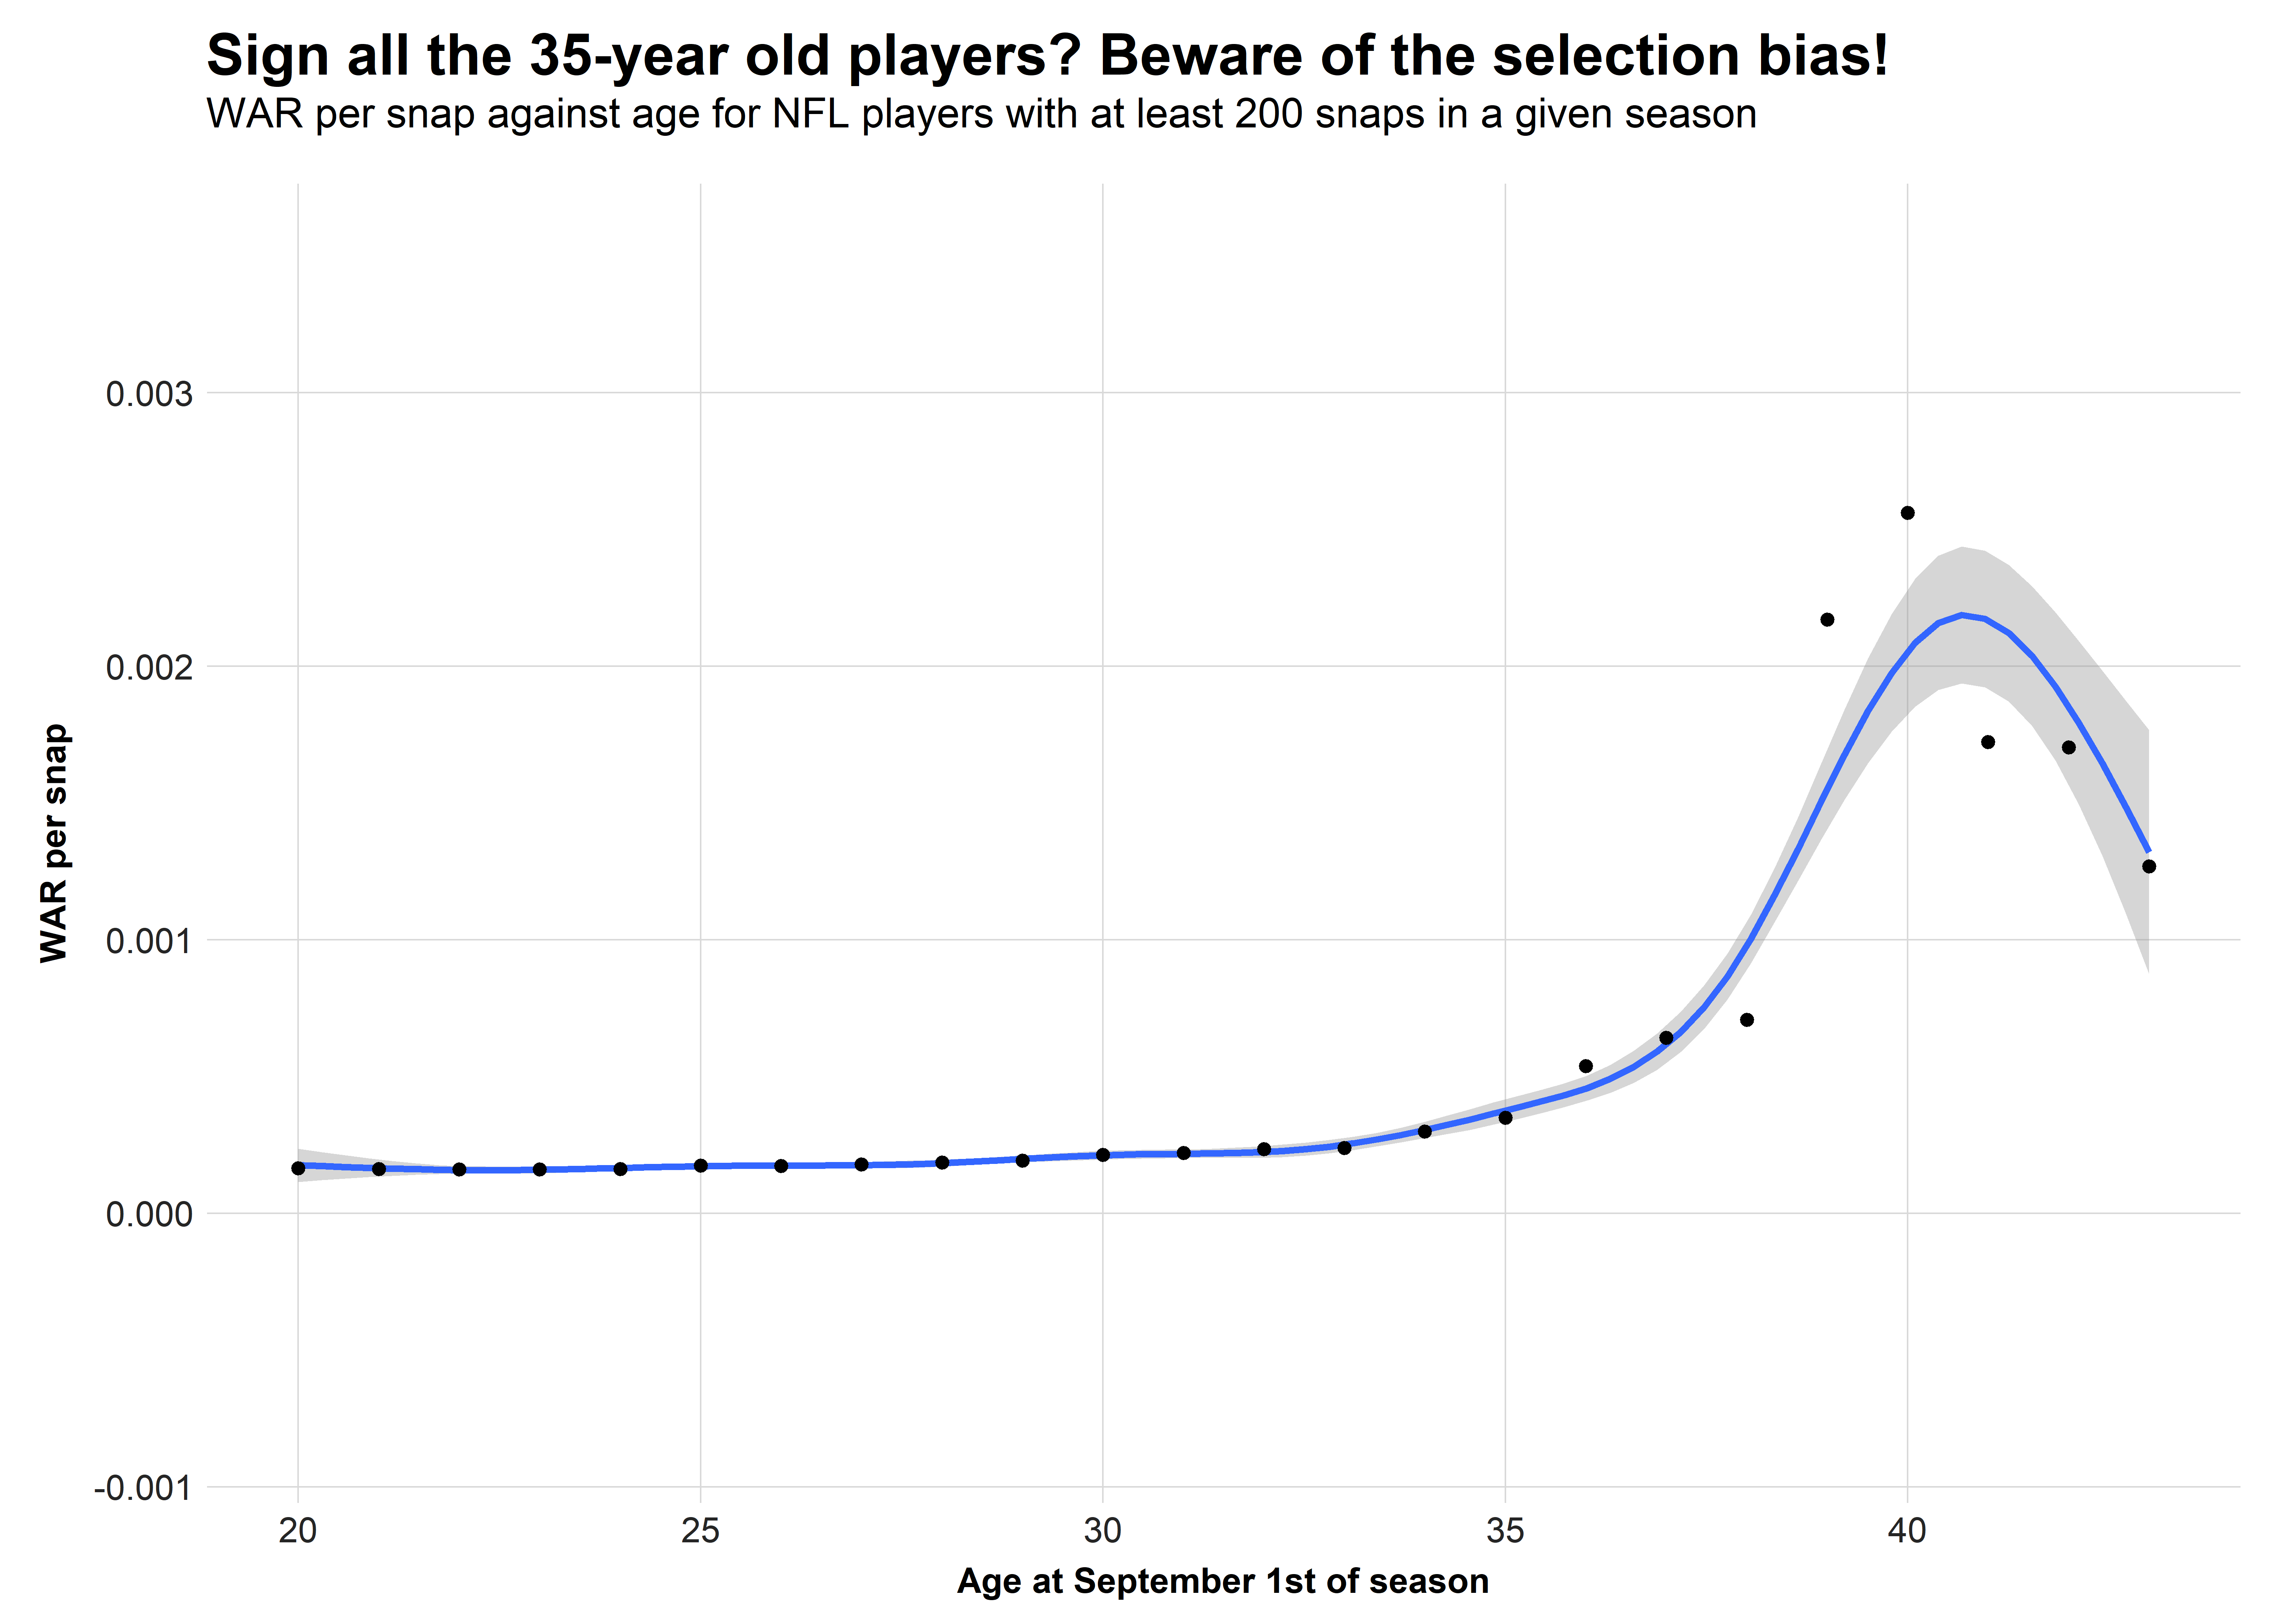
If we consider efficiency — let’s use PFF's Wins Above Replacement (PFF WAR) per snap as a unifying efficiency metric across all positions — we can use the following chart to display WAR per snap against age. The result is not only that NFL players become better over time, but there is also a huge spike starting after age 35.

So, what is happening here?
Quarterbacks create this anomaly: Across all NFL players with at least 200 snaps in a season, roughly 3.8% are quarterbacks. When we look at players with at least 200 snaps in a season at age 36 or older, 34% are quarterbacks. When we filter to players at age 38 or older, 55% are quarterbacks.
Thus, the data at the right side of the chart is dominated by quarterbacks, and they generate more WAR per snap than other players. That’s especially true for older ones, as it’s very unlikely that a bad quarterback gets to play 200 snaps while being closer to 40 than 30. Most “bad” quarterbacks are already out of the league by then.
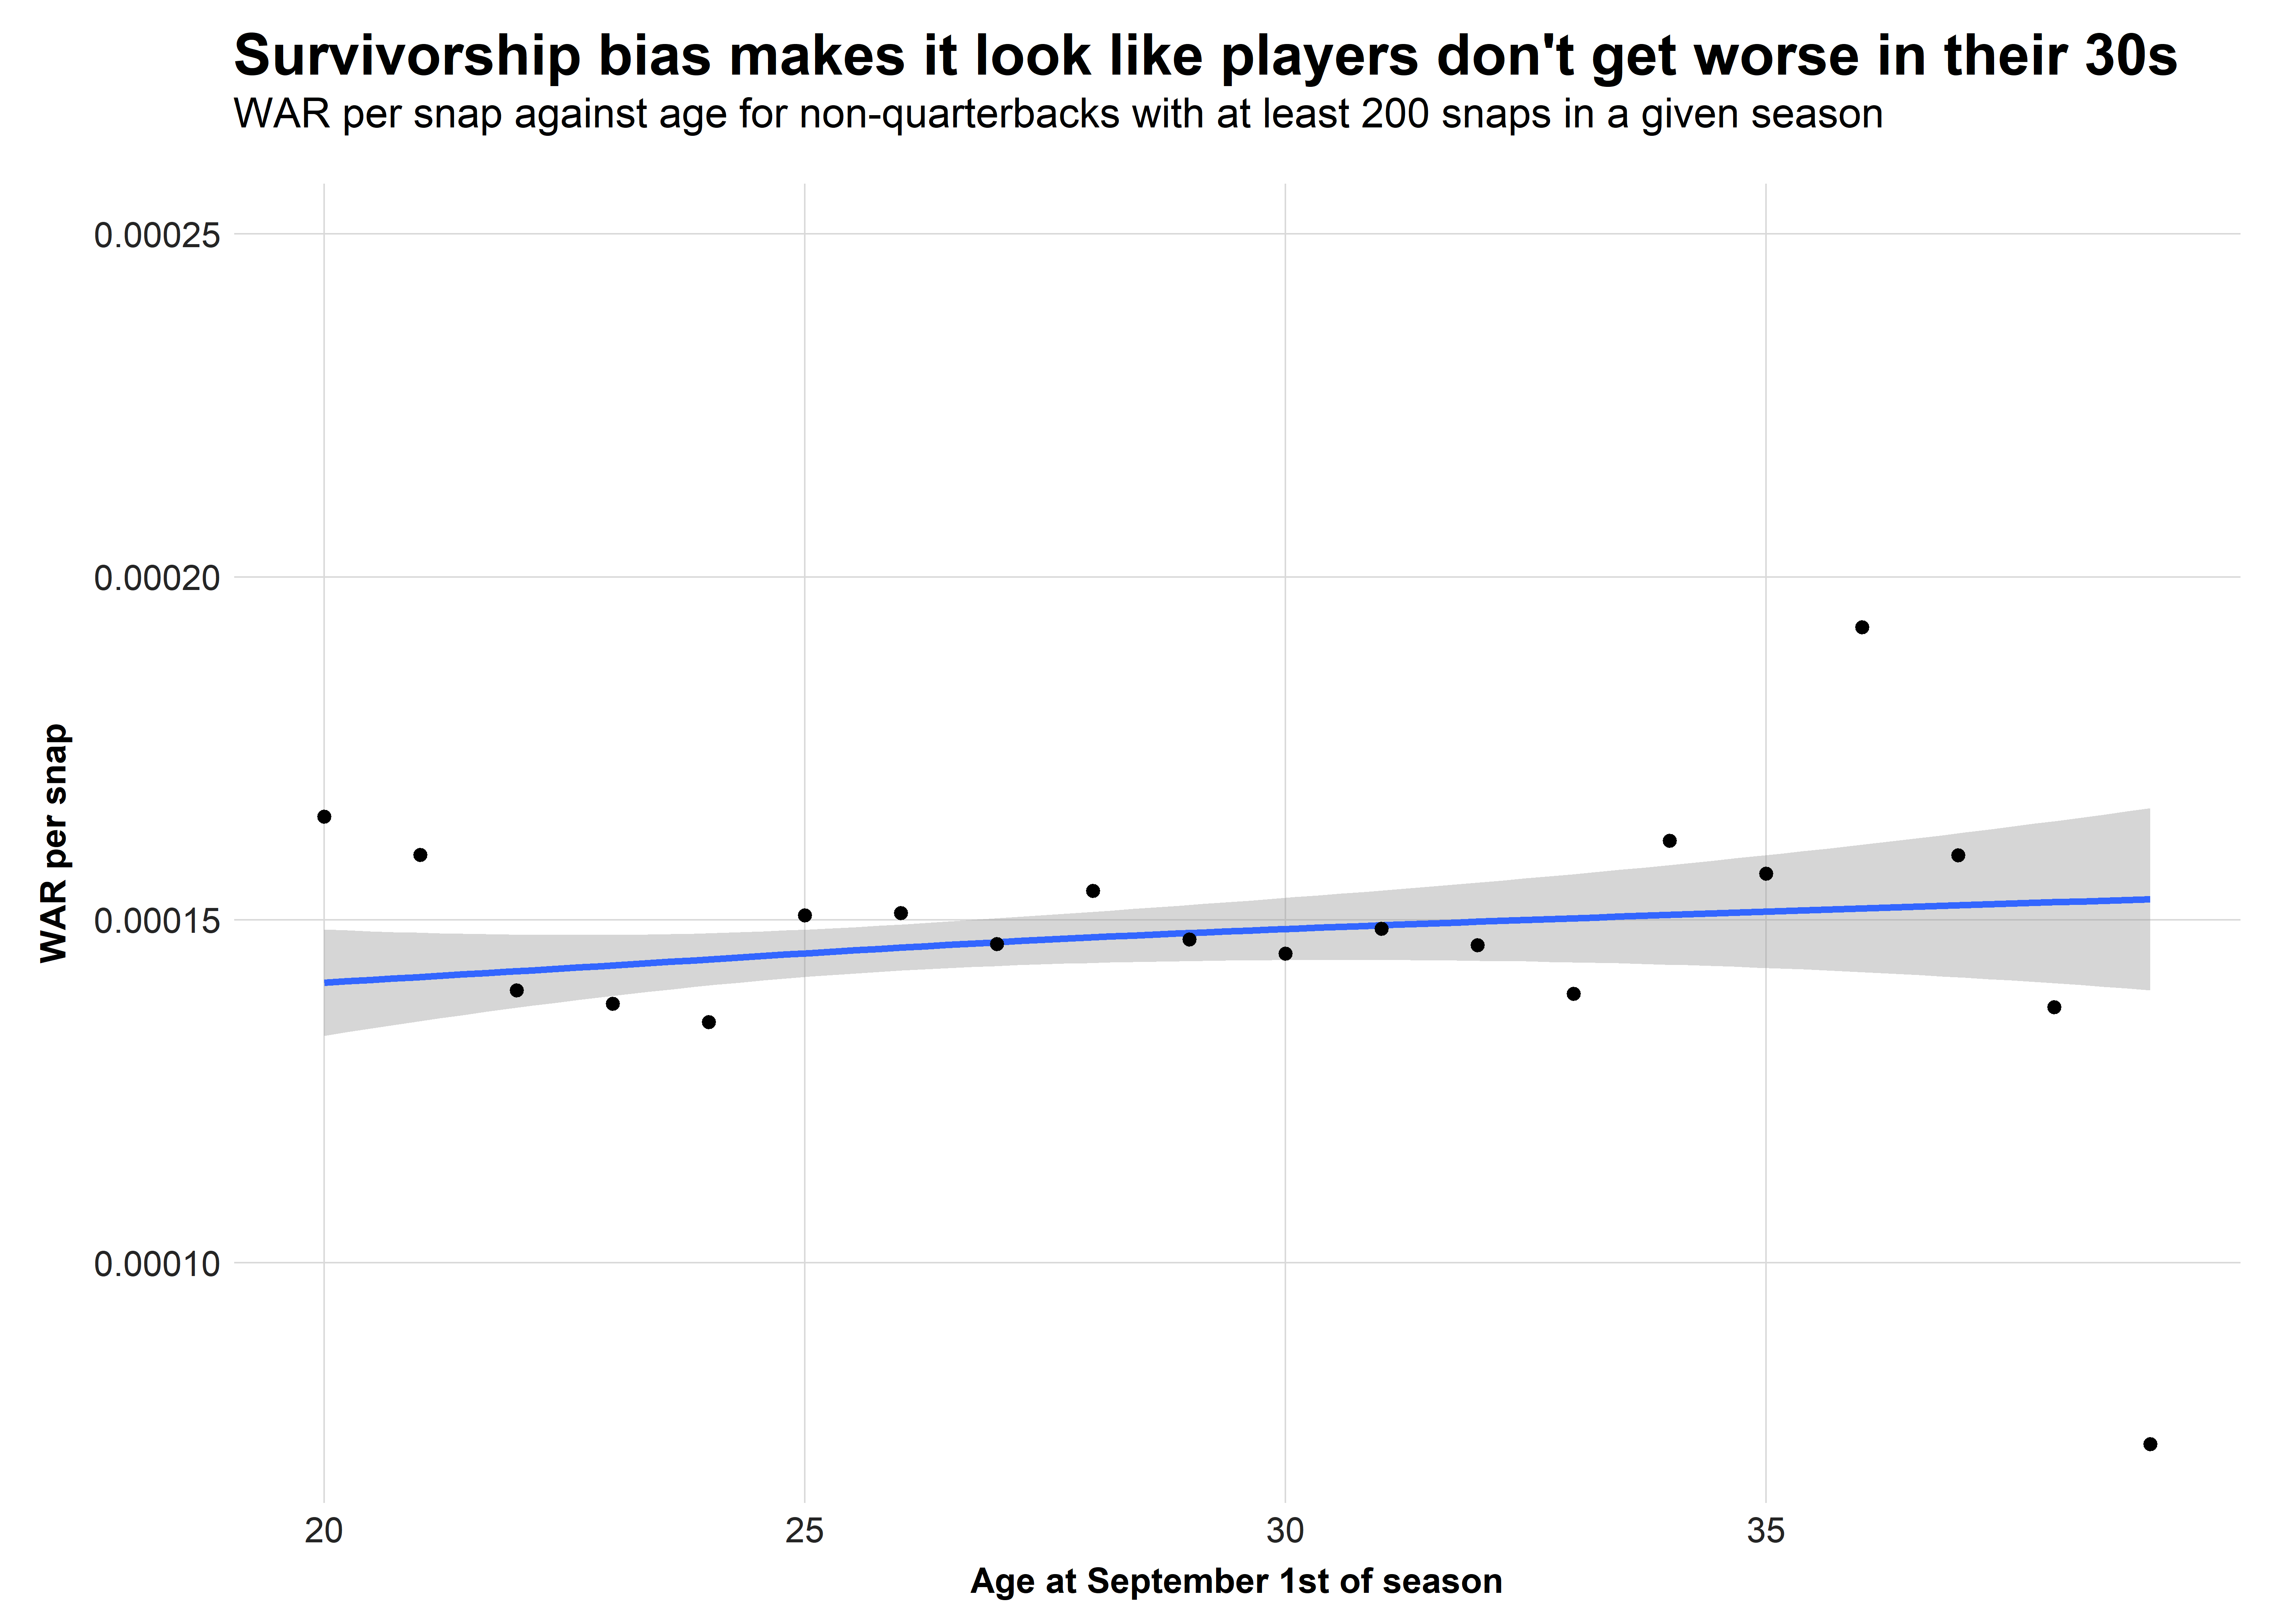
Ok, so quarterbacks skew data. What if we look at the same chart with quarterbacks excluded? Did we remove any bias?

Apparently not, since the aging “curve” shown here still defies everything we know about the human body and NFL players out of their primes.
You might have already guessed it: The problem is survivorship bias. Players who are still playing 200 snaps in a season beyond age 30 are probably really good. Meanwhile, the set of players who play 200 snaps at the age of 25 or younger can contain either bad players living off their early-round draft pedigree or players who aren’t very good but see significant snaps because they are cheaper than their veteran counterparts.
Therefore, we are going back to the drawing board.
The rookie wage scale revolutionized the age distribution
How do we solve this problem? After all, we don’t have the kind of data that measures the aging process directly, as we would for something like athleticism.
Hence, our best proxy for the aging process is mixing the quality of play on the field with the number of snaps. The latter lets us incorporate four different effects that come with age:
- Injury risk: The wear and tear of an NFL career usually leads to more — and longer-lasting — injuries as players age.
- Coaching decision: A coach might notice a player is out of his prime and not play him anymore.
- Front-office decisions: At some point, a player will no longer be wanted or needed and will be forced into retirement
- Retirement on own terms: Some players have the luxury of retiring when they think the time has come, and the chance of this happening increases with age.
Luckily, PFF has a metric that can be used across positions and describes both qualities of play but also depends on volume: PFF WAR.
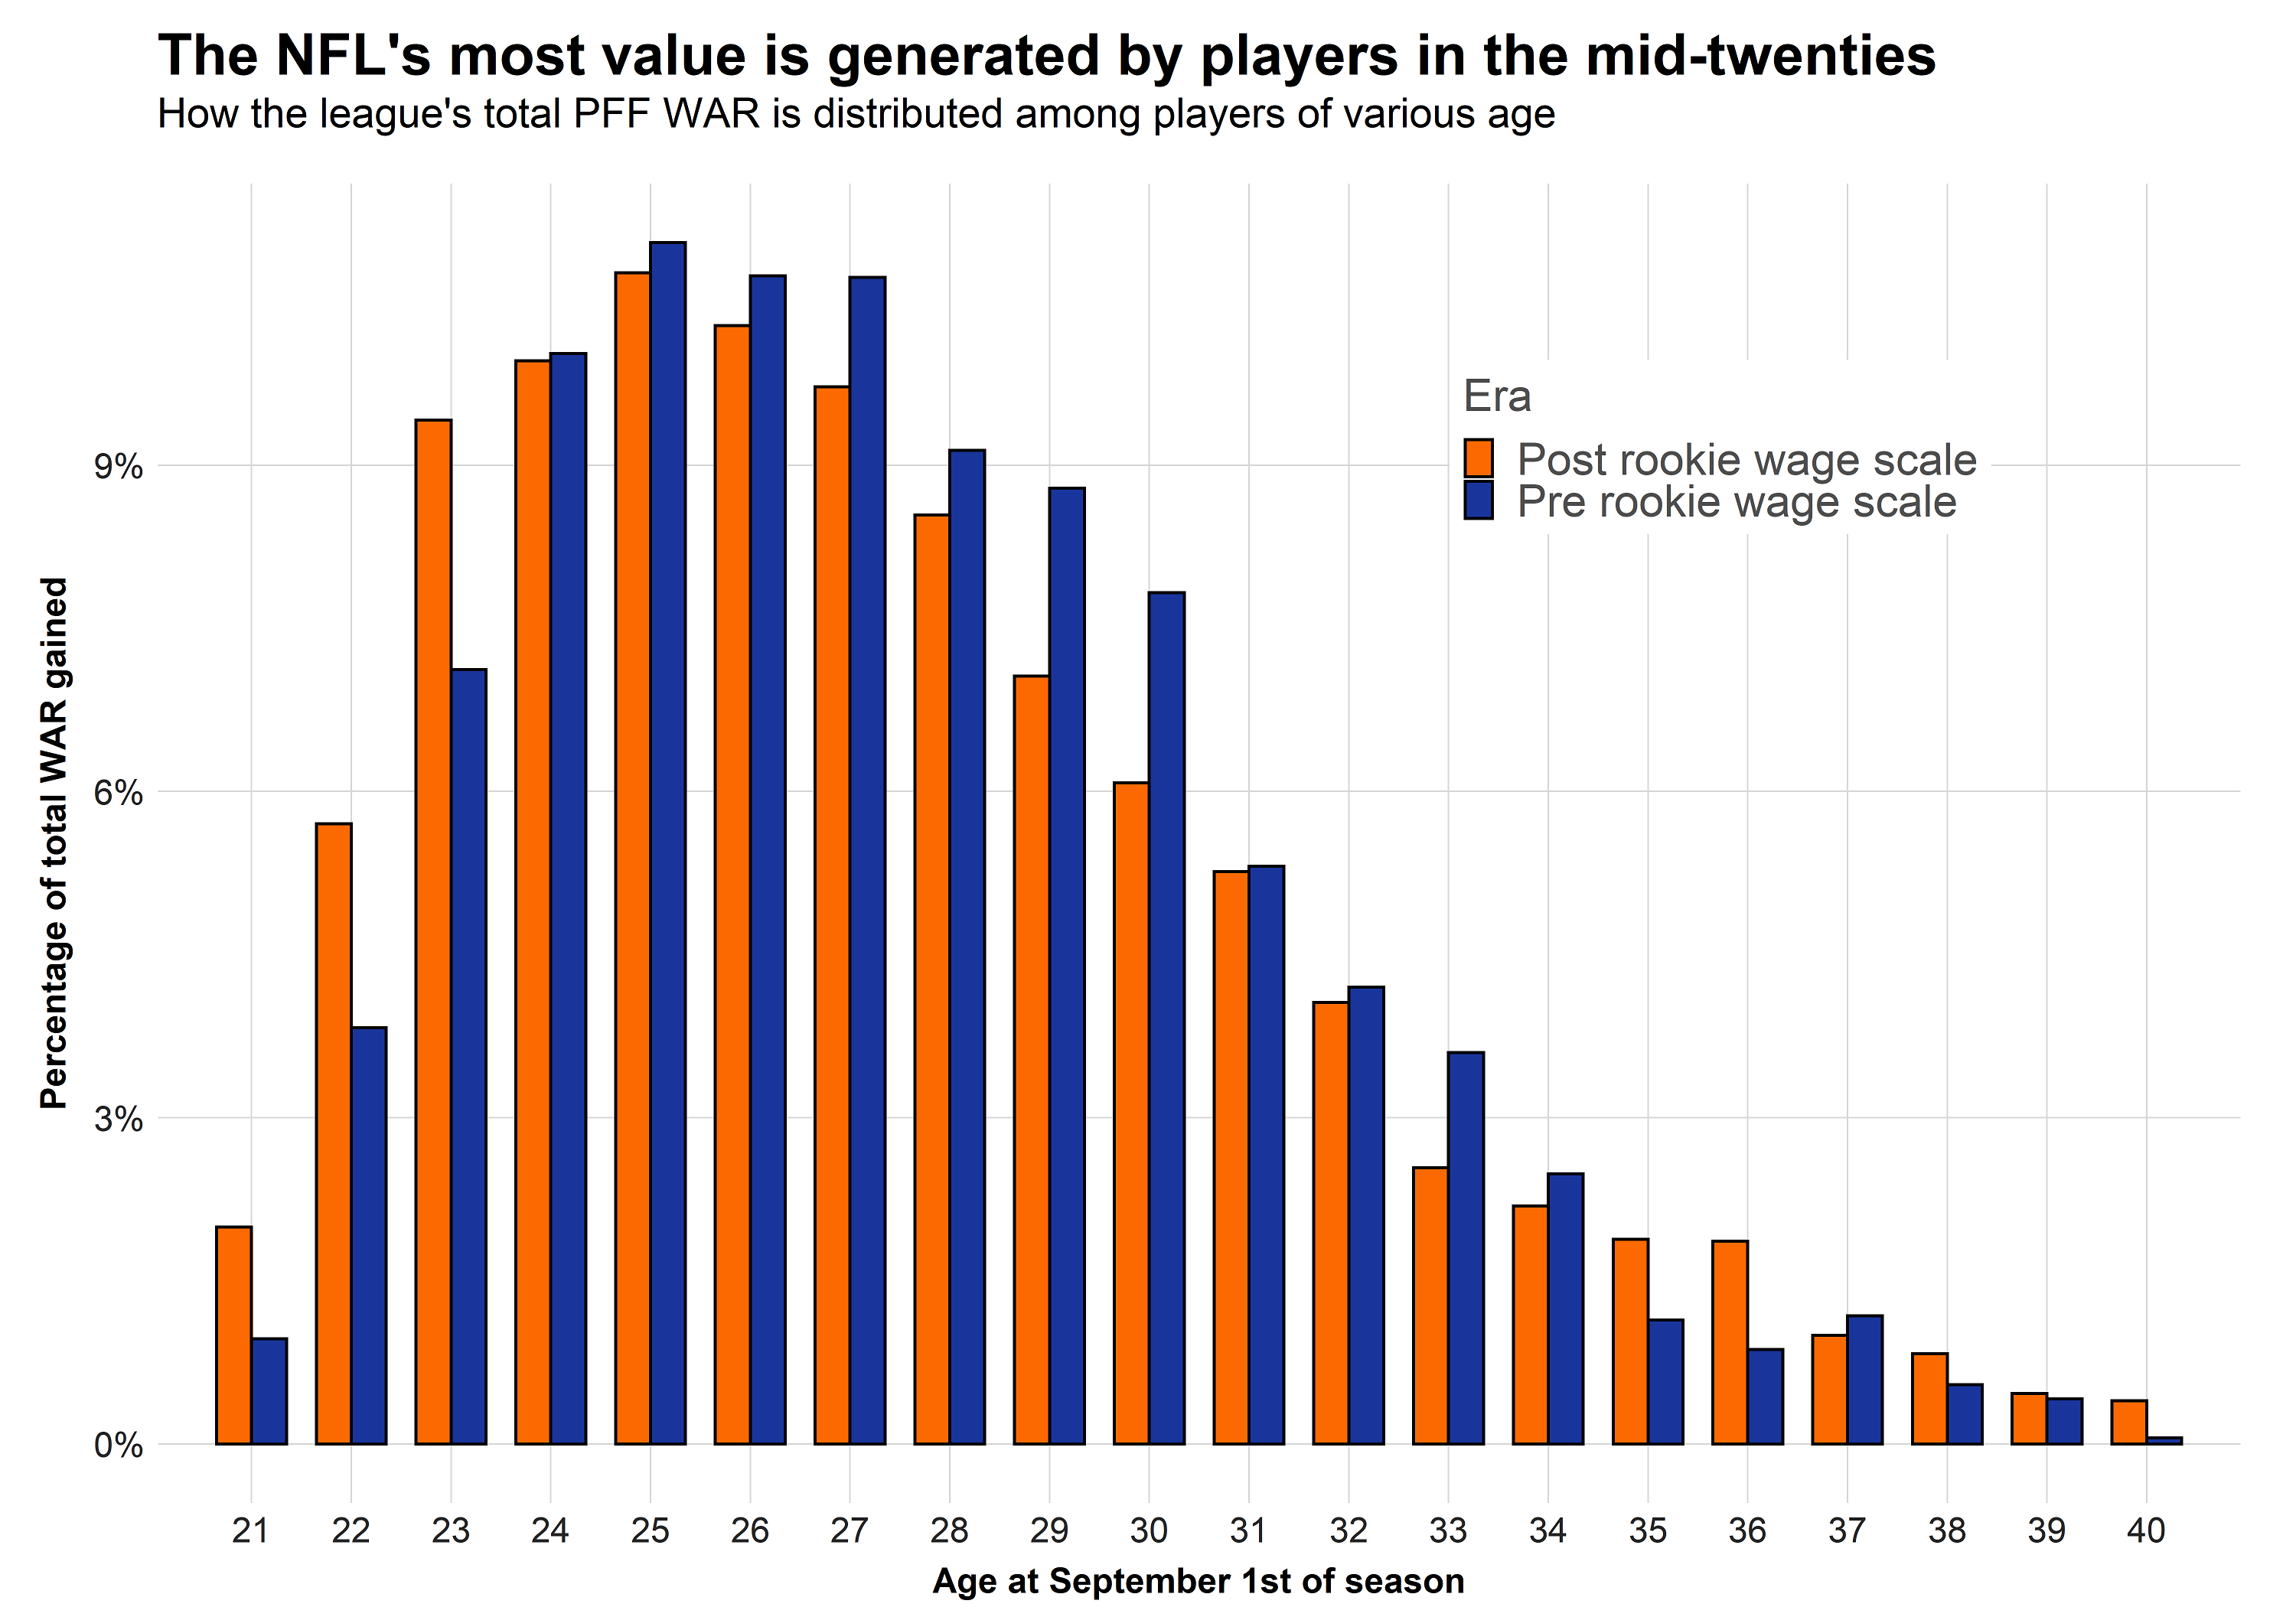
For each position, we will look at the percentage of the total WAR generated by players of a given age. The age when this percentage starts to decrease significantly can be considered the start of a process that will gradually put a player out of his prime.
Before we start with positional analysis, here is the analysis across all positions, grouped by seasons before the rookie wage scale and the seasons after the NFL installed the rookie wage scale.

Exclusive content for premium subscribers

WANT TO KEEP READING?
Dominate Fantasy Football & Betting with AI-Powered Data & Tools Trusted By All 32 Teams
Already have a subscription? Log in


 © 2025 PFF - all rights reserved.