• This article serves as an introduction to future work on quarterback traits and development.
• Where QBs tend to improve over time: Young signal-callers get better in EPA and PFF WAR and throw into open windows more often as they gain NFL experience. However, quarterbacks don't seem to improve in pocket awareness and sack avoidance.
• Better understanding the trade-offs of QB play: For example, pressure on Jalen Hurts in 2022 led to a higher sack rate than in previous years, but he was staying in the pocket longer and delivering better and more frequent throws to open windows.
Estimated Reading Time: 8 minutes
Quarterback is the most complex and important position in team sports. It makes sense, then, that it's also a position we try to understand as best as humanly possible through articles and metrics that evaluate performance and production.
This series of articles will take a slightly different route: Using PFF’s quarterback charting data as a foundation, we will explore the components of quarterback play — rhythm, accuracy, throw selection, progressions, decision-making and much more.
Through this exploration, we can hopefully learn more about the unique styles and skills of individual quarterbacks and the areas of the game and contexts in which they are more or less likely to succeed or fail. We can then apply those findings to better understand how components of quarterback skill sets interact with other players — for example, which quarterbacks would benefit from a good offensive line more than others? Which quarterback traits would best match with a dynamic after-the-catch receiver?
Lastly, by isolating specific traits, we can hopefully zero in on players whose traits allow them to deviate from the norm — for example, while quarterback play from a non-clean pocket is generally unstable, certain players, because of their traits, should be seen as outliers as opposed to noise.
This article will set the stage for an upcoming series on quarterback composites by focusing on, and answering, the following question: Which components of a quarterback's development lead to improvement? Put differently, we know that a quarterback is likely to increase their production from their first few NFL seasons to their next few seasons, but what part of their game develops the most?
Without looking at a signal-caller's production in specific areas (e.g., their expected points added across different situations such as play action or pressure), we will try to isolate broader attributes that lead to improved quarterback play. Do quarterbacks become more accurate? Improve their rhythm and timing? Improve their throw selection? Get better with progressions? Advance in their pocket awareness and escapability?
Let’s first establish some production metrics that show how quarterbacks improve in their production.
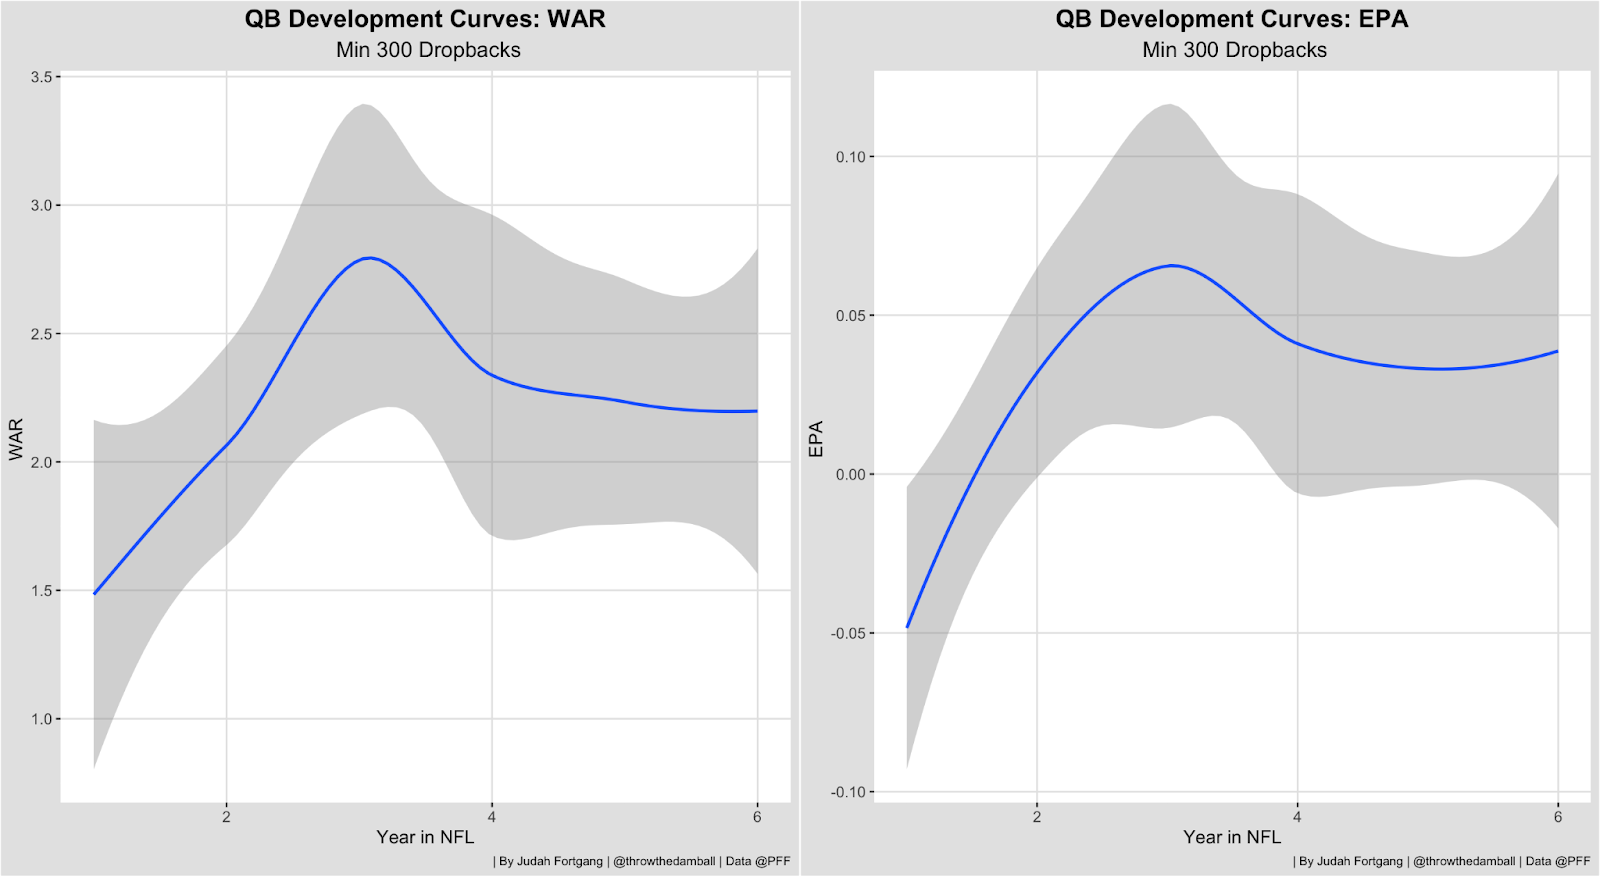
Using EPA and PFF WAR as our baseline, we can see that quarterback production improves as players gain more NFL experience. While a full exploration of this curve is for a different time, the key for us here is that we can see a clear and steep increase in production in both metrics from around Years 2-4 before it levels off. And once we start to tease out individual quarterback components in a similar manner, we can start to see the effective curve for each one of these stats.
Component Parts
Let's start with accuracy. Perhaps the best recent example in this facet is Josh Allen, whose accuracy shot up in Year 3.
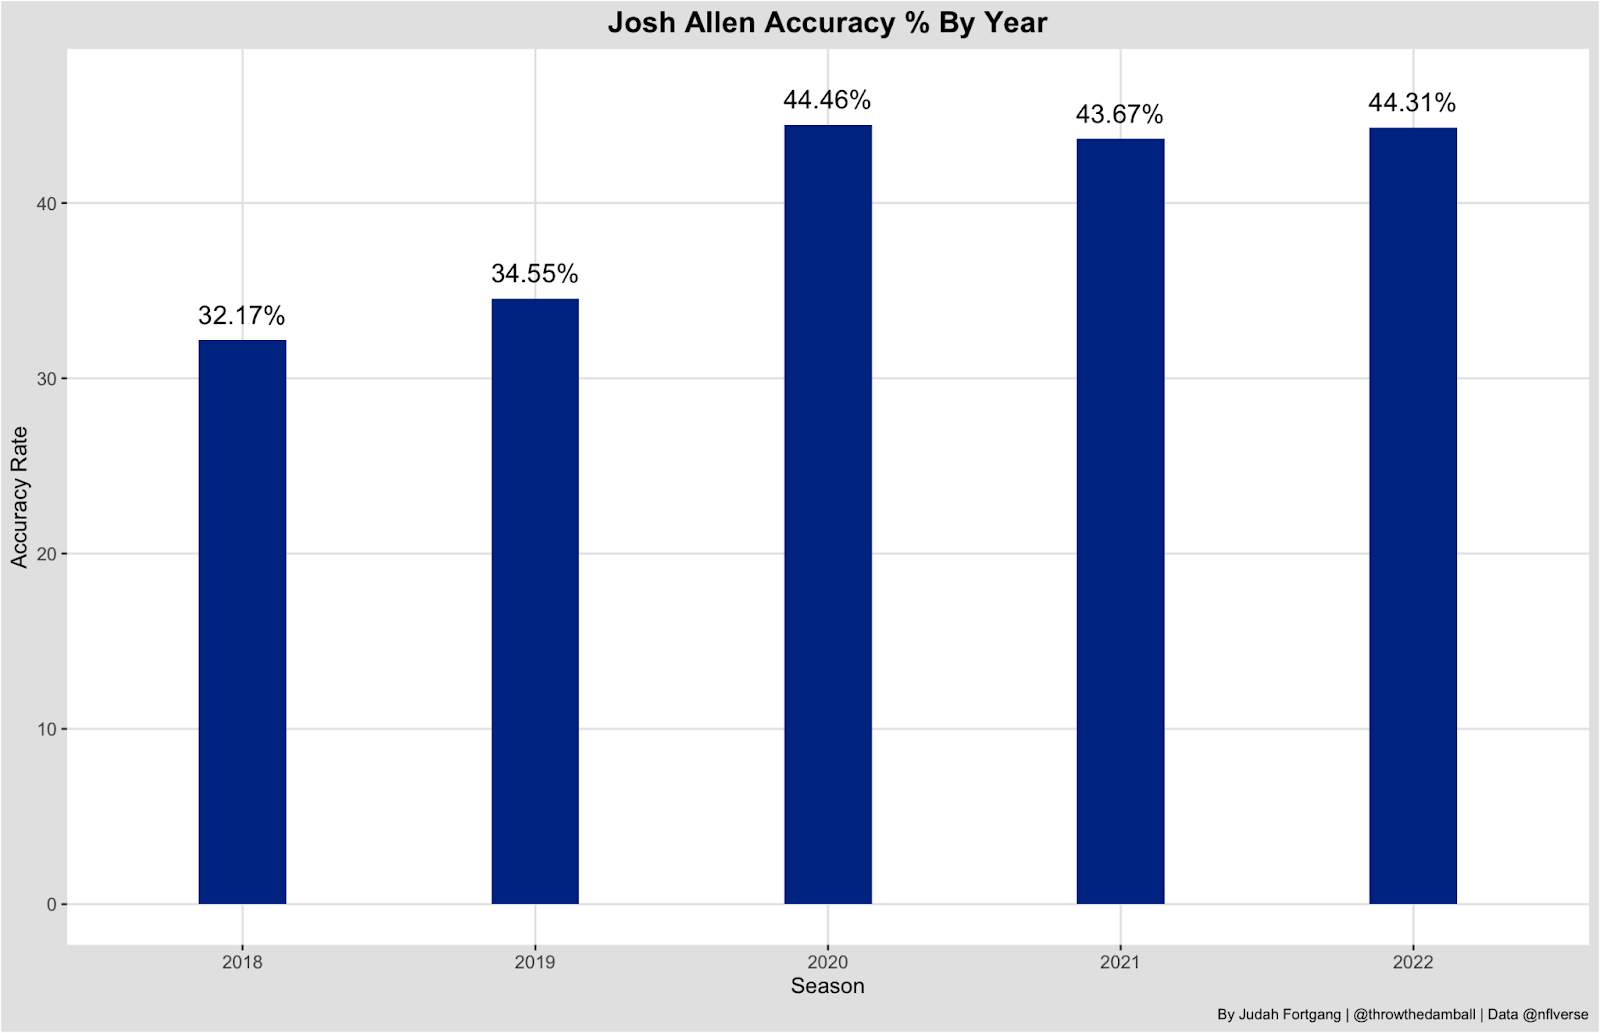
Allen’s accuracy rate jumped by around 10 percentage points from the previous two seasons. But is this trajectory consistent with aggregate development curves?
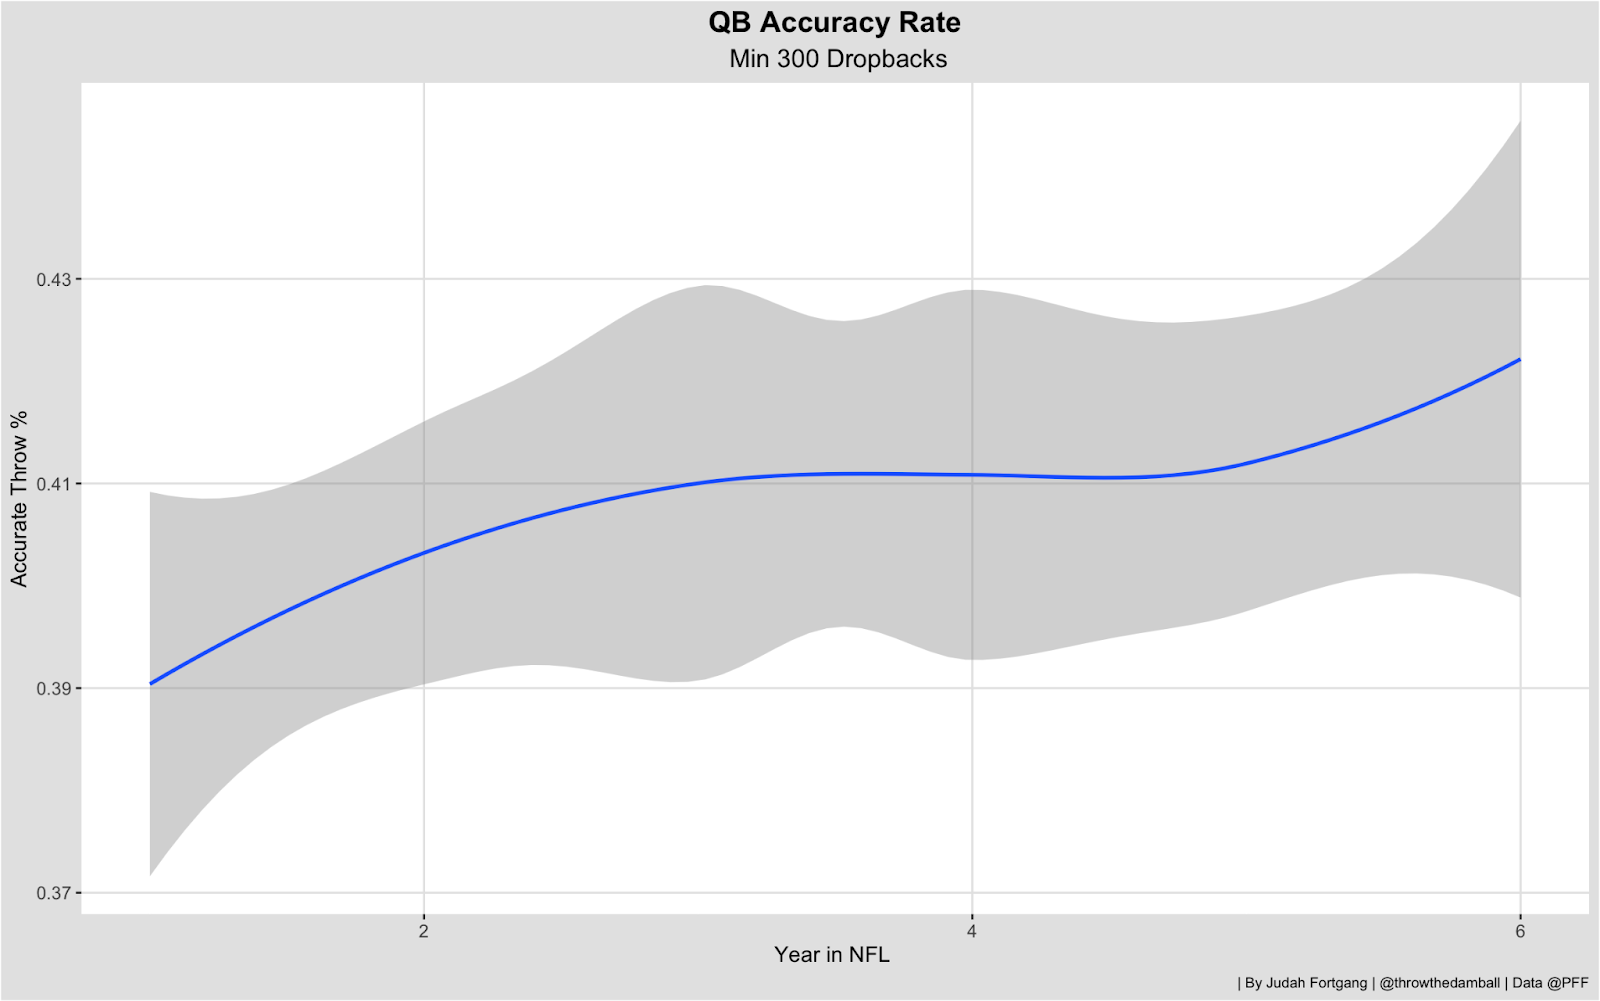
This curve suggests Allen’s improvement in accuracy was not the norm or to be expected. Quarterbacks, in general, only improve their accuracy ever so slightly — by a percentage point or two over their first four years.
One might next look to see improvement in a quarterback's throw selection and processing. And, indeed, signal-callers improve at throwing into more open windows and fewer tight windows. The base rate on throws to open windows is 0.43 EPA per play. For tight windows, it's -0.37.
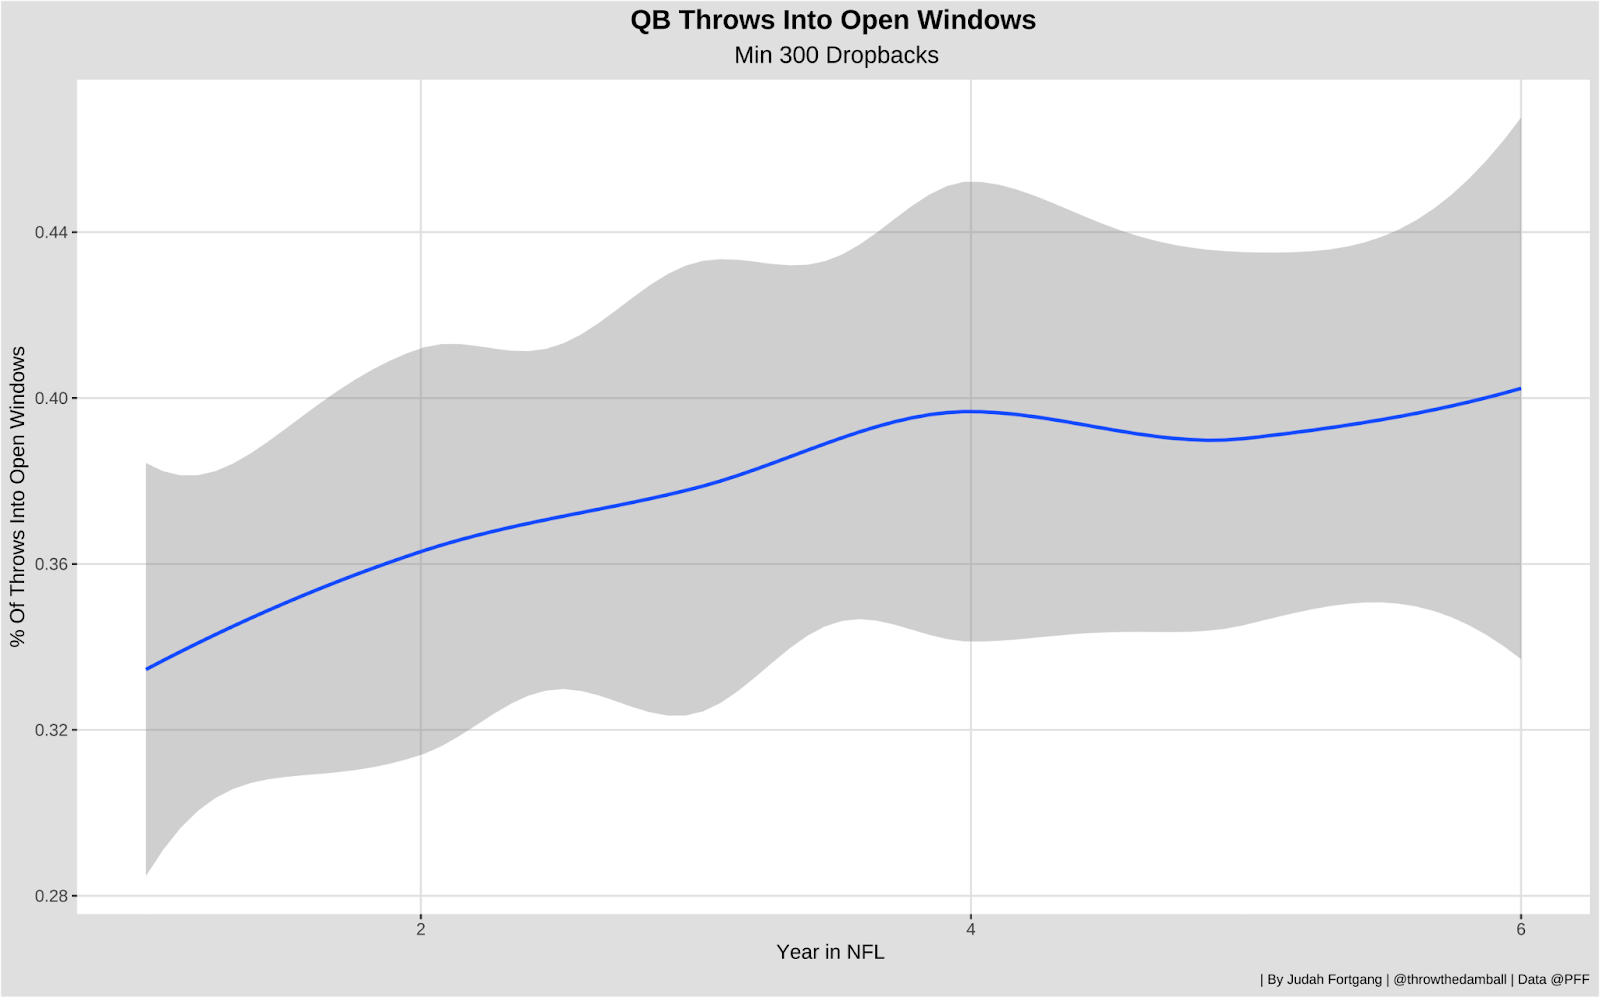
While this line might seem fairly flat, the units on the Y-axis move in large increments. Quarterbacks throw far more often to open windows as they gain experience. Likewise, the curve for throws into tight windows is similarly negatively sloped.
The context of a receiver being open or covered is useful, and it also brings up some important confounding factors worth discussing. As we have seen in recent years, teams with quarterbacks on rookie deals have more ammunition to spend at receiver — think Stefon Diggs in 2020 and A.J. Brown and Tyreek Hill in 2022, among others — providing the quarterback with more open windows to throw to.
Framed differently, do quarterbacks really improve their throw selection, or do better circumstances elevate the base rates for success?
In the course of this research, I have also built a few metrics to evaluate quarterback processing and decision-making — of which a few future pieces will focus on — that would suggest a quarterback's processing, even adjusted for improved situations, gets better as they develop and follows a similar curve to throws to open receivers.
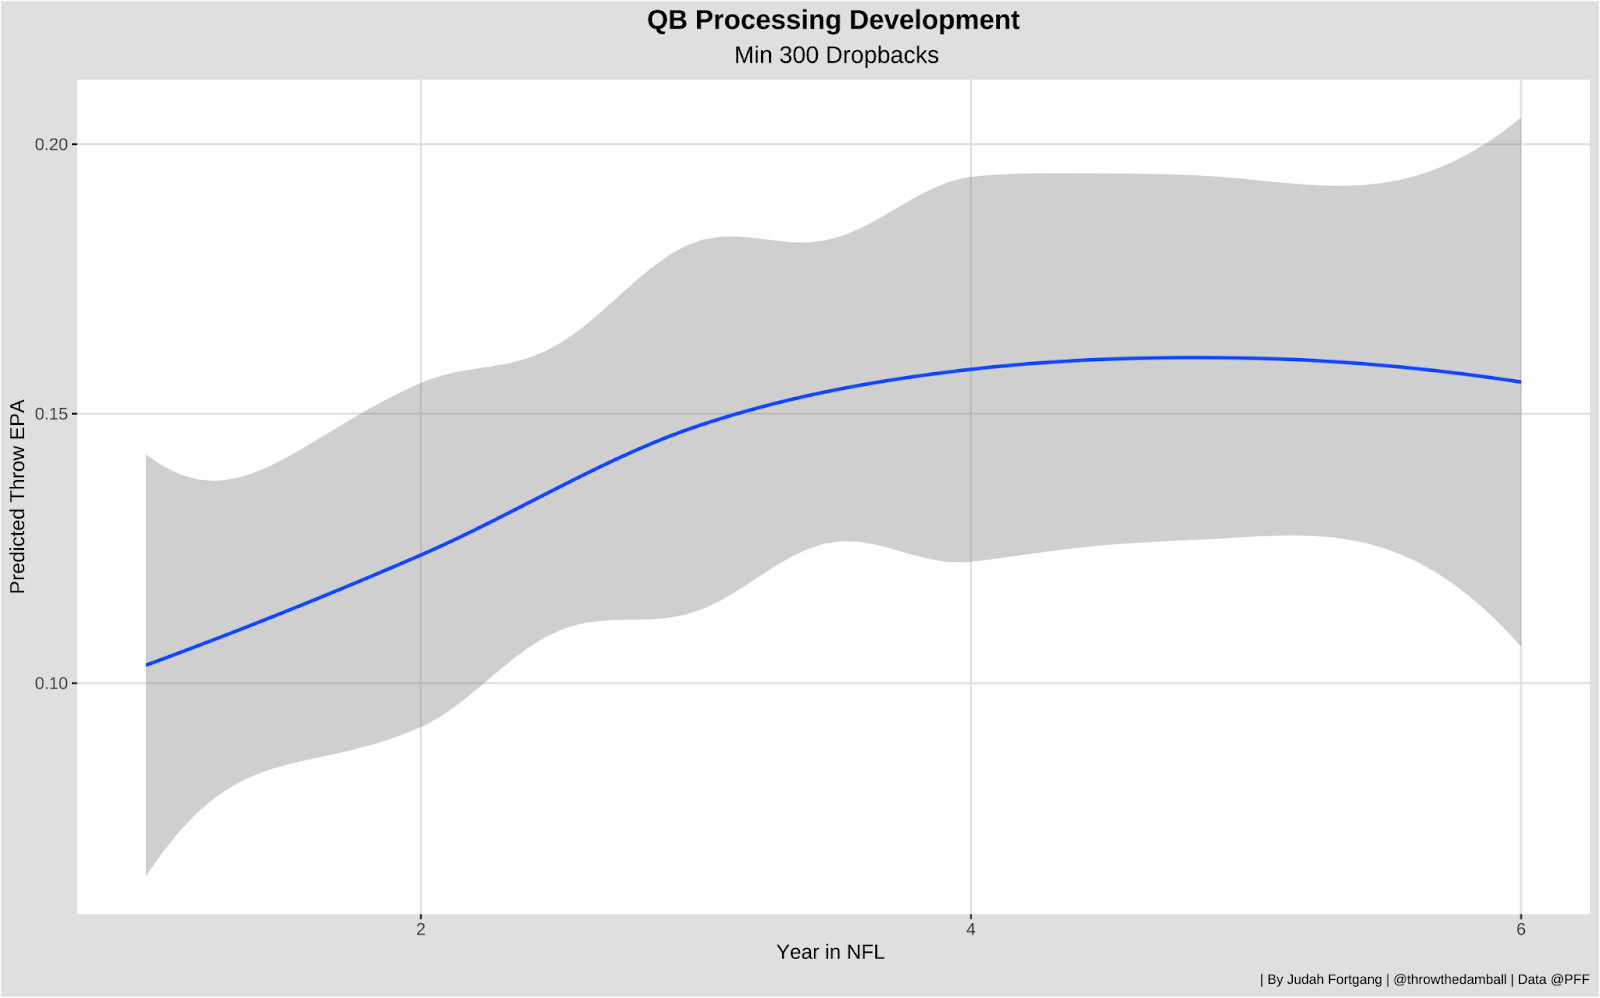
Saving the full note for later, this metric essentially predicts the expected EPA based on a quarterback's decision, given all his available route options and adjusted for expectation (e.g., having more open receivers). The curve, then, suggests a quarterback improves in their decision-making and throw selection even when we adjust for improved wide receiver play and surrounding talent.
In the same vein as attempt selection, as quarterbacks adjust to the speed of the league, one might look at their play when in rhythm and from within the pocket to form a proxy for timing and ability to “play within structure.” And again, it is important to note the base rates for plays charted “in rhythm” and within the pocket.
| Stat | EPA In | EPA Out |
| 0.21 | -0.25 | |
| Rhythm | 0.27 | -0.25 |
To put these numbers in context, the difference between staying in the pocket and in rhythm and not is larger than the gap between the No. 1 and No. 32 offenses every year. But there is no real increase in the percentage of throws in rhythm or in the pocket for young quarterbacks.
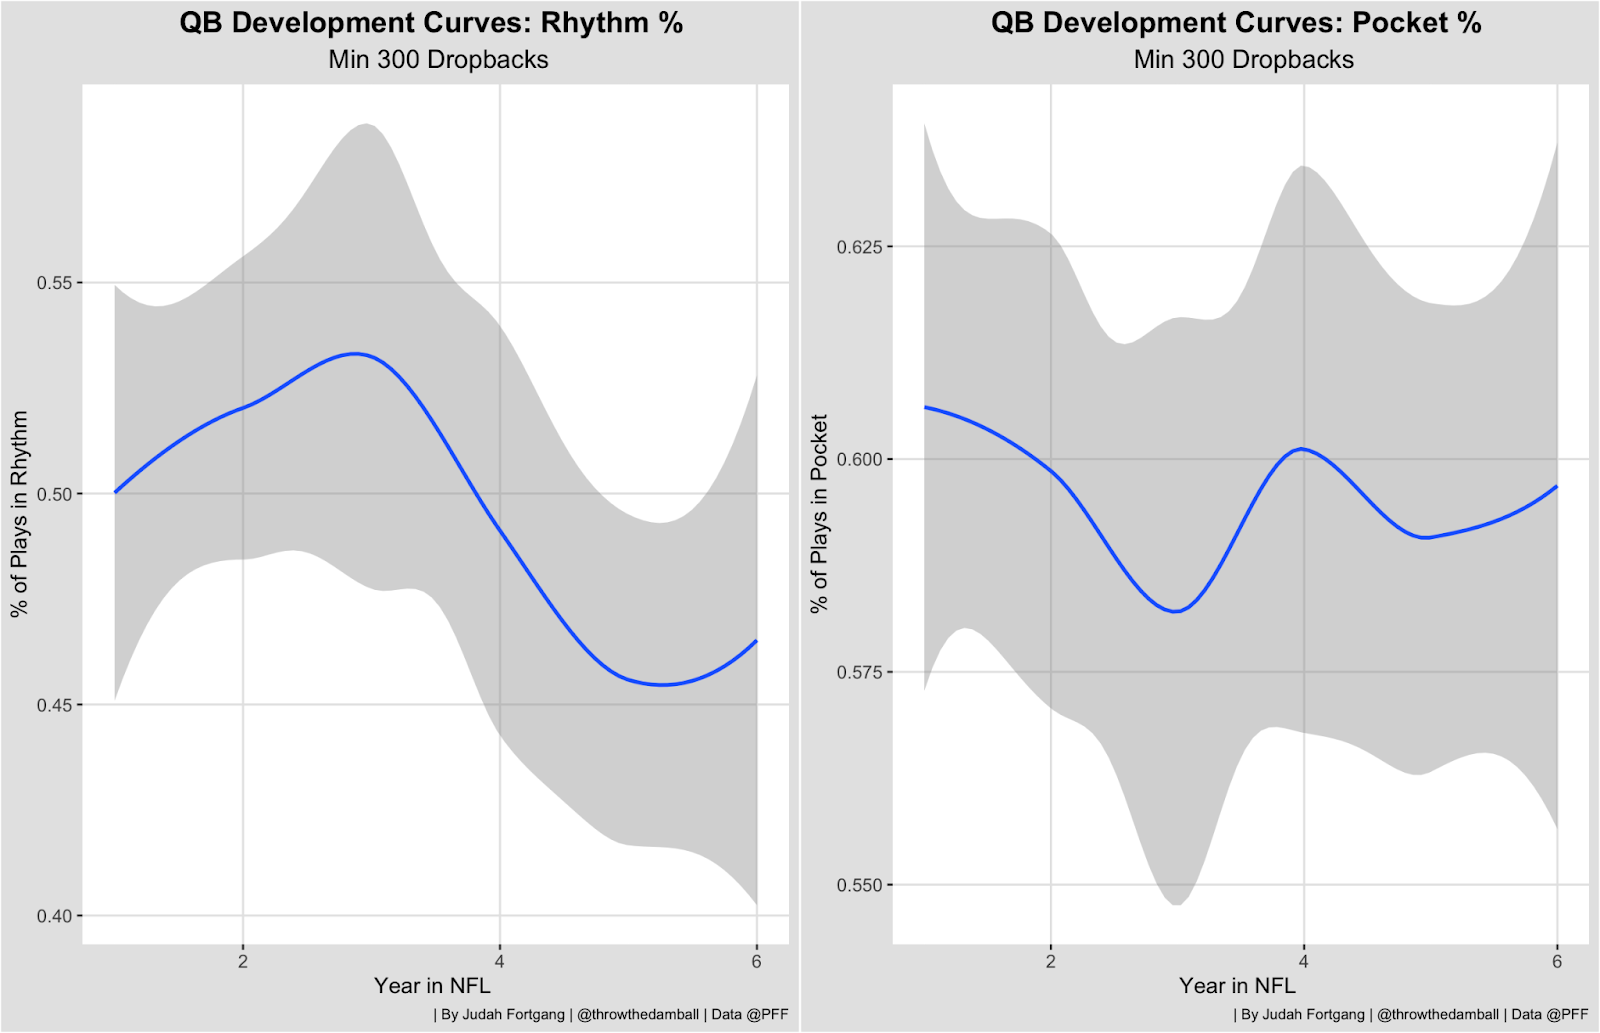
The curves here suggest significant randomness, as players remain at similar stages in Year 1 and Year 4. This relationship for rhythm and pocket presence is similarly true with progressions, as improved play throughout progressions follows a noisy curve.
What about pocket awareness and escapability? We can use PFF charting to see how quarterbacks perform when they scramble outside of the pocket to avoid pressure — a base of -0.14 EPA — rather than stay in the pocket with pressure, which has a base rate of -0.33 EPA.
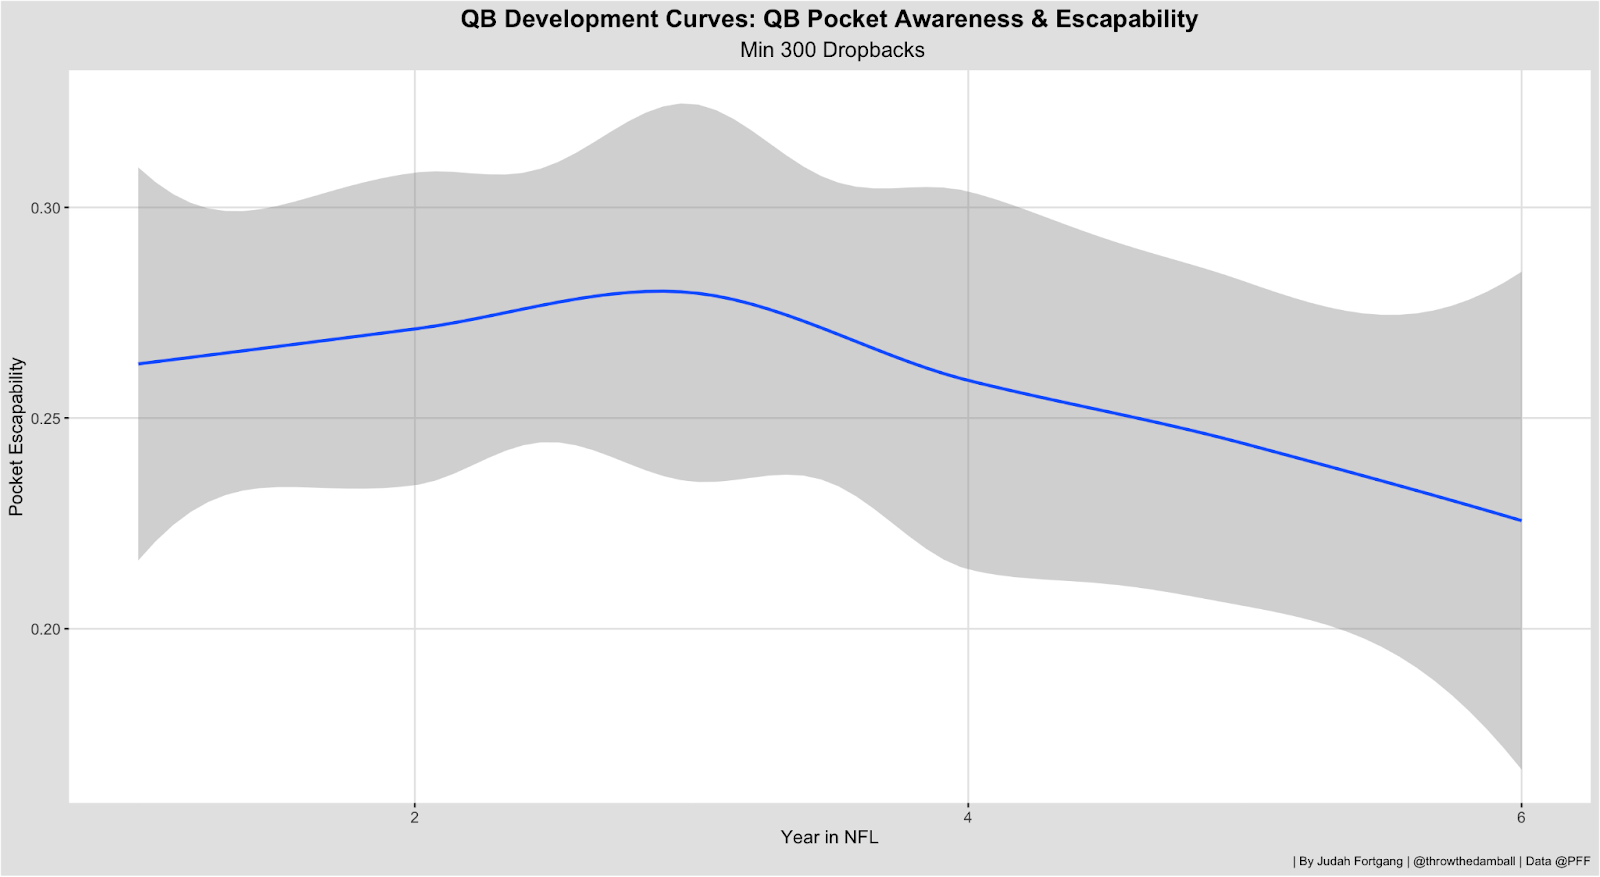
As with most curves we’ve seen, despite scrambling out of a messy pocket being a net positive, there is no real development for quarterbacks in this area. In a similar vein, quarterbacks do not seem to improve in their sack avoidance.
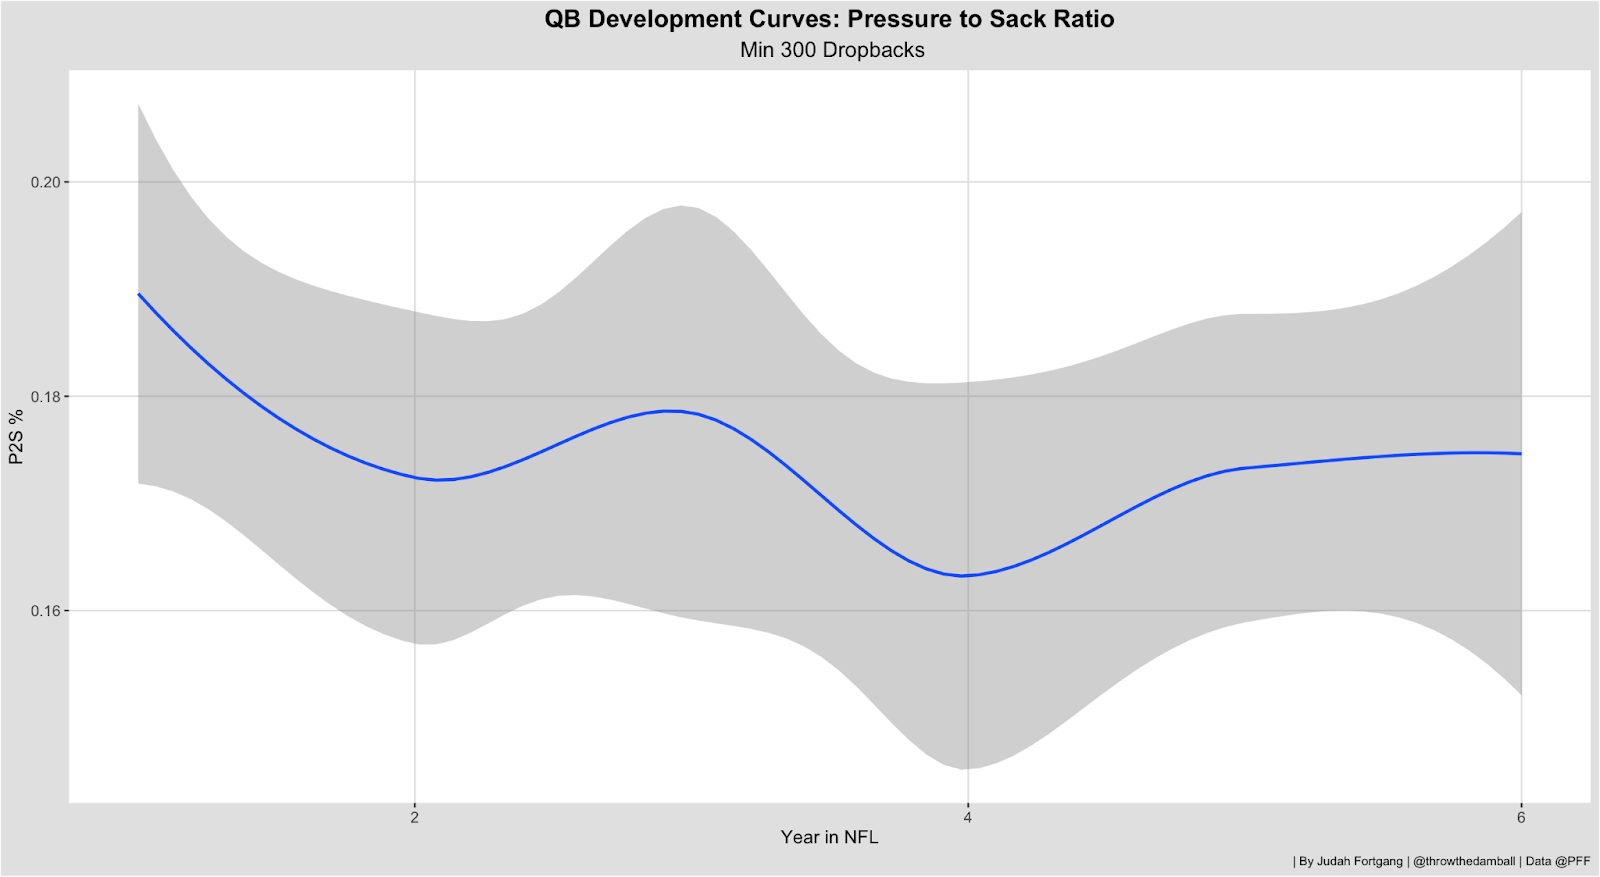
There is, again, a noisy curve for how often quarterback pressure turns into sacks.
Implications
While this is, of course, not an exhaustive list of traits that compose a quarterback's production, nor do we have ways yet of quantifying all traits, the findings seem to indicate that only throw selection and decision-making follow an upward-sloping development.
The question, then, is whether the difference in total production can be attributed solely to improved decision-making and throw selection.
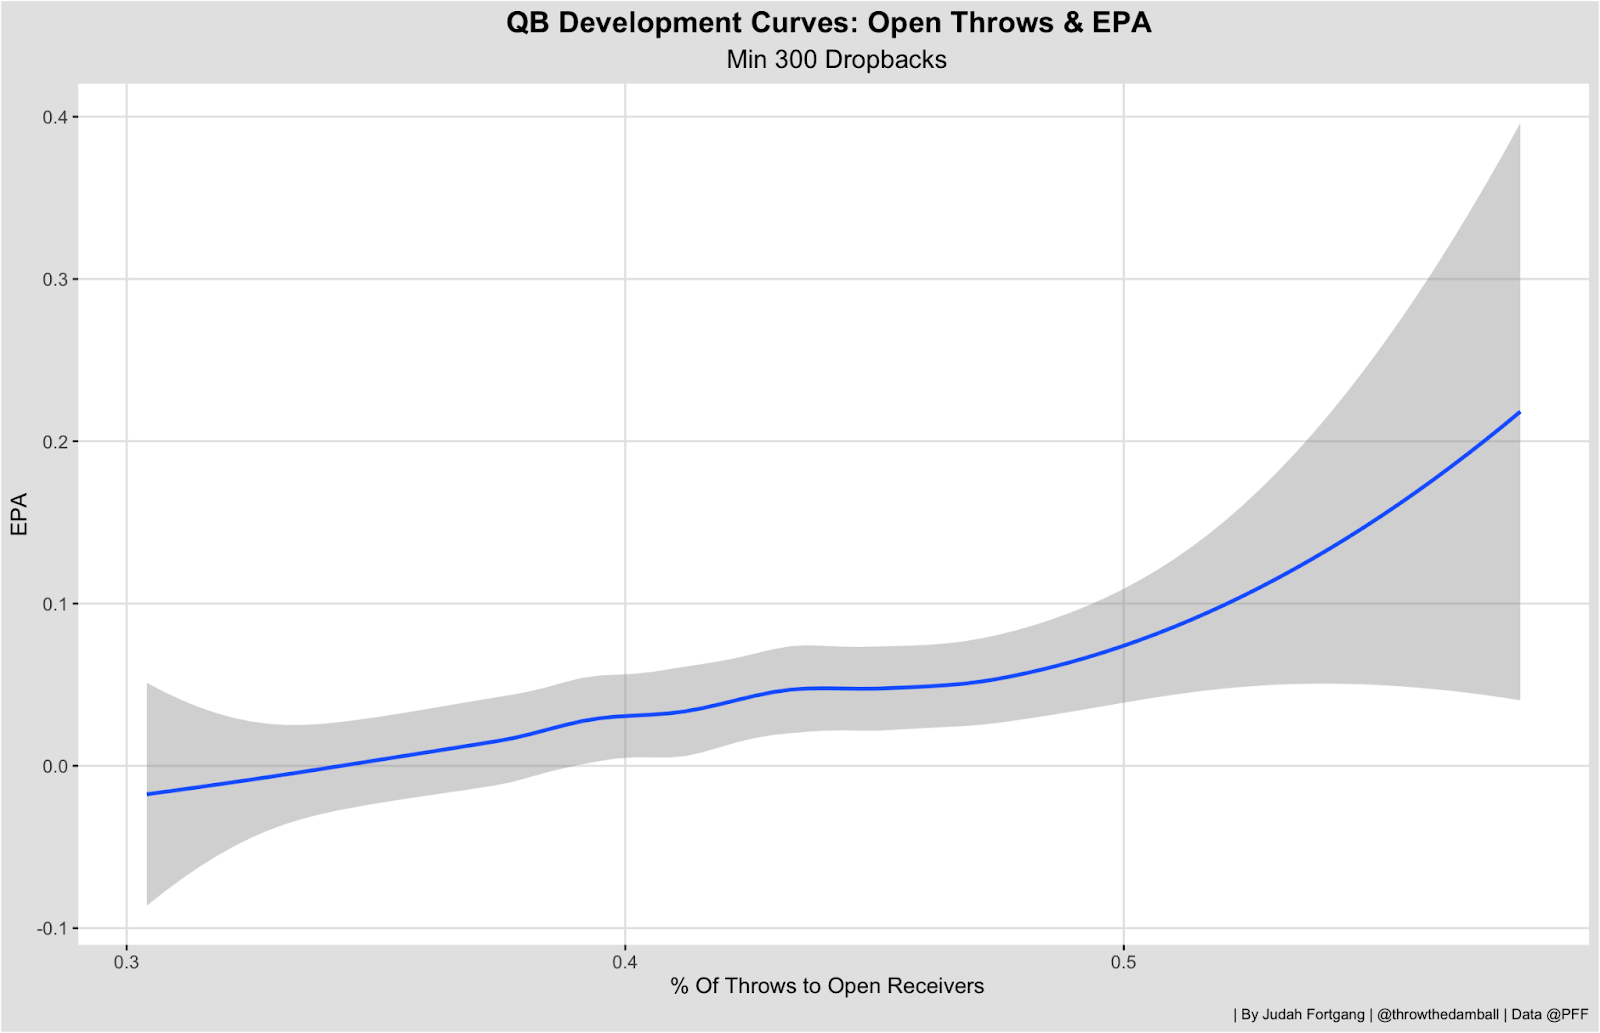
While throws to open receivers are important factors of development, following our curve from earlier, the difference in open throws at 32% to 40% does not account for the full quantity of observed production.
But let’s take this a step further. Of all of the component parts we’ve identified — again, not exhaustive — decision-making is the only one lacking a real trade-off with some other area of play.
Let’s explain this a bit more: Consider “accuracy,” which faces a trade-off with aggressiveness. A quarterback will always be more accurate on shorter throws, but that does not always lead to the best results. Sometimes, it is best to be more aggressive. Staying in rhythm comes at the cost of a chance to extend a play to hit the moonshot, game-changing play. With decision-making and throw selection, the only trade-off is with the other possible decisions or throws — nothing external.
This brings us to our main point and the premise for this upcoming series: To understand the complexities of quarterback play and our ability to predict future performance and development, it is worthwhile to first understand the styles and traits of unique quarterbacks so as to learn the trade-off between different component parts and how they will maximize production for that style of player. Jalen Hurts is the perfect example:
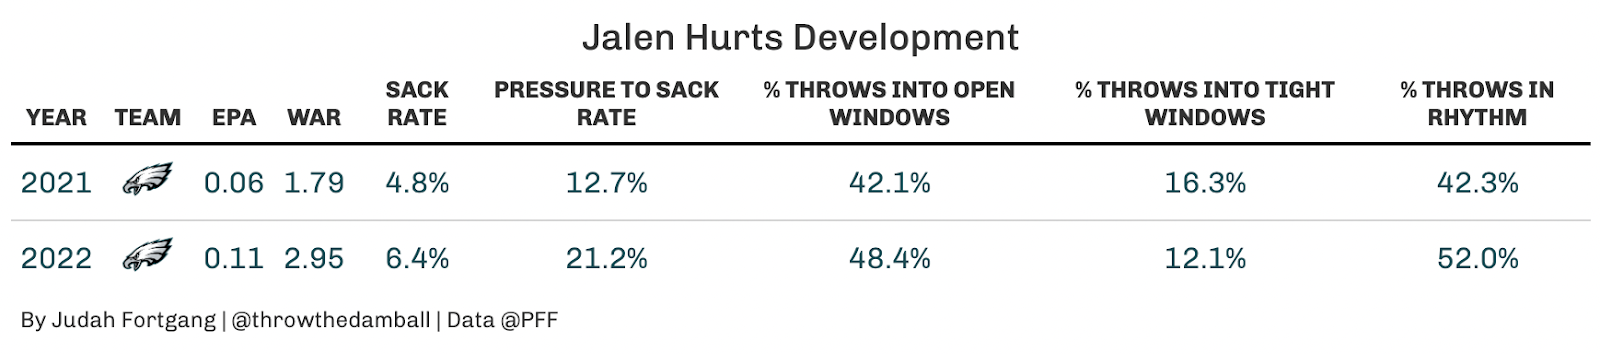
Hurts had a breakout year in 2022 despite taking more sacks than in his previous two seasons, and his pressure-to-sack rate jumped by 10 percentage points. In the aggregate, taking more sacks is, of course, bad for production. But for Hurts, a quarterback who can extend plays well, the sacks were a trade-off for holding onto the ball longer. His pocket extension was at a career high despite his taking less time to throw in the aggregate, which led to a massive spike in throws to open windows and throws in rhythm. That far outweighed the cost of those sacks. Tom Brady or Kirk Cousins didn't/don’t face the same trade-off because they’d be sacked far sooner than when Hurts is releasing the ball.
Similar to the snapshot on Hurts, over the next bunch of articles we will take a deeper look at quarterback skills and traits, introduce some new stats and learn how interactions and trade-offs of these skills can help us separate outliers from noise and better predict future quarterback production and development, depending on the contexts in which they find themselves.
