The 2019 NFL regular season comes to a close Sunday night in Seattle, and it has certainly been a wild year. All four AFC division champions from 2018 repeated this season, while at least two (and three if the Philadelphia Eagles win) divisions changed hands in the NFC. The league's likely MVP was the fifth quarterback chosen in last year’s draft, and some of the league’s best defenses to start the season are showing signs of weakness as injuries and regression begin to factor in. The two teams battling for the last AFC playoff spot have both benched quarterbacks throughout the season (in the case of the Pittsburgh Steelers, multiple times). The Kansas City Chiefs and the New Orleans Saints are legitimate Super Bowl contenders that likely will not secure first-round byes, a feat we haven’t seen since the Baltimore Ravens took home the crown in 2012. Speaking of the Ravens, they secured home-field advantage in the AFC playoffs for the first time in team history. The storylines are endless.
In this piece, we use models built with the help of AWS to take a look at some of the math going into the playoffs and what that means moving forward.
Each team’s evolution
Our team-level metric, PFFELO, uses the Elo algorithm to update team strength each week by how they played against each opponent, with the latest weeks’ games weighed more heavily. We use a machine-learning algorithm to assign a score to each game based on how well each team played in each facet of play. These numbers generally do well in approximating the Vegas spread of a game (with an R-squared value around 0.75), but they don’t always correspond with true record or point differential, since teams (like the Seattle Seahawks) can have streaks of lucky outcomes that don’t line up to the fundamentals on the field.
The NFC Playoff Picture
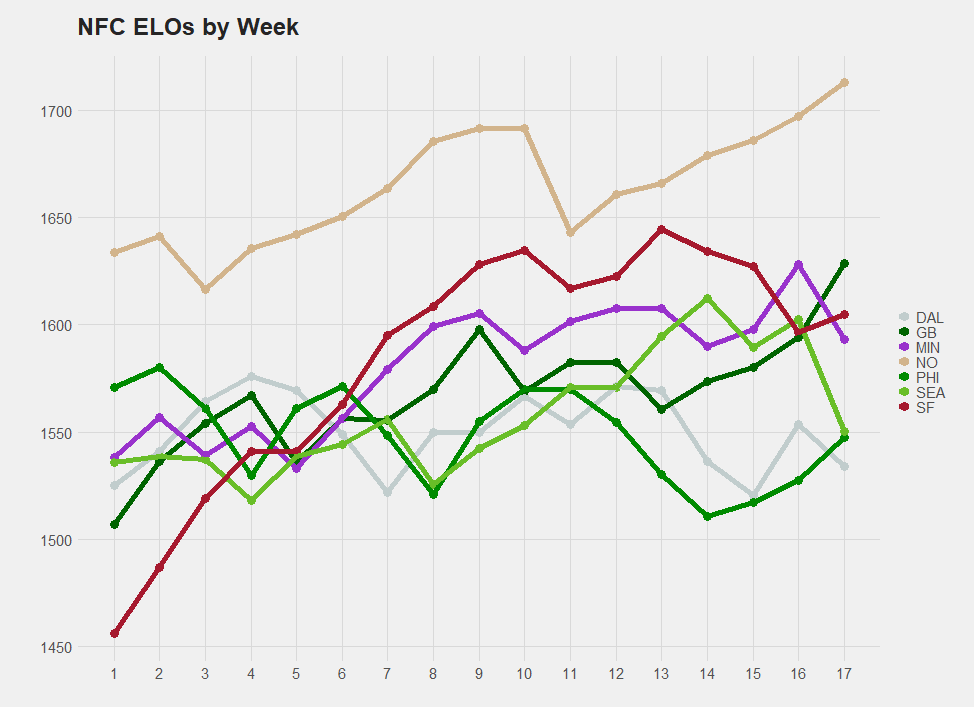
From our perspective, the Saints have been the class of the NFC for the entire season. And while the tide has mostly risen for all of the NFC playoff teams over the course of the season, the Saints have been basically two blips away from having a monotonically rising stock in our eyes.
Interesting to note: We graded the Saints’ Week 14 loss to the San Francisco 49ers as a 1.7-point win for them, hence the lack of a dip going into Week 15.
The AFC Playoff Picture:
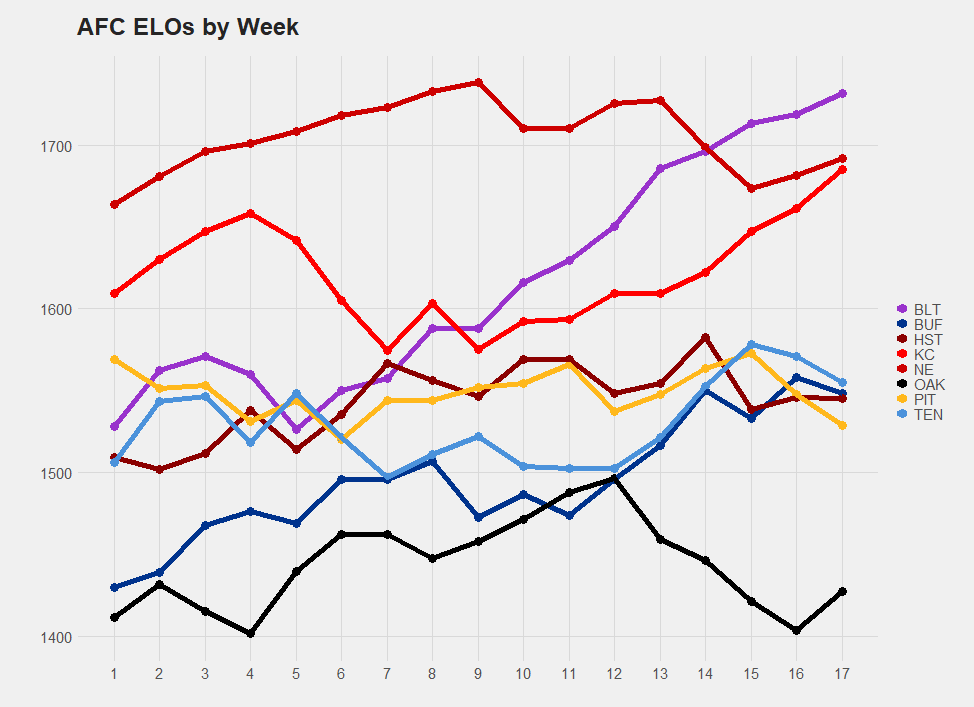
There’s a lot more to break down in the AFC. First, the Ravens' ascent is something that surprised even us, as we did not consider them an elite team going into the season. The Buffalo Bills and Oakland Raiders were experiencing similar trajectories until Oakland’s game against the New York Jets, where a divergence occurred. After a rough patch, the Chiefs have seen their fortunes increase at a rate similar to the Ravens, and they are probably the most dangerous team in the AFC not named Baltimore at this point. The Houston Texans are every bit as enigmatic in the metrics as they are via our perceptions — they are currently rated below a Tennessee Titans team that has suffered two-straight losses.
Evaluating Worth of Rosters
Now that we have a metric that values players using PFF grades, we can use it to get a view on how good the rosters are for each team. We added up the WAR generated by each team’s roster as a measure of team strength and ranked the teams:
NFC (with overall ranks)
NO (1st), DAL (2nd), SEA (5th), MIN (7th), GB (9th), SF (10th), PHI (11th)
AFC
BAL (3rd), NE (4th), TEN (6th), KC (13th), BUF (18th), HOU (19th), PIT (20th), OAK (22nd)
One thing to observe here is that the NFC is the superior conference, with teams such as the Bills and Texans reaching 10 wins despite having rosters that aren’t particularly impressive from a value standpoint.
These lists can help us find which coaches are punching above or below their weight class so far this year. We talked about some of the things that hurt the Dallas Cowboys earlier this week, and coaching is likely chief among them (after variance). Kansas City has had to deal with injuries to key positions on both offense and defense all season, and both have been worth more in terms of wins than the sum of the parts, again showing Andy Reid to be among the league’s best. The positioning of San Francisco and Seattle also tells you a lot.
Quarterbacks
While quarterbacks drive a great deal of the value seen above, isolating their play is also instructive. Using our quarterback-clustering algorithm, we look at how the quarterbacks tier going into Week 17:
[table id=1308 /]
Tier 1: Russell Wilson (SEA), Lamar Jackson (BLT), Patrick Mahomes (KC), Drew Brees (NO), Ryan Tannehill (TEN)
The obvious outlier here is Tannehill, who is leading the league in positively graded throw rate (33.8%) while also limiting negatively-graded throws at the second-best rate (9.0%).
Tier 2 (safe): Jimmy Garoppolo (SF), Kirk Cousins (MIN), Derek Carr (OAK)
This group is characterized by low big-time throw/low turnover-worthy play rates. Garoppolo, specifically, has leaned on the outlier after-the-catch play of George Kittle, generating an average depth of target of fewer than 6.5 yards en route to his first playoff berth.
Tier 2 (risky): Deshaun Watson (HST)
The “Jameis Cluster” includes one player in this year’s playoff race. Watson oscillates between one of the most fun and one of the most frustrating players to watch on a weekly basis, producing big-time throws at one of the highest rates in the league but almost doubling the turnover-worthy throw rate of some of the league’s best quarterbacks.
Tier 3 (safe): Aaron Rodgers (GB), Tom Brady (NE)
You read this right. Both of these signal-callers have been snake-bitten by poor receiving corps and schedules that haven’t exactly forced them to be brilliant. But each has also not played up to their reputations. Both are in the bottom-10 in the league in percentage of positively graded throws.
Tier 3 (risky): Carson Wentz (PHI), Josh Allen (BUF)
Allen leads the NFL in percentage of negatively graded throws, but he has improved in that area as of late. And Wentz’s offense is gaining only 0.87 actual passing yards for each one of his air yards. Both teams are likely outs in the first round of the playoffs due to deficiencies in their offensive passing games.
Tier 4: Whoever starts at quarterback for Pittsburgh (PIT)
Need we say more?
