• If one were to blindly bet various player props since the start of the 2020 season, passing-yardage unders is the lone profitable category (+14.06 units).
• No prop category hits to the under quite like receiving yardage for running backs — +108.09 units in our dataset.
• It’s a painstaking sweat, but betting the under on lowly yardage numbers has been a profitable strategy, with 10-19 receiving yards up 70+ units, 0-9 rushing yards up nearly 30 units.

Last updated: Nov. 10, 11:15 a.m.
Estimated reading time: 5 mins
At essentially the halfway point of the season, it’s the perfect time to dig deeper into specific player prop category trends to get a baseline for what performs best from a macro standpoint.
Next week we will dive further into the ability of bookmakers to accurately price player outcomes in specific categories. But let’s start with a simple table most readers have seen before in some form: Prior player prop performance from a units-won perspective over the entire timeframe of our dataset (the start of the 2020 season).
Basically, if we bet every prop blindly on the over or under, these are the outcomes.
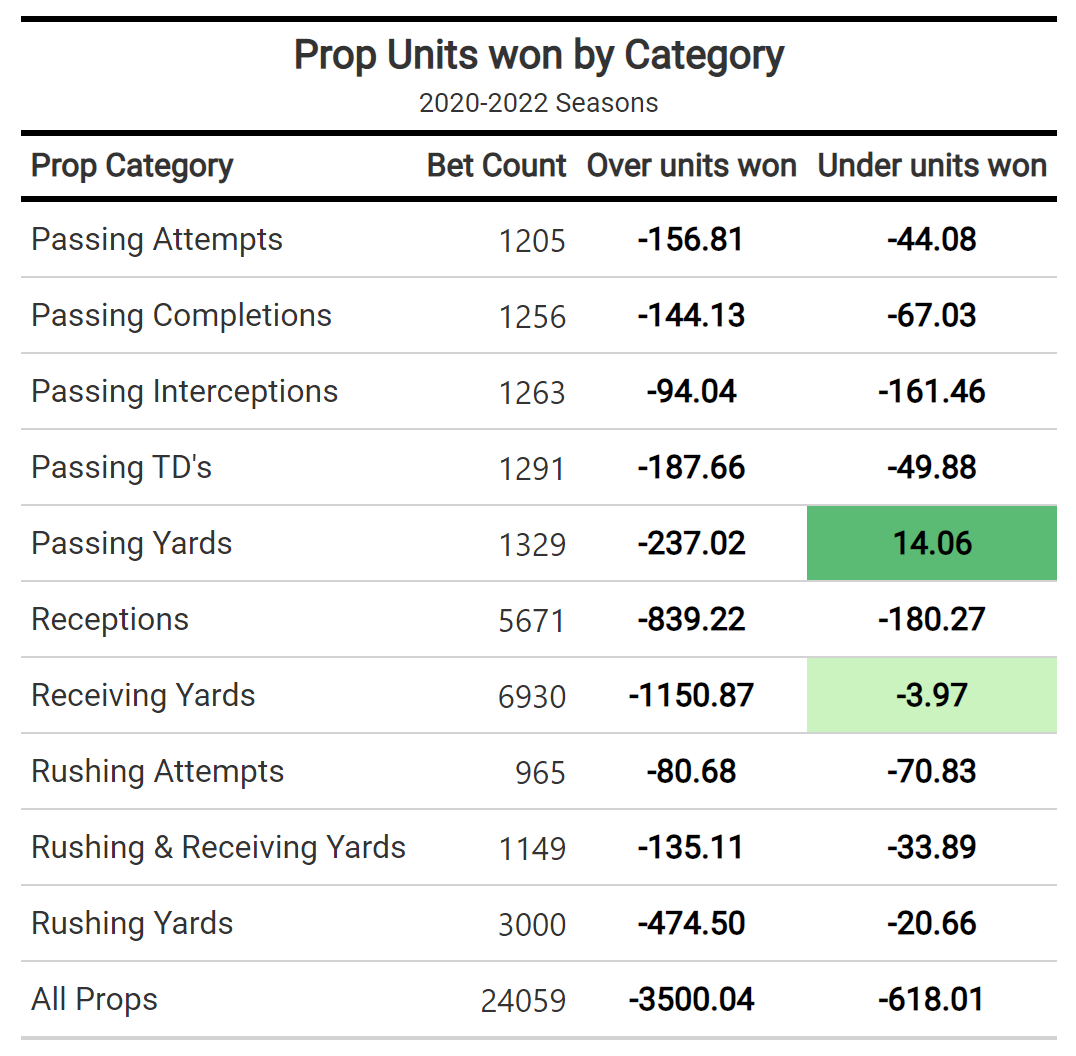 • Passing-yardage unders is the only profitable prop category to blindly bet over the past three seasons.
• It’s really difficult to be successful over the long term betting receiving-yardage overs.
GROUPED BY SEASON
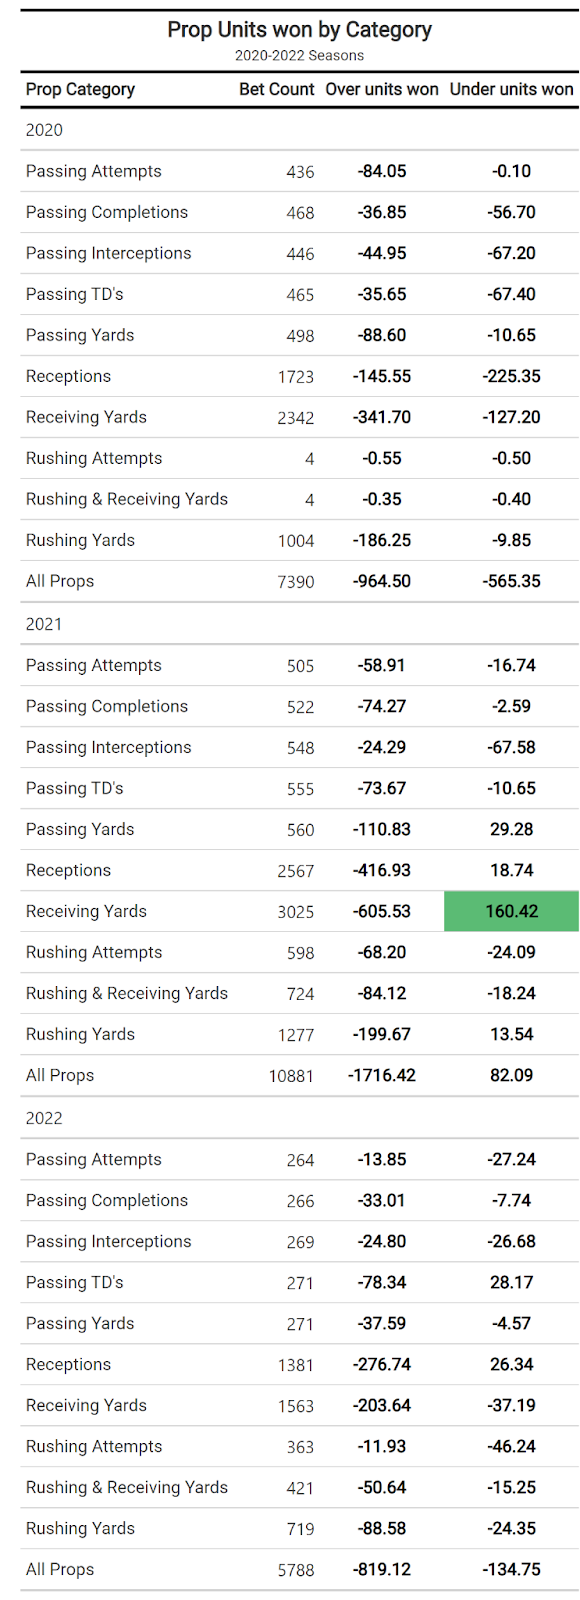
• The 2021 season was historic for betting player prop unders: Led by receiving-yardage unders. Most passing and receiving yardage categories were profitable (or close to) betting unders.
• Scoring is down in 2022, dramatically impacted passing-touchdown props: The win-loss record is even more skewed because of the heavy juice bettors need to typically pay on one side of this bet.
POSITION-SPECIFIC PERFORMANCE
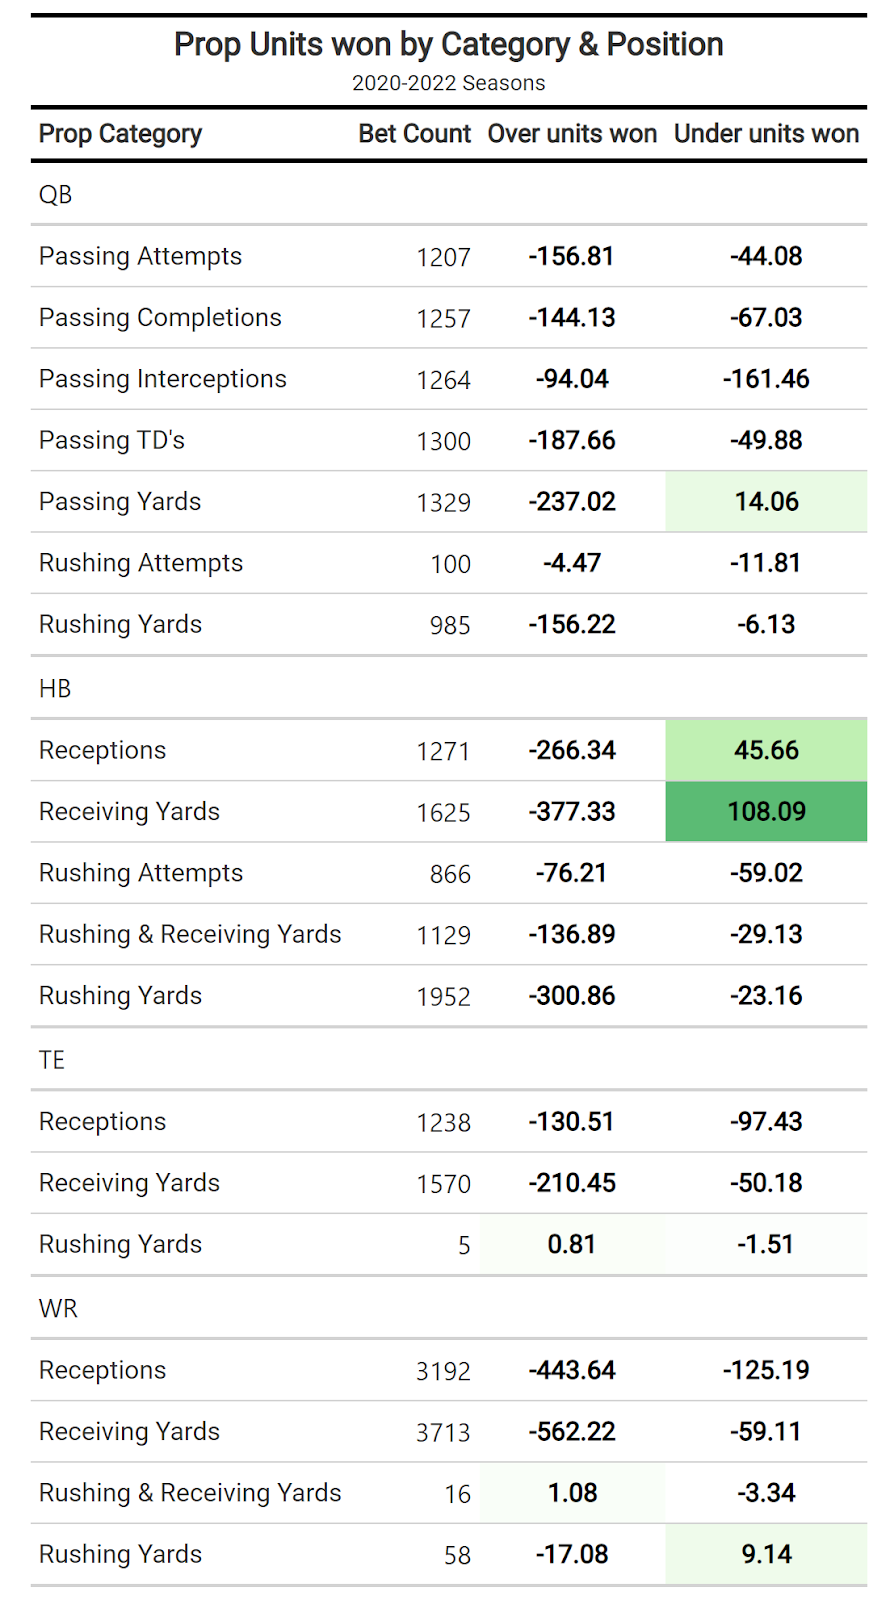
• No prop category hits quite like receiving prop unders for running backs, especially if they don’t get the intended game script bookmakers price in: A big reason why reception and receiving-yardage props can be so profitable to the under is that bookmakers struggle to accurately price RB performance in these categories.
• WR rushing-yardage prop (known as the Deebo Samuel bet): Is one of the better small-sample-size opportunities to take advantage of. The volume simply isn’t there for a majority of guys and if their one opportunity doesn’t work out, is an easy finish on the under.
WR PERFORMANCE BY PRIOR ROUTES RUN TEAM RANKING
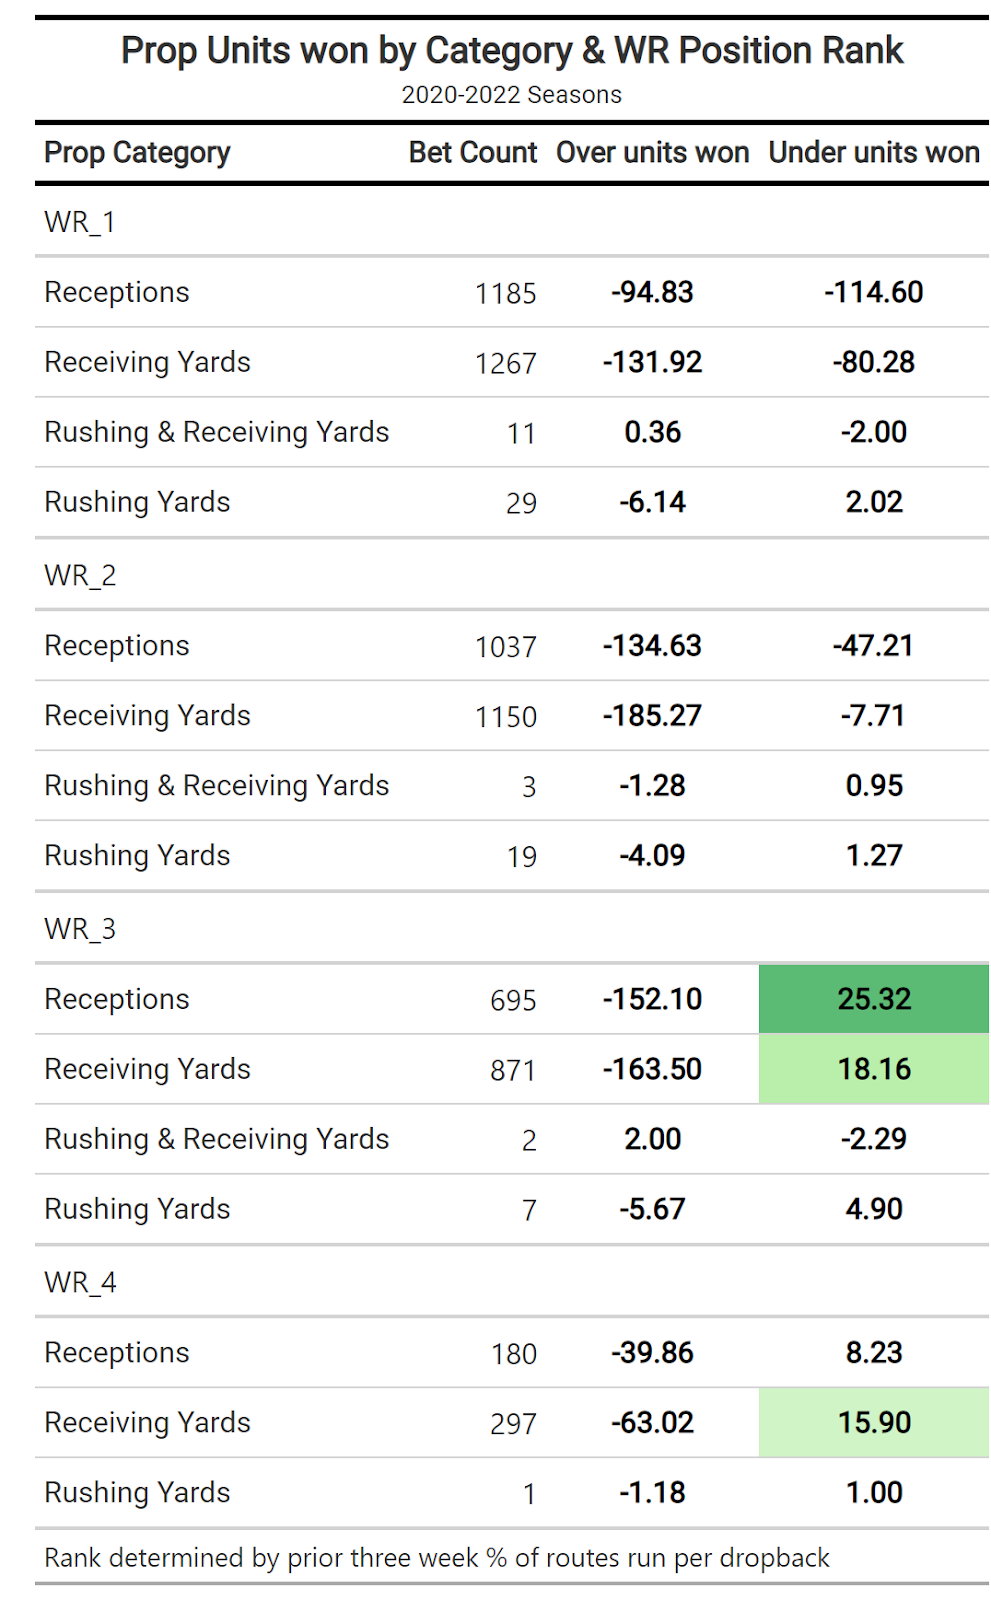
Usage is the most difficult thing to project from a player-prop standpoint
We see that play out when looking at wide receiver performance based on rank in their respective team’s offense. The further down the totem pole we get, the easier it is to find players that are simply not involved.
• Often it's a trendy name emerging from the fantasy community that people want to bet on as a WR3: But this looks like another great spot to fade the public and expect the player to underperform based on somewhat inaccurate expectations.
HB PERFORMANCE BY PRIOR RUSH ATTEMPT PERCENTAGE TEAM RANKING
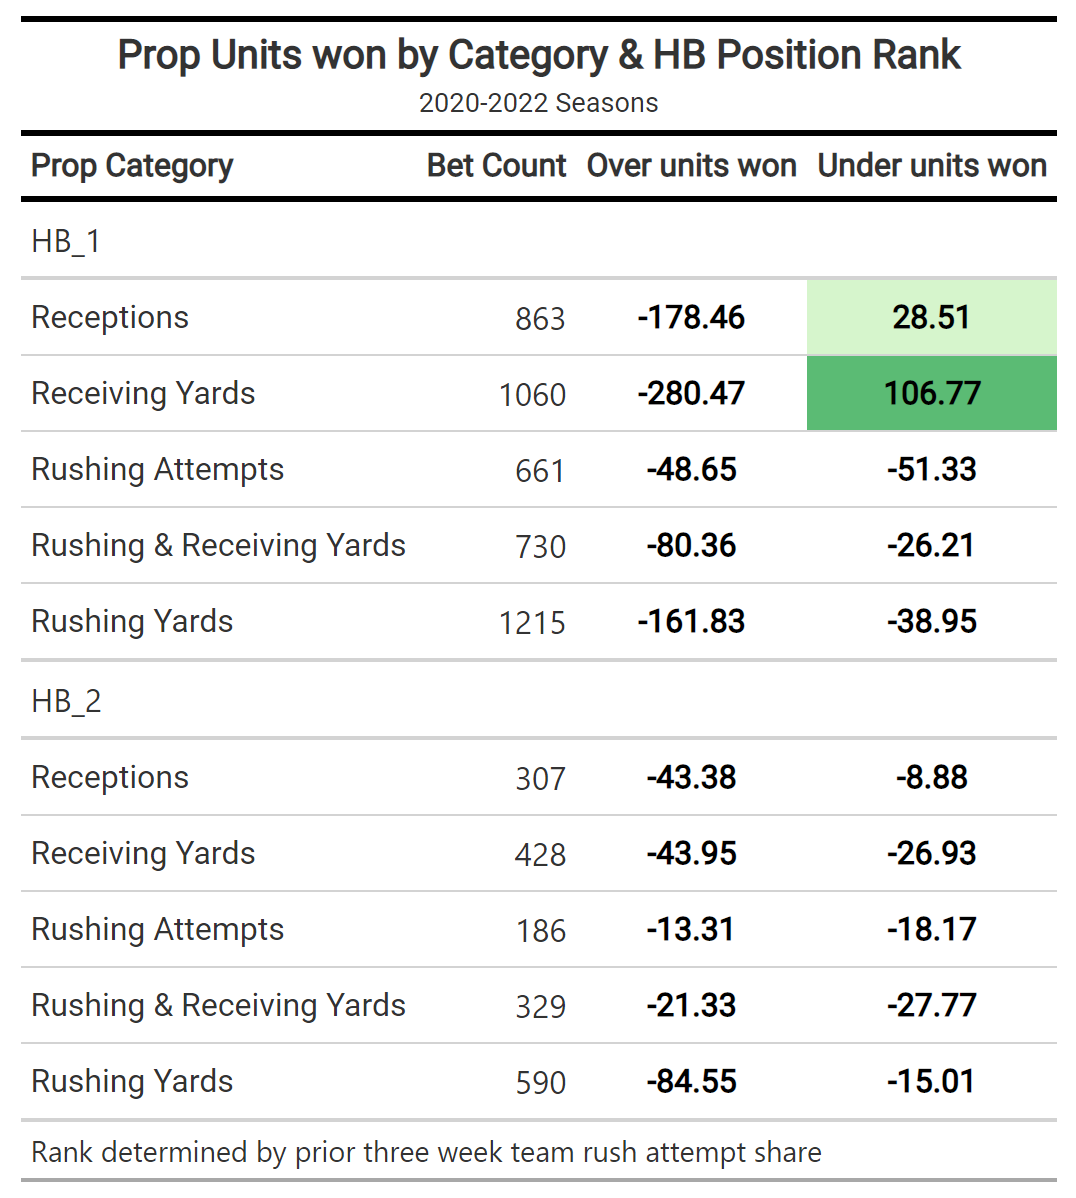
• The big edge seems to be on 1A-type running backs not getting nearly as much volume in the passing game as bookmakers project: This is a big reason why the reception and receiving yardage categories have been so heavily tilted toward the under. Targeting various running backs who fit this category is one of the best ways to work with the trend from a prop-betting perspective.
PLAYERS TEAM A FAVORITE OR UNDERDOG
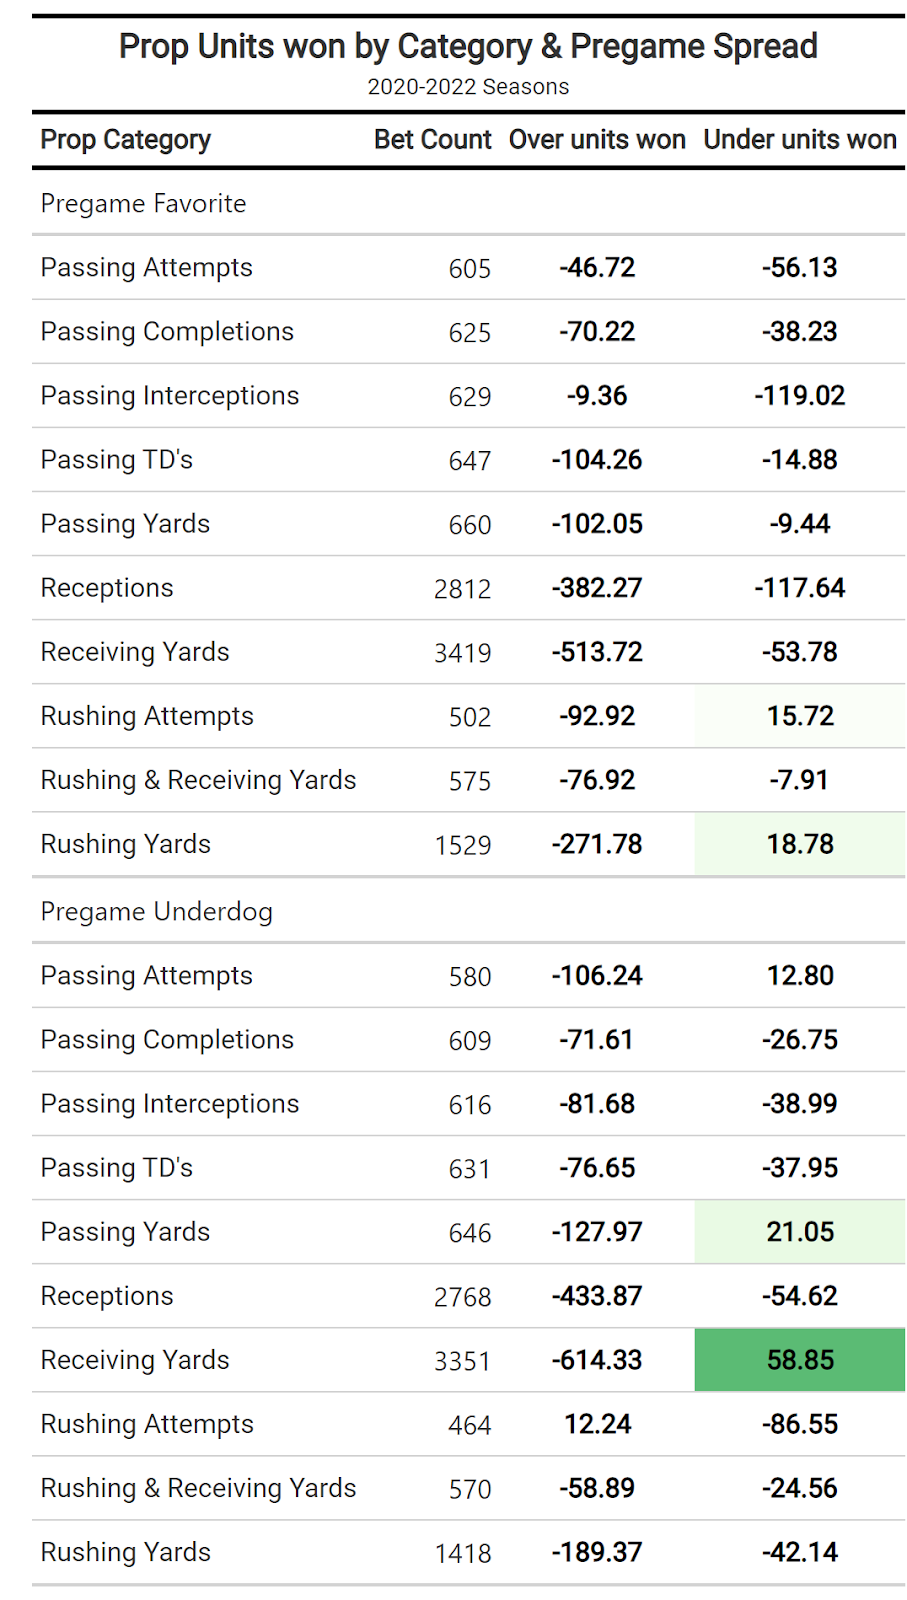
• Rushing attempts and rushing yardage unders are actually positive value over the past three seasons: As books are adjusting too much to a team being favored and boosting the subsequent rushing volume as a result.
• Conversely, unders on receiving and passing props have been profitable from an underdog perspective: Because either these teams didn’t need the volume to throw as much as expected or they were so bad they didn’t come close to hitting lofty passing-game projections. Either way, a counter approach to the general consensus continues to be a profitable way to find a betting angle.
Team Defense performance against prop categories from 2020-2022
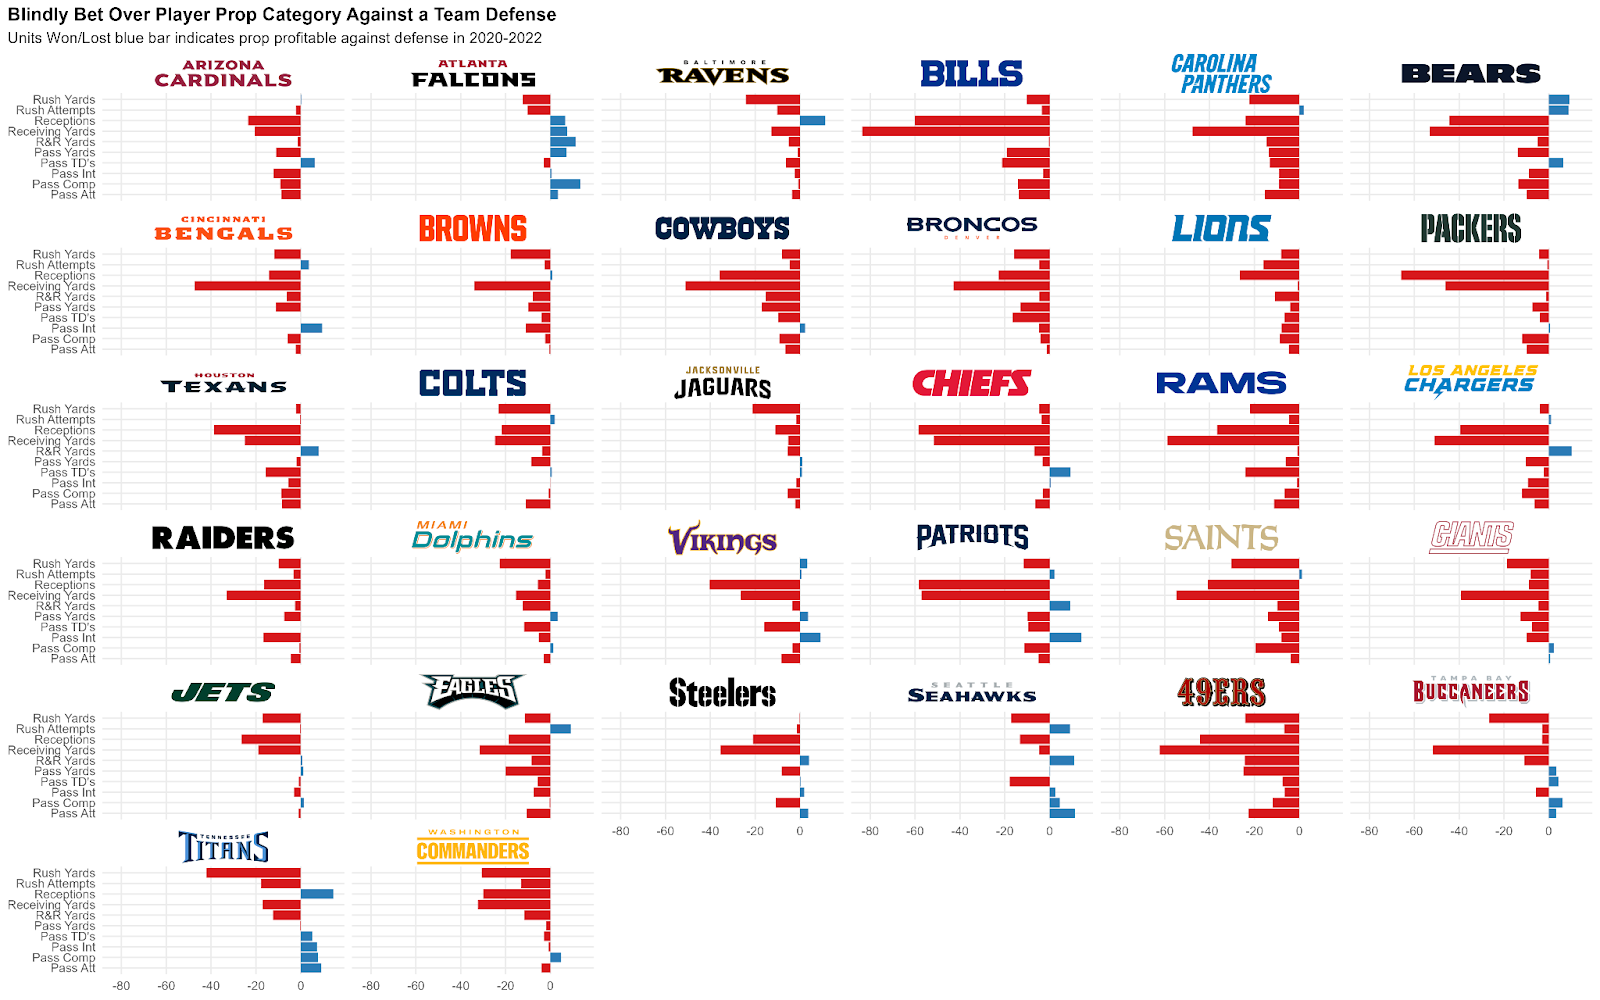
The best defenses might have one or two slip-ups, but they generally get it done over the long haul, as judged against individual performances. Also, the longer the timeframe, the bigger bias toward betting unders, which is why so much red shows up on this chart.
Team Defense performance against prop categories 2022
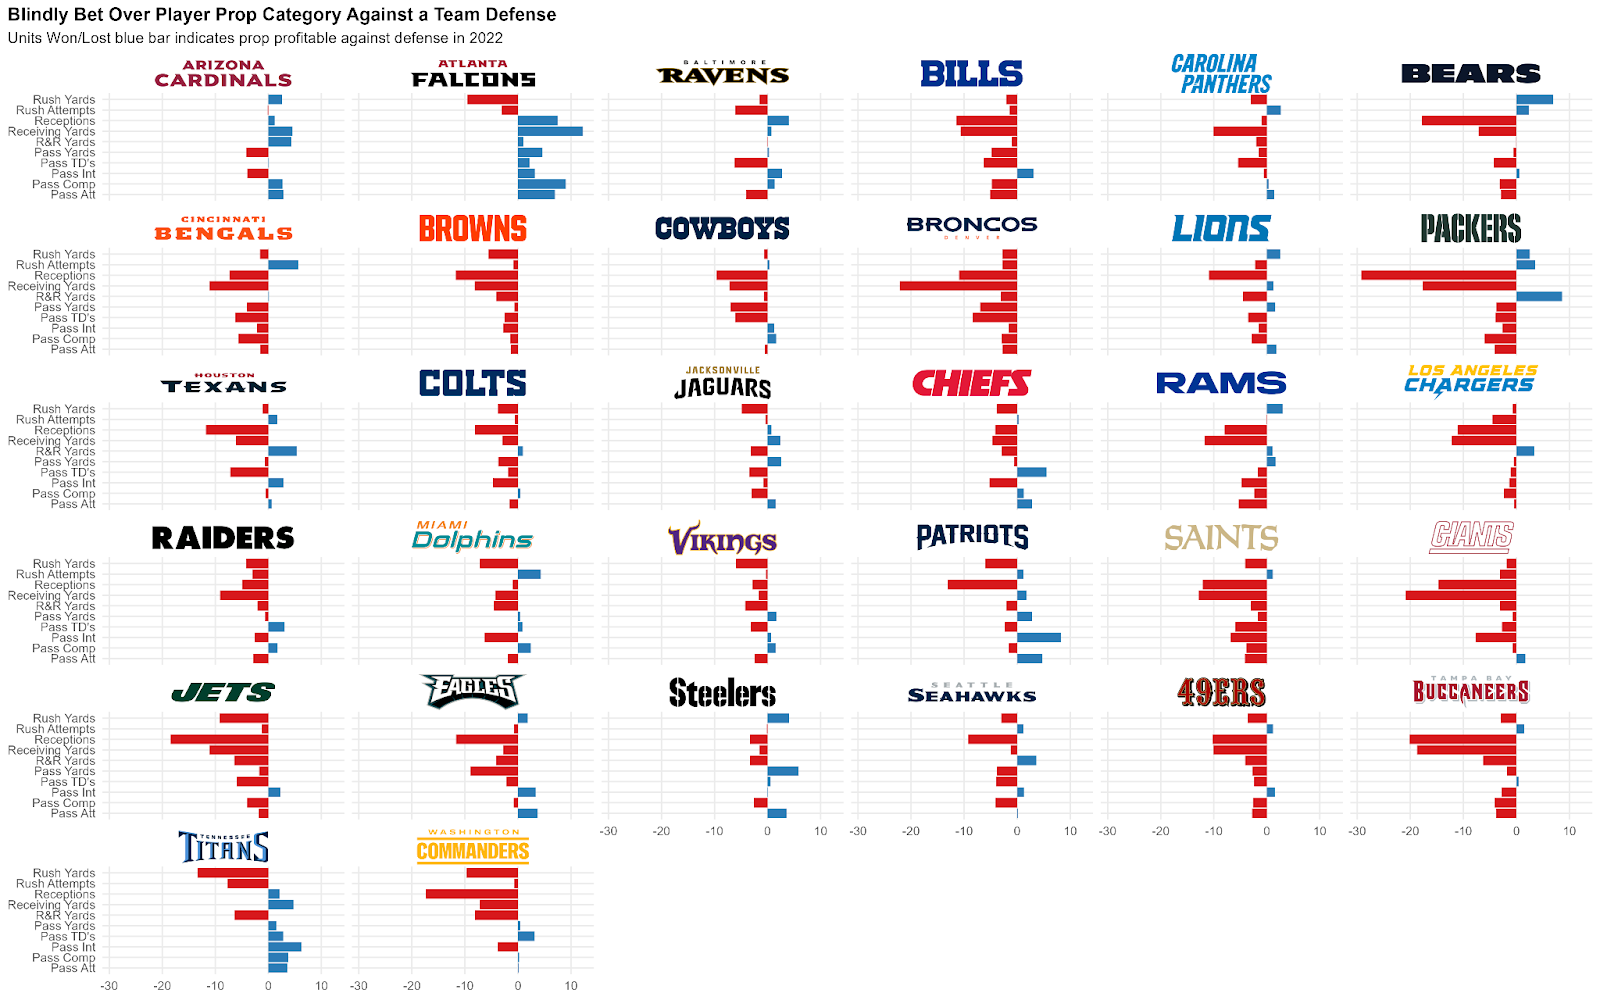
• Playing overs against specific defenses has been profitable: But by and large, it’s much easier to target certain defenses to allow less production than the betting market projects.
• How game theory factors in: As soon as books catch on that a defense is struggling, we should see a shift based on matchup for where that player’s prop number actually closes. So, defenses that have outperformed expectations in one direction could be spots to fade with the expectation they regress toward the mean the second half of the season.
Team Defense Over/Under 2022 record against WR1, WR2, WR3, TE, HB1, HB2
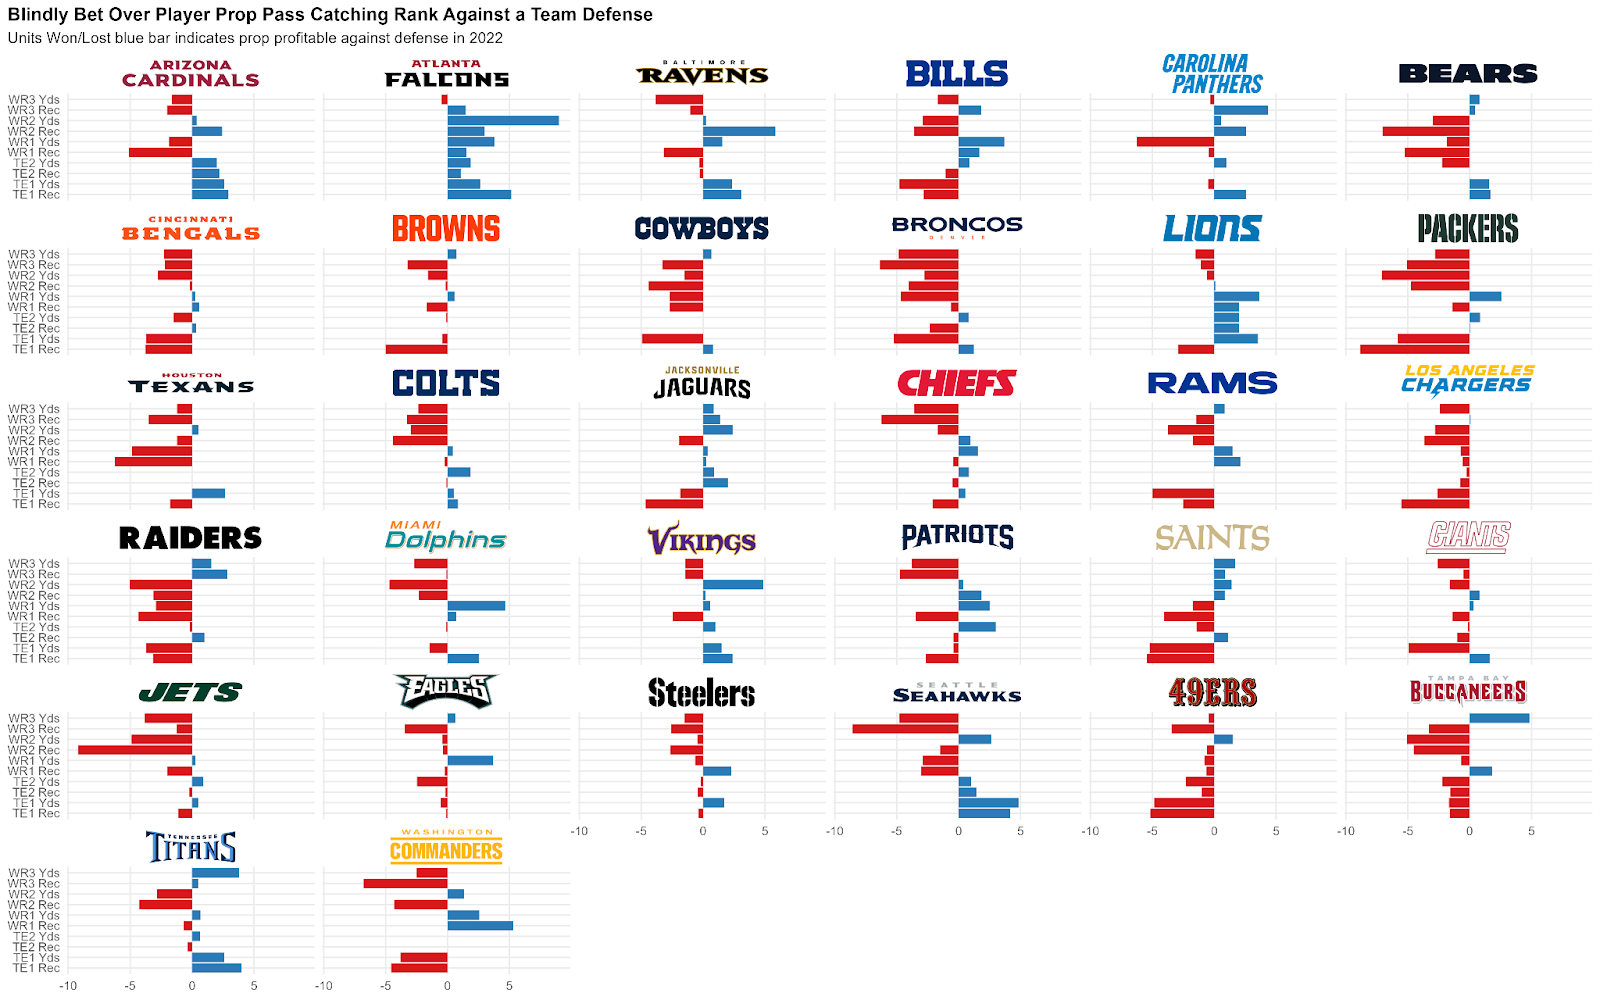
• This is definitely dependent on opposing offenses, but it can also highlight if a team is weak at the CB2 position: Specifically, the Atlanta Falcons have been really poor against WR2-types — and that is definitely a reflection of having no one outside of A.J. Terrell who can cover.
Prop hit rates by yardage interval for rushing and receiving yards
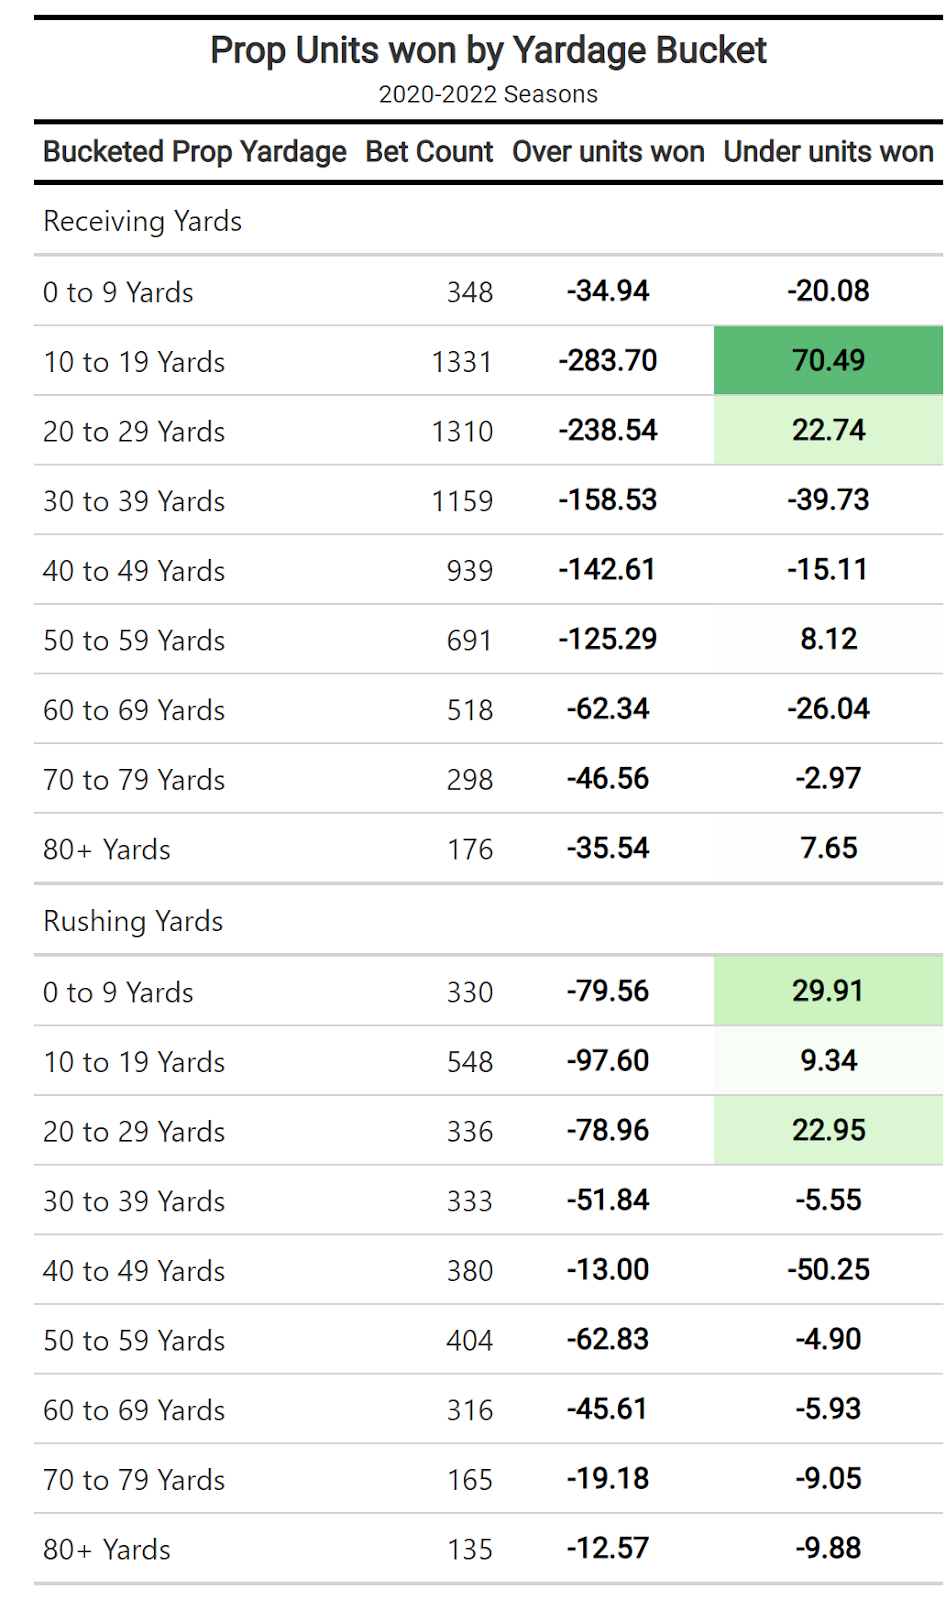
• It’s a painstaking sweat, but betting the under on lowly yardage numbers has been a profitable strategy: Any number of scenarios can play out in which we see a player not expected to be heavily involved fall even short of modest expectations. Whether it's because of usage change, game script or injury, betting on unders specifically in this area is one of the better opportunities to exploit.
Next week, we will go more in depth into the statistical significance of each prop category and try to answer just how good bookmakers are at setting efficient lines compared to the actual result.
We'll update this page weekly with refreshed numbers for the remainder of the season. Other ideas worth examining? Please reach out to me via DM on twitter. Also, a massive shoutout to @ballinballerr for a number of initial ideas in this article.