The NFL's wild-card weekend was relatively quiet for kickers. There wasn’t a single miss, and not one field goal came in a high-leverage situation.
However, with more close games anticipated in the divisional round, the chances that a kicker takes the spotlight are high. In case of a crucial miss or make, the arguments on TV, on Twitter and in bars about the importance of kickers will be heated.
We are here to settle some questions, beforehand. With a new method, we estimate the value of kickers that allows us to compare them directly to players of other positions and their PFF WAR values, look at clutch performances and give actionable info for the NFL draft.
Click here for more PFF tools:
Rankings & Projections | WR/CB Matchup Chart | NFL & NCAA Betting Dashboards | NFL Player Props tool | NFL & NCAA Power Rankings
Best Bets Tool
Setting a Standard
For the scoreboard, the only thing that matters is whether a kick goes through the uprights, but obviously, that’s not a good way to evaluate kickers because different kicks come with different difficulties. Naturally, field goal distance is the largest factor, as we’ve already written about.
Using weather data — though, only at the game level at this point — we can also account for wind speed. The following chart shows how wind affects the likelihood of a successful field goal at each distance. Note that wind speed is set to zero in domes.
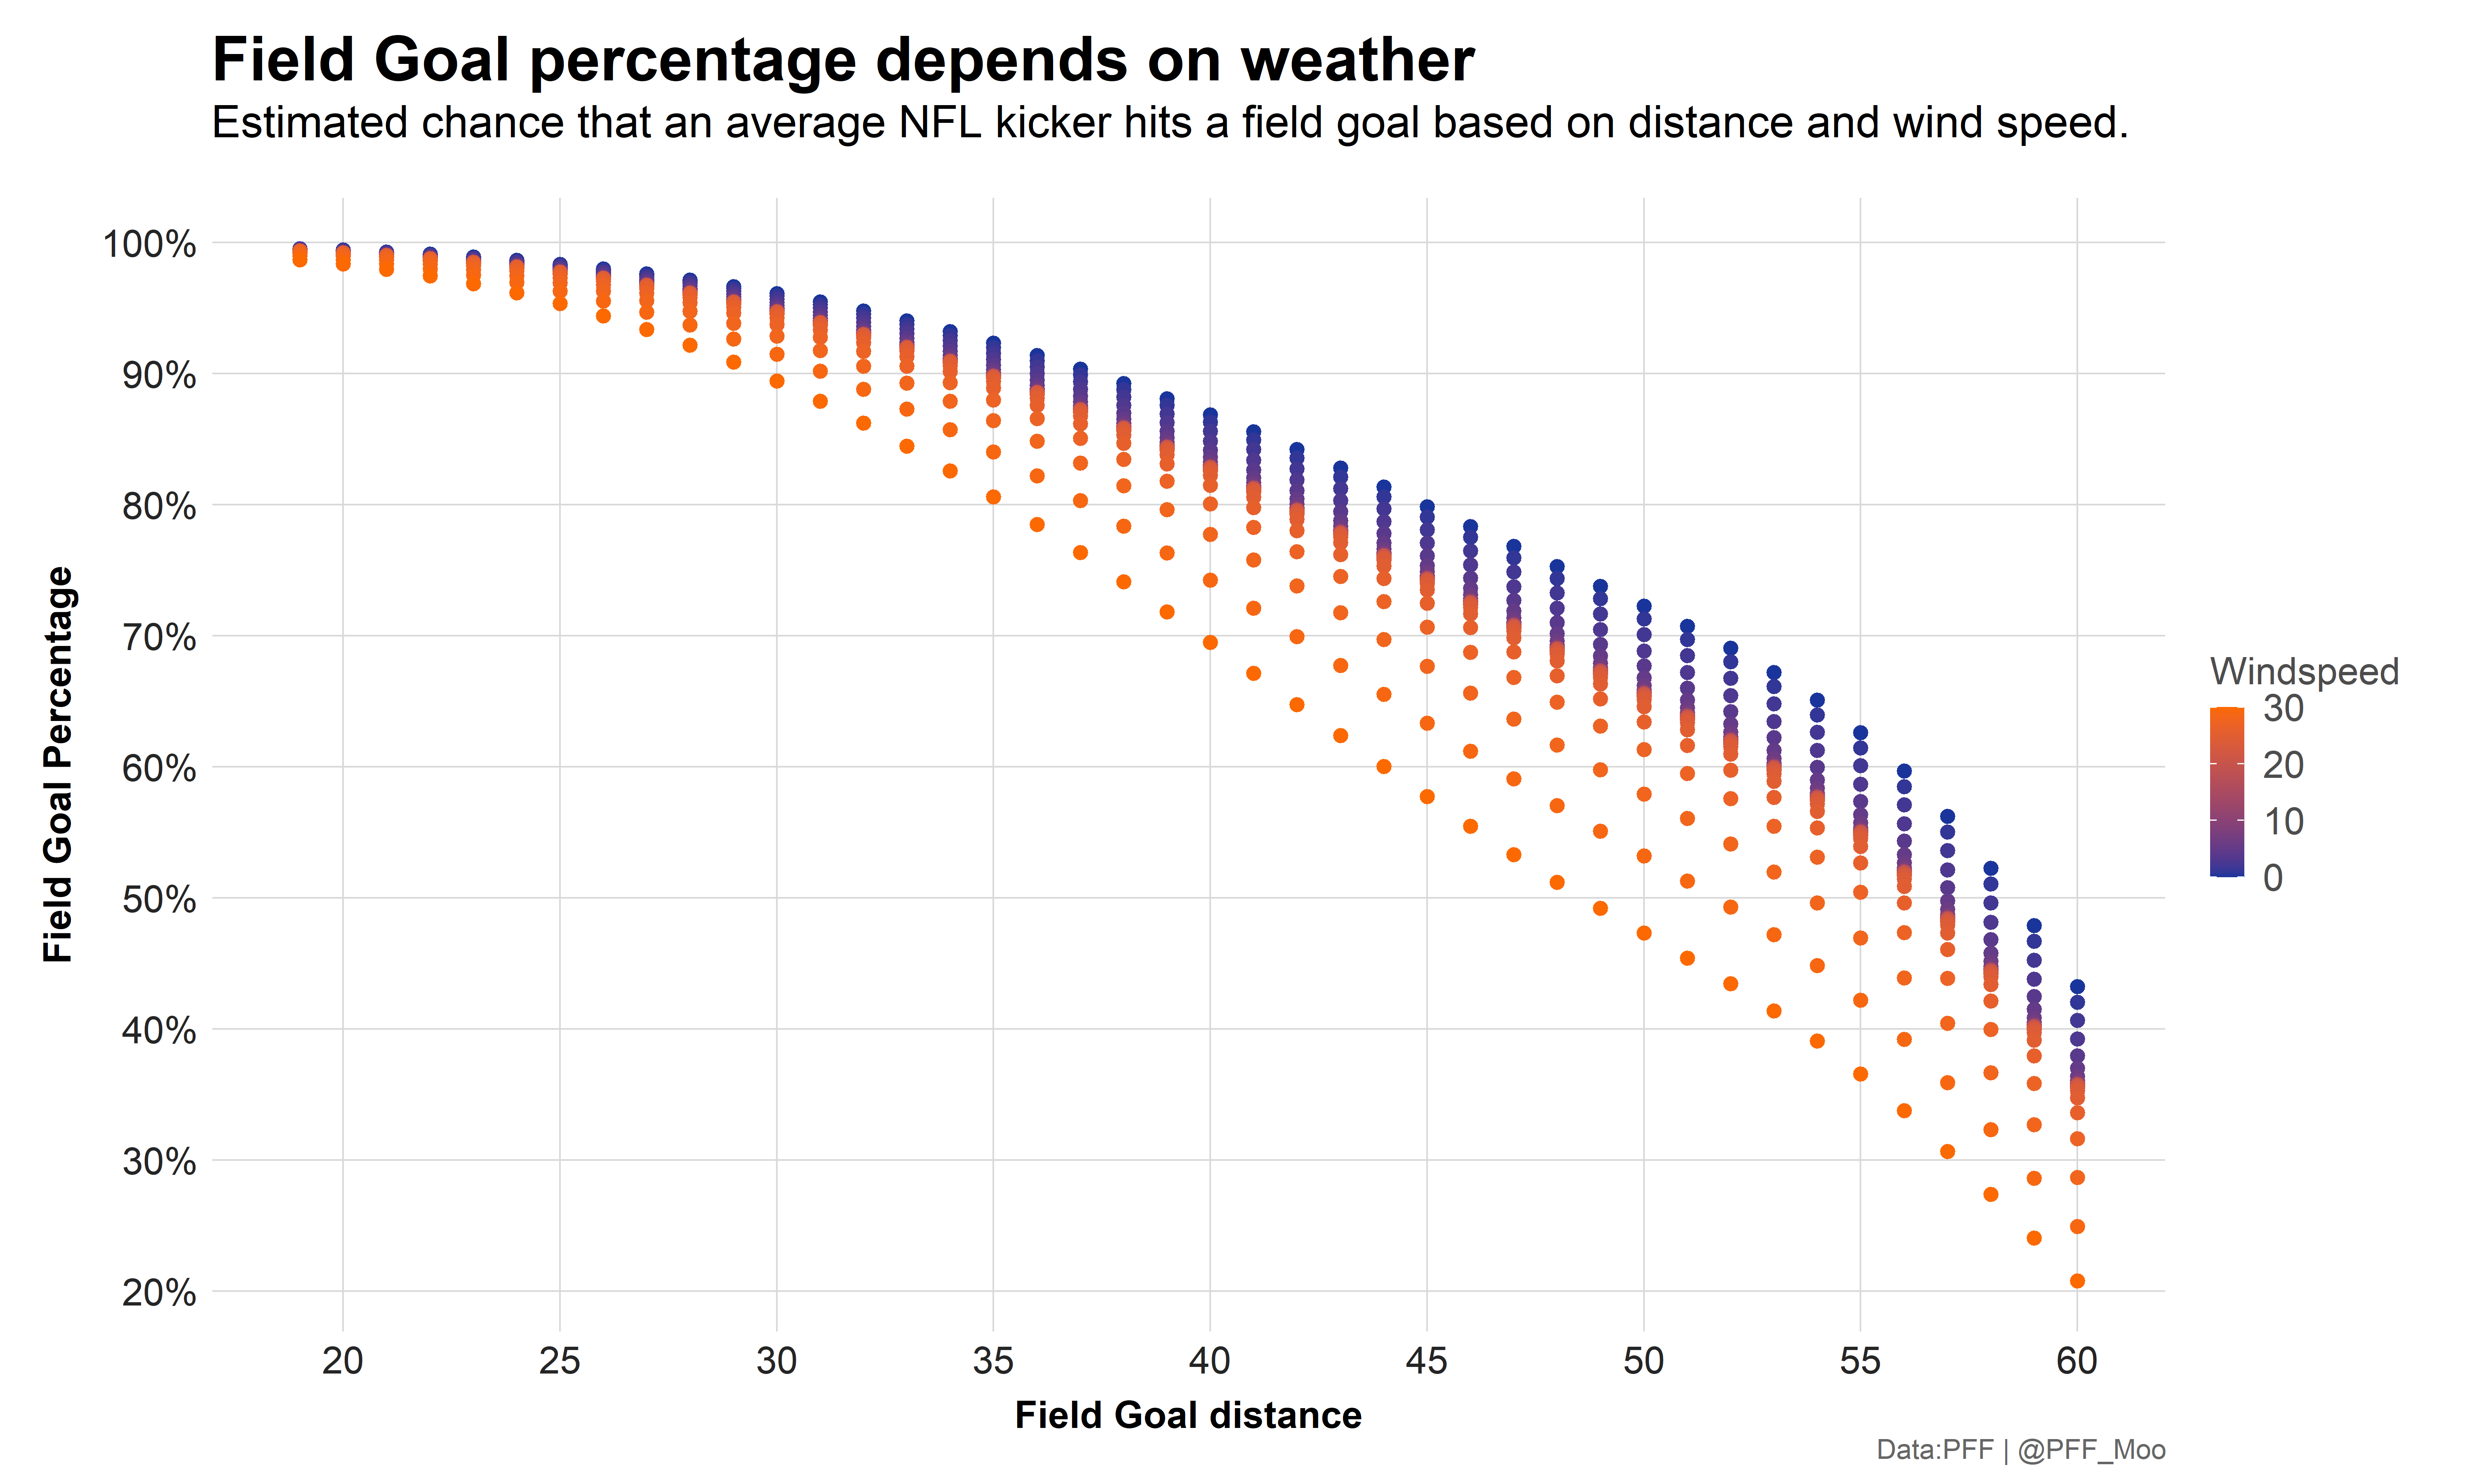
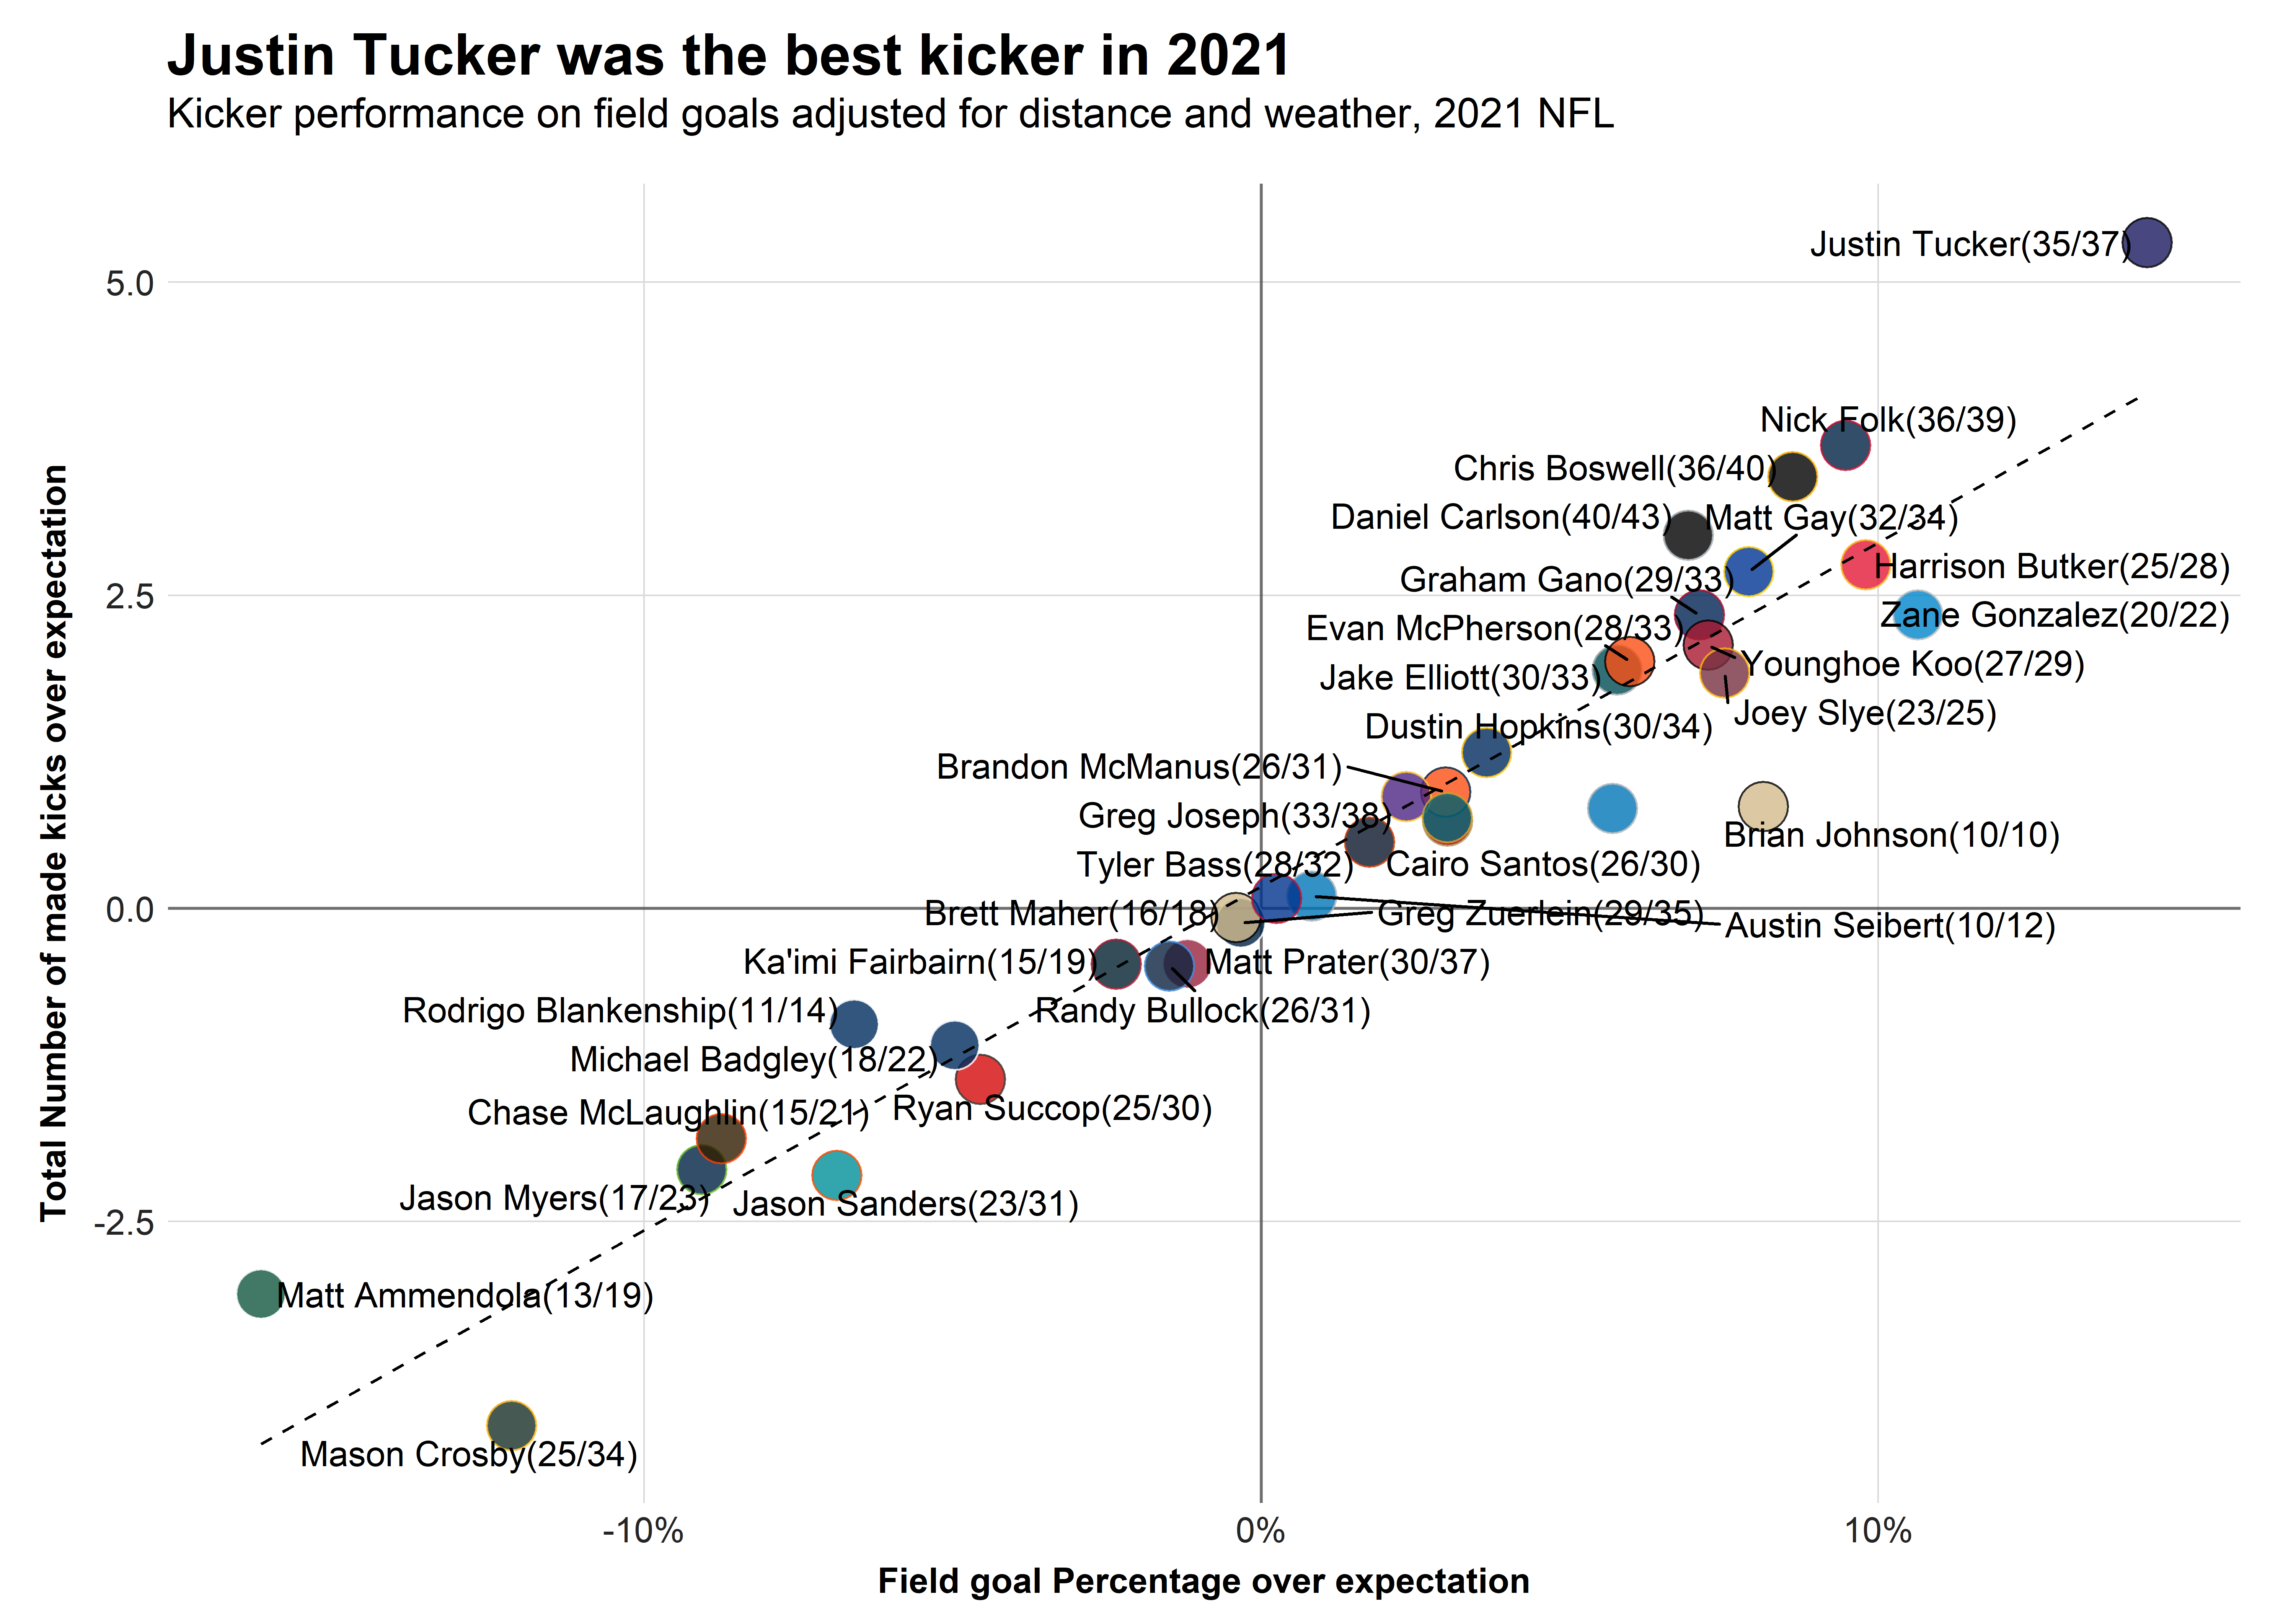
This gives us an expectation for every field goal. By computing the average expectation for the field goals of each kicker, we get an expected field goal rate for every individual. We can compare the actual field goal rate against that to evaluate a kicker by Field Goal Percentage Over Expectation.
This is how kickers stacked up in 2021, both in efficiency (x-axis) and volume (y-axis), which is just the Field Goal Percentage Over Expectation multiplied by the number of attempts.
A Predictive Rating for Kickers
We want to compute the value of a kicker in a predictive sense because all actionable advice comes with a projection for the future. If a team wants to decide how many resources it invests in a kicker, we have to compute the predictive value of a kicker.
Since the sample size of kicks for a kicker is fairly low, we need to adjust the Field Goal Percentage Over Expectation based on the sample size. For instance, if a kicker just joined the NFL and made five 90% field goals in a row — for instance, a 35-yarder with very little wind — their Field Goal Percentage Over Expectation would be +10%, which is better than Justin Tucker’s career average of +8%.
Naturally, nobody would assume that such a kicker would be better than Tucker going forward just because he managed not to shank five chip shots. A good way to account for just that is a Bayesian Updating technique, which we already used to assess kickers.
The result is the best guess of the true ability of each kicker, and we even get an estimated distribution of what the true ability might look like. This allows us to simulate a kicker going forward, which will be our method to determine each kicker’s value.
The following chart shows the results for each kicker who has kicked at least 20 field goals since 2013 and has kicked at least one field goal in the past two years.
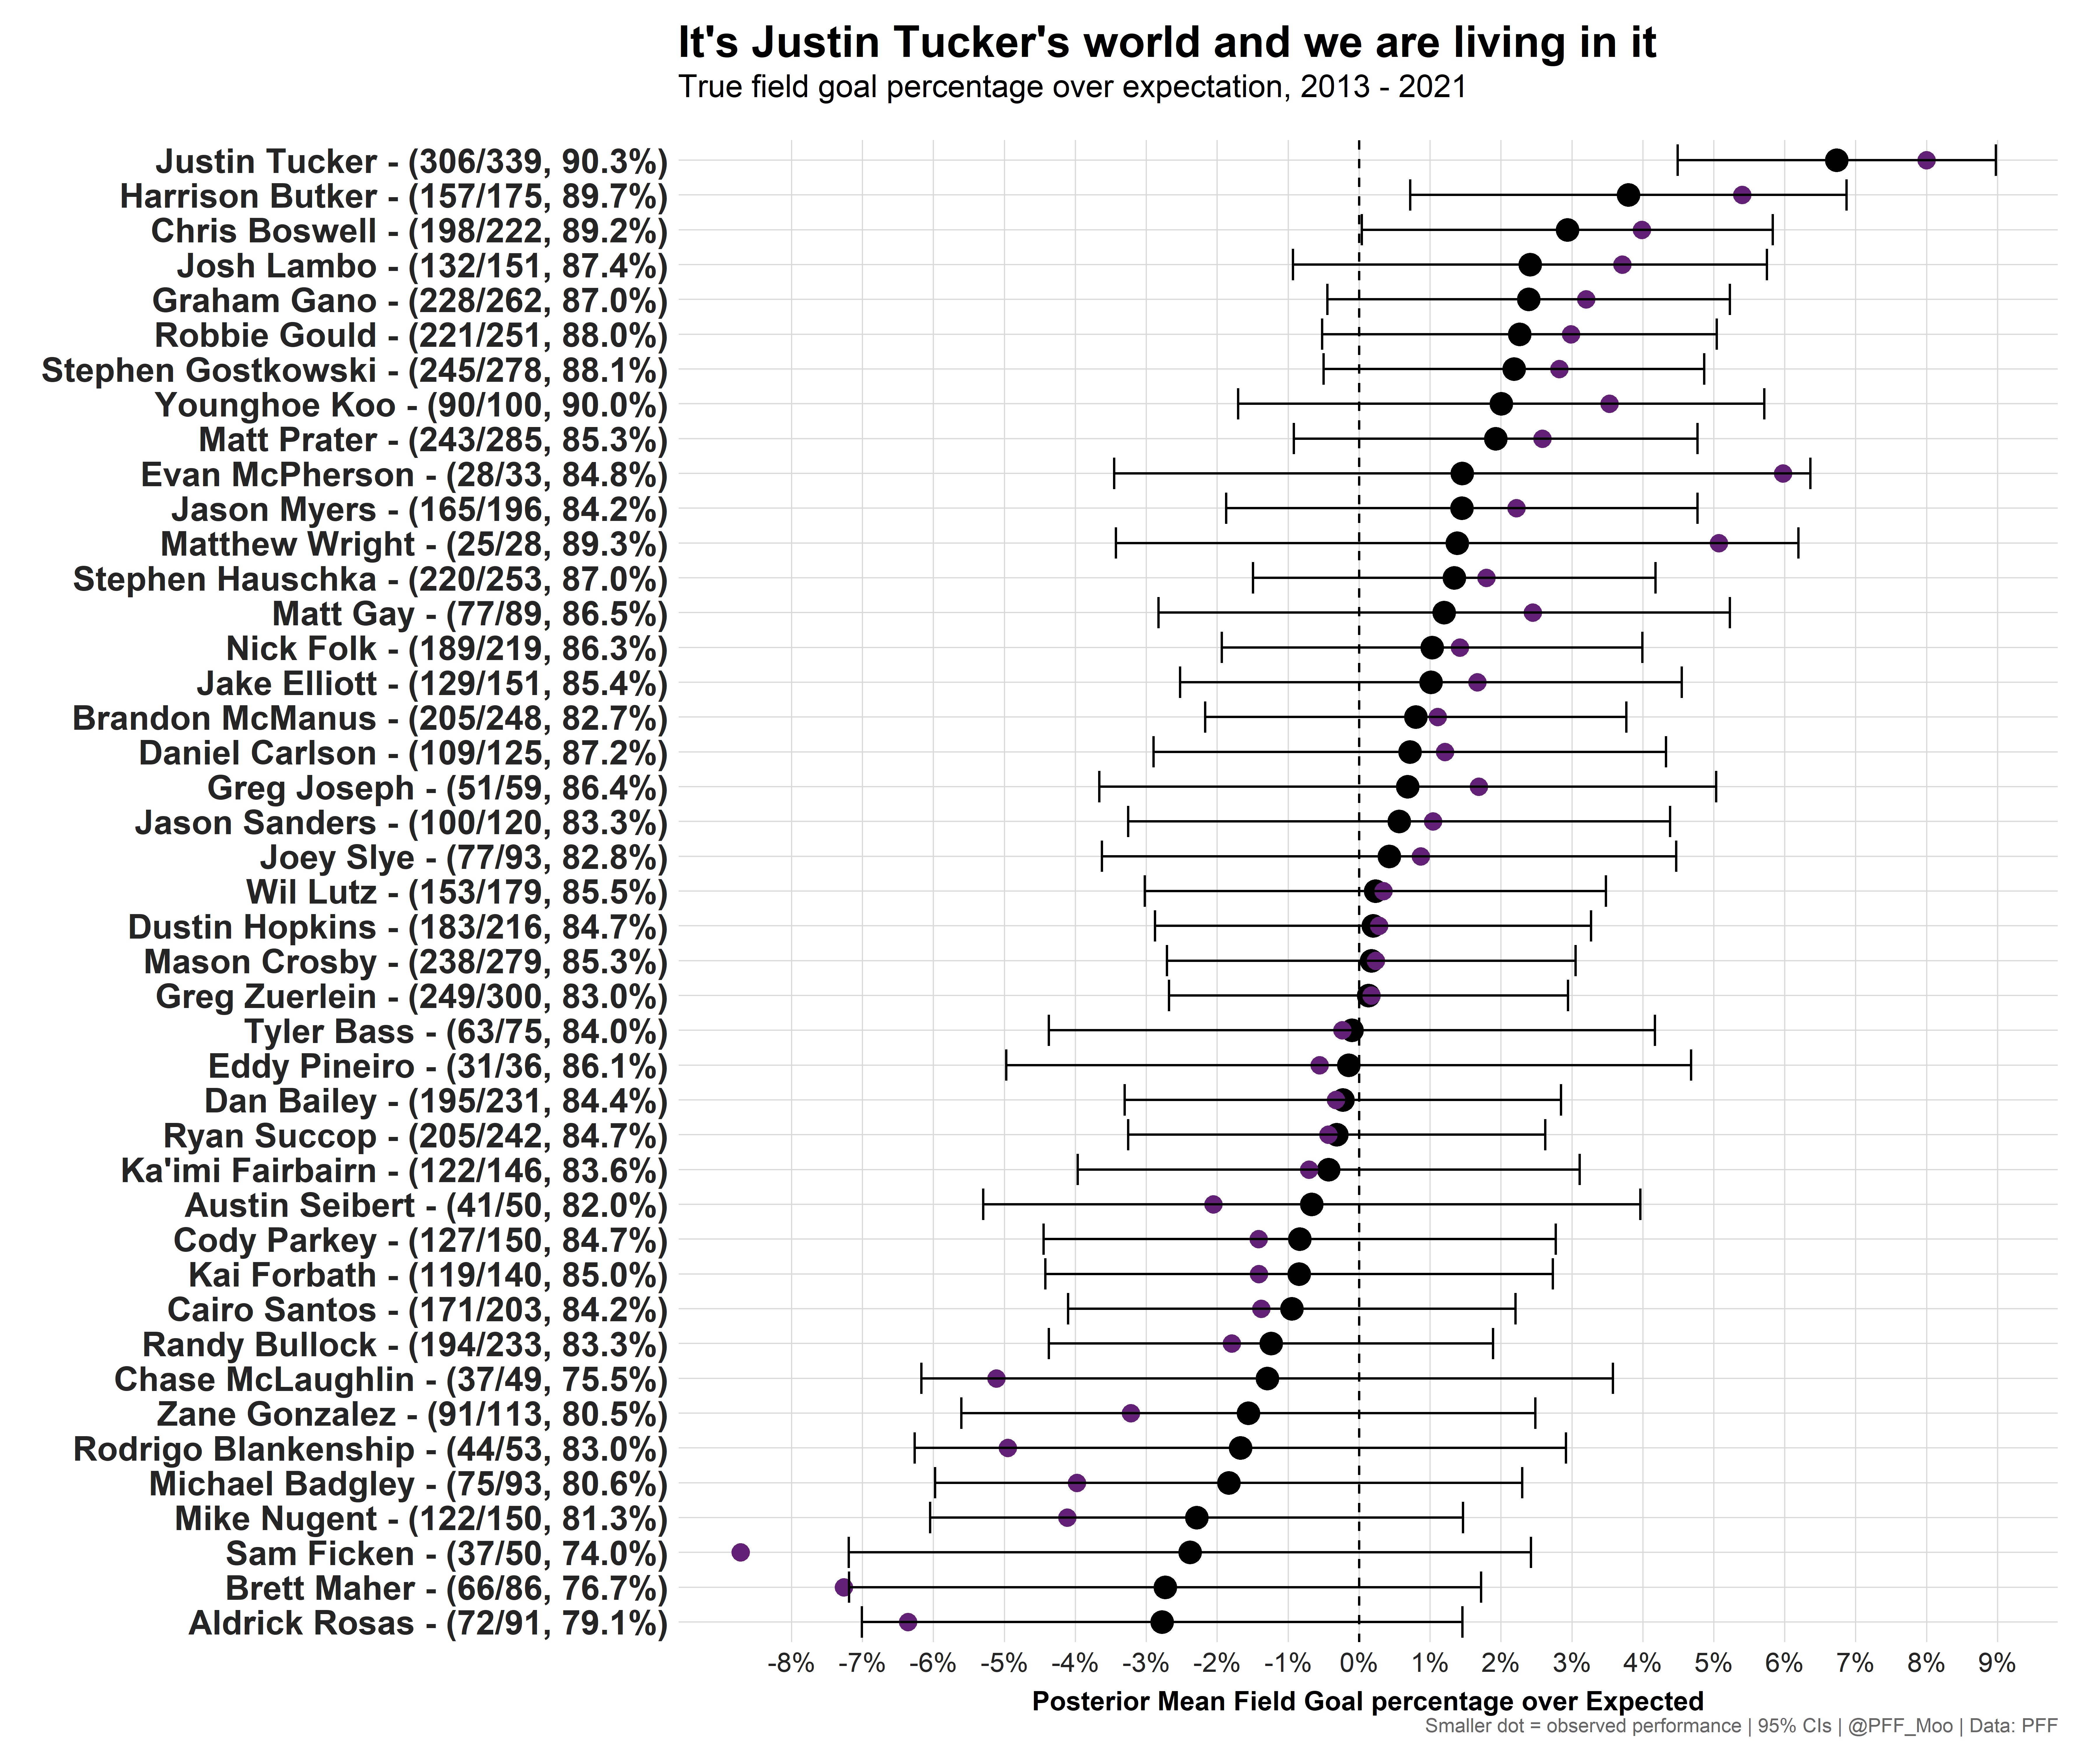
These numbers will be the fundament we use to compute the value of each kicker. However, we still have ways to go.
Value Greatly Depends on the Lengths of Kicks
If we look at the chart above, we notice that we estimate Tucker to be seven percentage points better than an average kicker on field goals, but that obviously cannot mean he is seven percentage points more likely to hit every kick.
An average kicker makes a 30-yard field goal in a dome 96% of the time, so it’s literally impossible to be seven percentage points better. Naturally, to land at an average of seven percentage points over expectation, Tucker actually has to have more than a seven percentage point edge for longer kicks. To compute his — and every other kicker’s — probability to make a given field goal, we train another model that not only uses distance and wind speed as a feature, but also accounts for the estimated skill of the kicker prior to the kick.
