It’s a foregone conclusion for most football observers and betting oddsmakers that Lamar Jackson will be the 2019 NFL MVP. It shouldn’t be a surprise that a quarterback is the leading candidate. Only four of the last 20 awards and one of the last 12 have gone to non-quarterbacks, all of whom were running backs.
This year, the leading MVP contender outside of Jackson and Russell Wilson, with buzz building down the stretch, is Michael Thomas. Some are going as far as calling Thomas’ 2019 one of the greatest wide receiver seasons ever after the New Orleans Saints’ leading wideout broke Marvin Harrison’s 17-year-old receptions record Sunday.
There’s no doubt Thomas is having a great season by most statistical measures, including registering the most non-quarterback wins above replacement since 2017 according to our grades-based calculation. But is Thomas truly having one of the greatest seasons ever?
The public has a tendency to overvalue what is currently happening versus performances of the past. Therefore, the best way to determine how strong of season Thomas is truly having is to gather all the data and line up the best seasons past next to his numbers this year.
Here, we’re going to detail Thomas’ and other top receivers’ numbers according to our PFF grades, raw volume, efficiency (by target or route) and share of team’s total production. Because we’re using PFF-based metrics like grades and routes, the analysis will be limited to the PFF era: 2006-2019.
Grades
In each section, I’ll list Thomas’ numbers at the top and then the top-10 other wide receivers with at least 100 targets (406 total) in the respective season below. The numbers in each cell represent the overall rank of the receiver in that category, then the actual number in parentheses.
| Season | Receiver | Off Grade | Rec Grade | Drop Grade | Fumb Grade |
| 2019 | Michael Thomas | 24 (90.5) | 15 (90.8) | 35 (89.5) | 177 (66.3) |
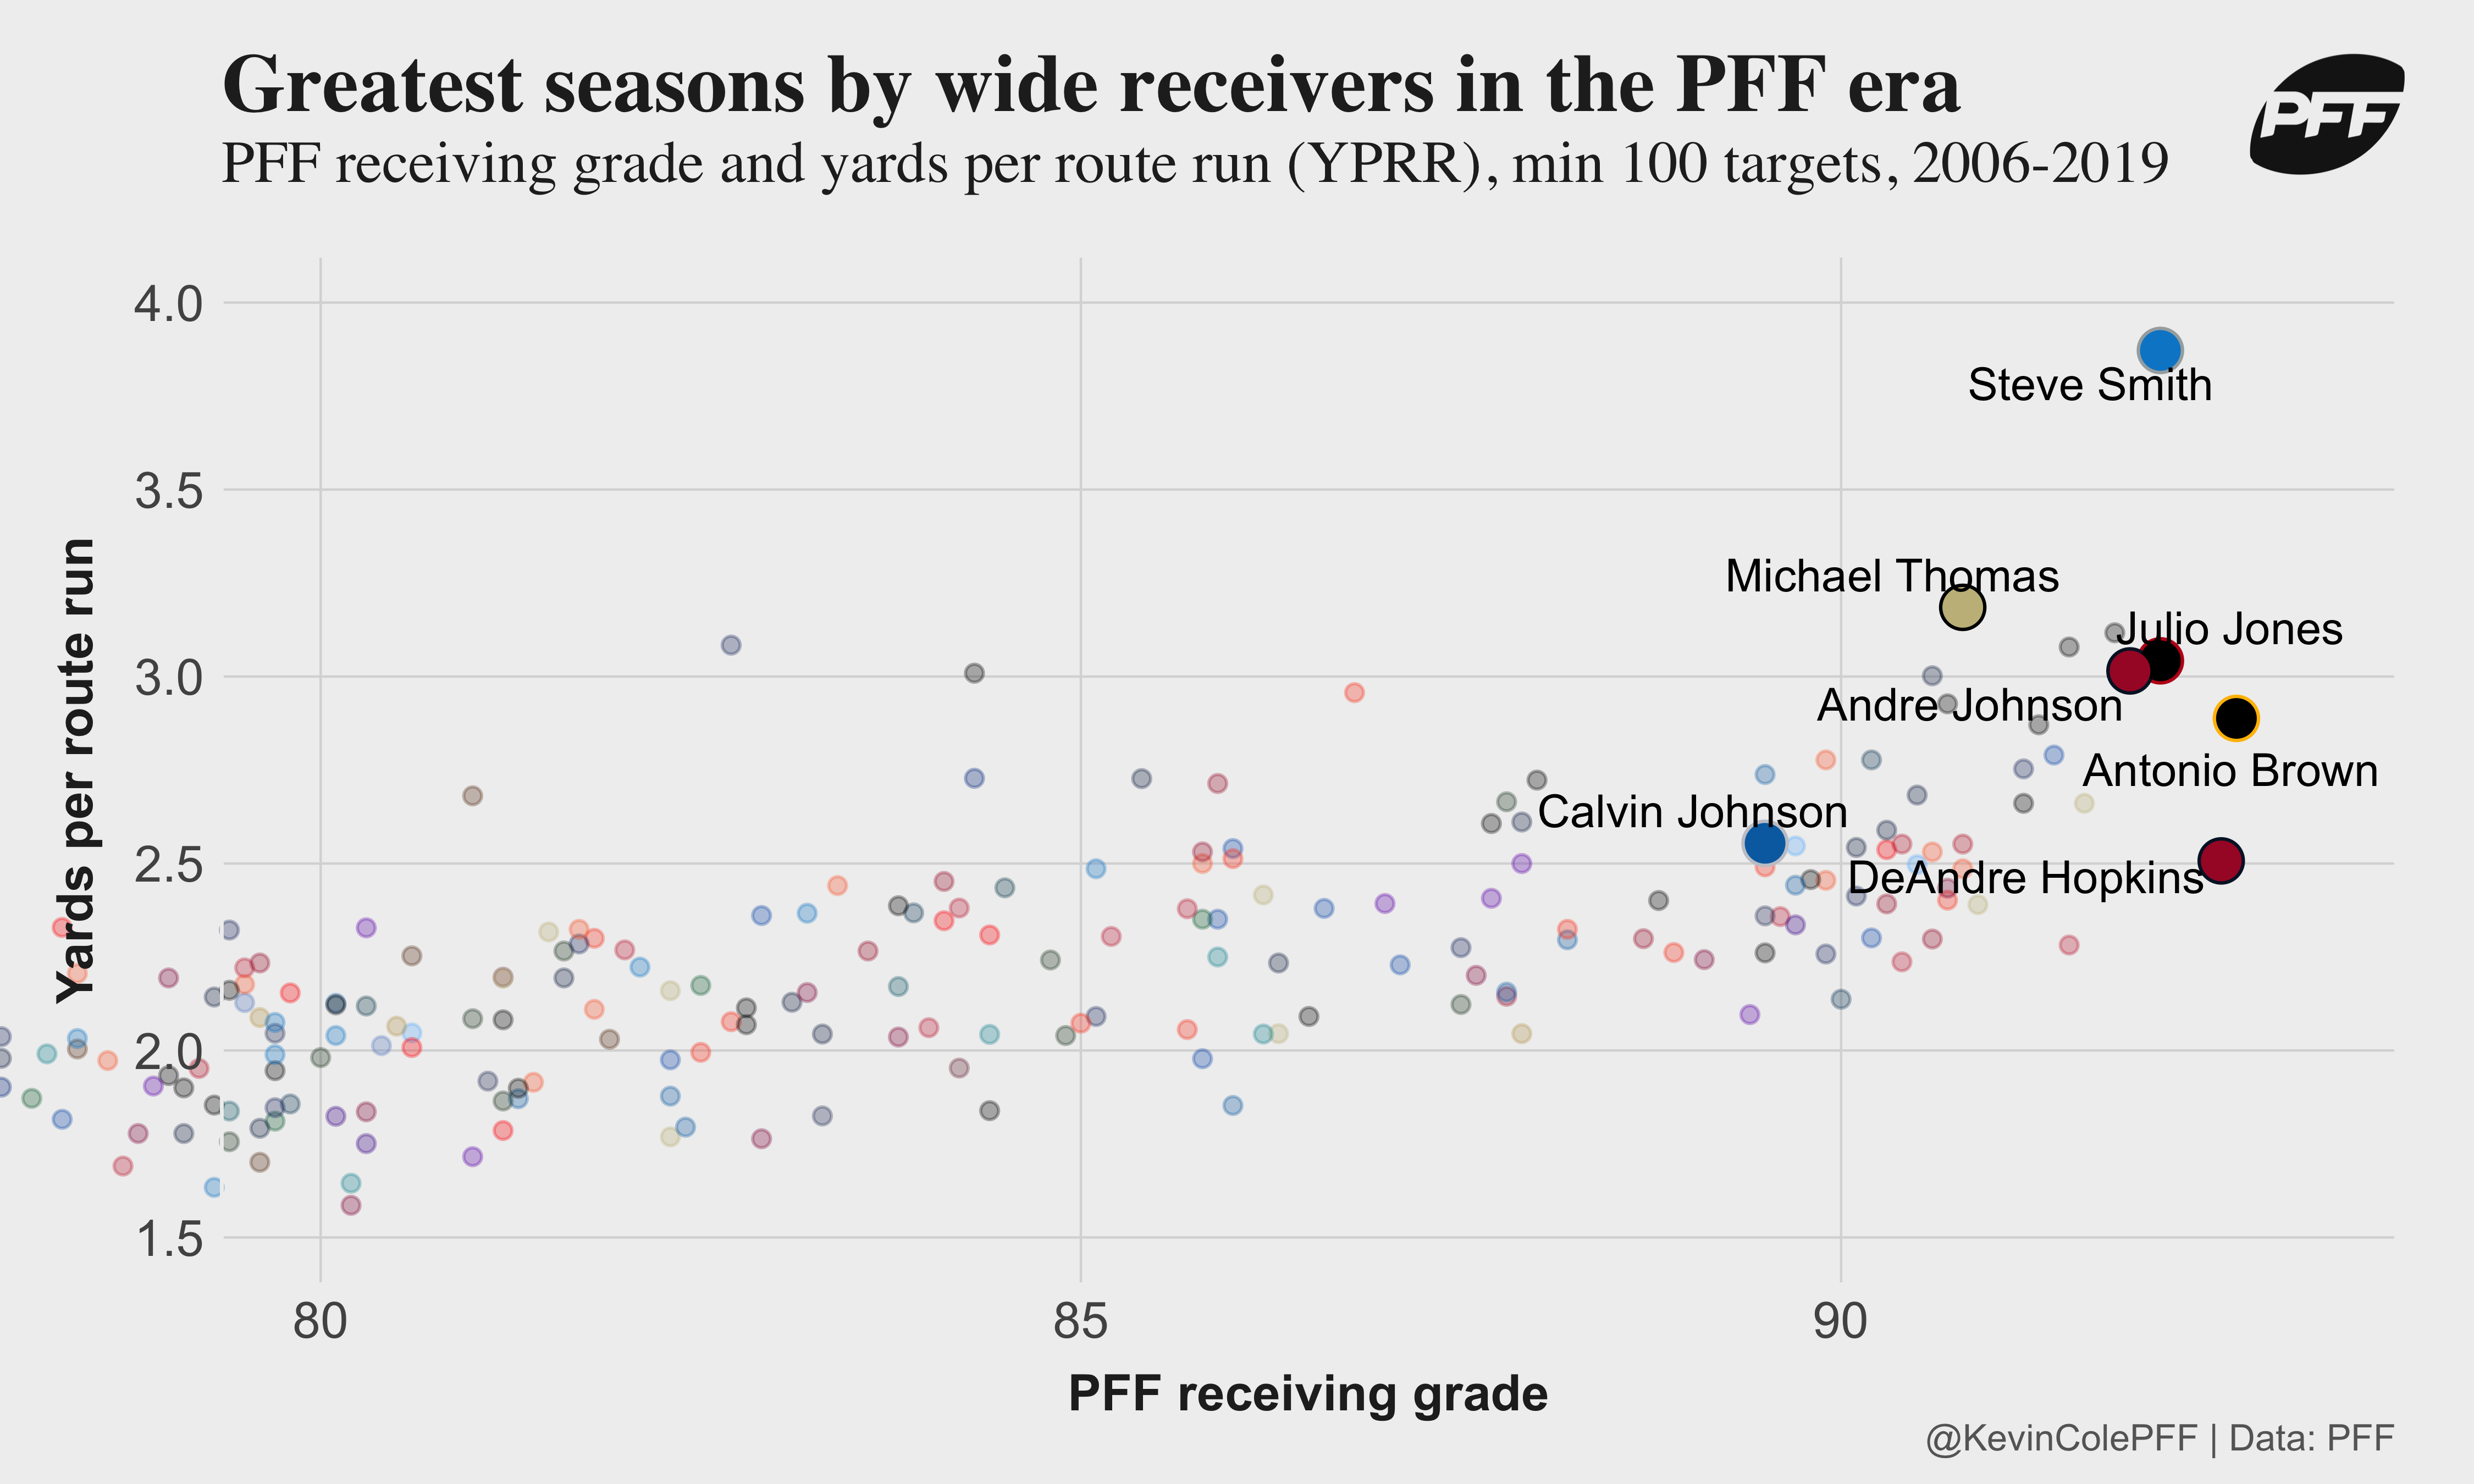
The most relevant grade to measure wide receiver performance is the receiving grade, which is based on route grades. Here are the top-10 seasonal receiving grades since 2006. Antonio Brown posted the best receiving grade for any season in 2015, followed by DeAndre Hopkins last year. Interestingly, Thomas posted a higher receiving game in 2018 (seventh overall) than he has so far this season.
| Season | Receiver | Off Grade | Rec Grade | Drop Grade | Fumb Grade |
| 2015 | Antonio Brown | 1 (92.5) | 1 (92.6) | 11 (90.7) | 241 (55) |
| 2018 | DeAndre Hopkins | 3 (92.4) | 2 (92.5) | 1 (92) | 319 (40.5) |
| 2015 | Julio Jones | 1 (92.5) | 3 (92.1) | 194 (67.7) | 343 (30.4) |
| 2008 | Steve Smith | 4 (91.9) | 3 (92.1) | 283 (57) | 246 (54) |
| 2012 | Andre Johnson | 4 (91.9) | 5 (91.9) | 160 (71.3) | 28 (84.2) |
| 2016 | Julio Jones | 4 (91.9) | 6 (91.8) | 171 (69.8) | 70 (82.4) |
| 2018 | Michael Thomas | 11 (91.3) | 7 (91.6) | 4 (90.9) | 313 (42) |
| 2017 | Julio Jones | 7 (91.7) | 8 (91.5) | 261 (59.3) | 56 (82.8) |
| 2016 | Mike Evans | 7 (91.7) | 8 (91.5) | 202 (66.9) | 43 (83.5) |
| 2007 | Reggie Wayne | 10 (91.5) | 10 (91.4) | 117 (76.9) | 390 (26.2) |
Raw volume
The numbers in this section are all stated per-game to equalize 2019 to prior season, and to avoid penalizing receivers who missed a game or two due to injury or sitting the final game of the season. Again, the columns list the receiver’s rank among all with at least 100 targets since 2006 followed by the per-game stats in parentheses.
| Season | Receiver | Targets | Receptions | Yards | Touchdowns | First Downs |
| 2019 | Michael Thomas | 6 (11.5) | 1 (9.7) | 5 (112.5) | 90 (0.6) | 2 (5.9) |
The top-10 season for raw volume numbers are ordered by yards per game, starting with Calvin Johnson’s record-breaking 2012 season. Johnson season was predicted on historical volume, with the highest per-game totals for not only yards, but also targets and first downs.
| Season | Receiver | Targets | Receptions | Yards | Touchdowns | First Downs |
| 2012 | Calvin Johnson | 1 (12.4) | 7 (7.6) | 1 (122.8) | 280 (0.3) | 1 (5.9) |
| 2013 | Josh Gordon | 23 (10.6) | 71 (6.2) | 2 (117.6) | 61 (0.6) | 34 (4.6) |
| 2015 | Julio Jones | 2 (12.1) | 3 (8.5) | 3 (116.9) | 129 (0.5) | 3 (5.8) |
| 2015 | Antonio Brown | 3 (11.9) | 3 (8.5) | 4 (114.6) | 66 (0.6) | 5 (5.2) |
| 2019 | Michael Thomas | 6 (11.5) | 1 (9.7) | 5 (112.5) | 90 (0.6) | 2 (5.9) |
| 2017 | Antonio Brown | 11 (11.1) | 15 (7.2) | 6 (109.5) | 61 (0.6) | 14 (4.9) |
| 2014 | Odell Beckham Jr. | 20 (10.8) | 9 (7.6) | 7 (108.8) | 2 (1) | 23 (4.8) |
| 2013 | Calvin Johnson | 24 (10.6) | 90 (6) | 8 (106.6) | 17 (0.9) | 14 (4.9) |
| 2014 | Julio Jones | 32 (10.4) | 31 (6.9) | 9 (106.2) | 210 (0.4) | 8 (5.1) |
| 2014 | Antonio Brown | 9 (11.1) | 5 (8.1) | 10 (106.1) | 19 (0.8) | 4 (5.4) |
Efficiency
When reading this section, keep in mind that efficiency stats are fickle and can be misleading. The numbers below are mostly the stat per target. I’ve listed touchdowns, first downs, and drops as percentages of targets. The first figure is yards per route run, a more stable statistic that we at PFF have access to because we know every who is running routes on every play.
| Season | Receiver | YPRR | Yards/Trg | TD (%) | First Down (%) | Drop (%) |
| 2019 | Michael Thomas | 2 (3.2) | 63 (9.8) | 191 (5.2) | 17 (51.7) | 106 (3.5) |
In a year when he wasn’t even named first-team All-Pro, Steve Smith dominated efficiency stats with Jake Delhomme as his quarterback. Smith turned only 129 targets into 1,421 yards.
| Season | Receiver | YPRR | Yards/Trg | TD (%) | First Down (%) | Drop (%) |
| 2008 | Steve Smith | 1 (3.9) | 4 (11.6) | 212 (4.9) | 62 (48) | 325 (7.3) |
| 2019 | Michael Thomas | 2 (3.2) | 63 (9.8) | 191 (5.2) | 17 (51.7) | 106 (3.5) |
| 2016 | Julio Jones | 3 (3.1) | 7 (11.3) | 223 (4.8) | 20 (51.2) | 191 (4.8) |
| 2011 | Victor Cruz | 4 (3.1) | 1 (12.7) | 77 (7.4) | 48 (48.8) | 382 (9.1) |
| 2017 | Julio Jones | 5 (3.1) | 43 (10.1) | 385 (2.1) | 76 (46.9) | 240 (5.6) |
| 2015 | Julio Jones | 6 (3) | 73 (9.7) | 280 (4.1) | 58 (48.2) | 222 (5.2) |
| 2012 | Andre Johnson | 7 (3) | 49 (10.1) | 376 (2.5) | 36 (49.7) | 251 (5.7) |
| 2008 | Roddy White | 8 (3) | 68 (9.7) | 212 (4.9) | 147 (43.7) | 395 (9.9) |
| 2009 | Wes Welker | 9 (3) | 162 (8.8) | 371 (2.6) | 87 (46.4) | 136 (3.9) |
| 2014 | A.J. Green | 10 (3) | 85 (9.6) | 178 (5.5) | 139 (44) | 115 (3.7) |
Team share
Some teams are pass-happier than others, and one way to normalize raw volume stats is to present them as a percentage of a team’s total. Thomas has top-10 share numbers (from 2006-2019) in targets, receptions, yards and first downs this season.
| Season | Receiver | Targets | Receptions | Yards | Touchdowns | First Downs |
| 2019 | Michael Thomas | 8 (33.8) | 3 (36.7) | 6 (40.8) | 199 (27.3) | 4 (41.6) |
While a great receiver, I wasn’t expecting to see Brandon Marshall at the top of this list, especially in such dominating fashion as the share leader in most categories. The 2012 Bears had a narrow passing distribution, and calling Marshall the entire passing game wouldn’t have been far from reality.
| Season | Receiver | Targets | Receptions | Yards | Touchdowns | First Downs |
| 2012 | Brandon Marshall | 1 (39.3) | 1 (41.1) | 1 (45.8) | 7 (52.4) | 1 (46.3) |
| 2015 | Julio Jones | 3 (35.5) | 4 (35.4) | 2 (43.8) | 23 (44.4) | 2 (44.1) |
| 2008 | Steve Smith | 17 (31.6) | 15 (31.7) | 3 (43.2) | 50 (40) | 11 (38.6) |
| 2008 | Calvin Johnson | 12 (32.7) | 48 (28.8) | 4 (42.5) | 1 (66.7) | 13 (38) |
| 2006 | Lee Evans | 6 (34) | 27 (30.6) | 5 (42.4) | 38 (42.1) | 6 (40.2) |
| 2019 | Michael Thomas | 8 (33.8) | 3 (36.7) | 6 (40.8) | 199 (27.3) | 4 (41.6) |
| 2008 | Roddy White | 4 (35.4) | 7 (33.2) | 7 (40.2) | 26 (43.8) | 10 (39) |
| 2012 | Andre Johnson | 29 (30.8) | 17 (31.6) | 8 (39.5) | 322 (18.2) | 12 (38.5) |
| 2013 | Vincent Jackson | 6 (34) | 72 (27.2) | 9 (39.1) | 116 (33.3) | 8 (39.7) |
| 2013 | Josh Gordon | 188 (24.5) | 160 (23.6) | 10 (38.3) | 111 (34.6) | 68 (32.3) |
The best of the best
After digesting all the data, I’ve made a best effort to boil the entire 2006-2019 seasonal database down to the best seasons for the best wide receivers. There isn’t a quantitative formula in the rankings below, more using intuition and the relative statistics.
By my estimation, Julio Jones’ 2015 season was the best that we’ve seen in the PFF era. Jones nearly had the highest receiving grade of all (2nd) and was dominant in the other stat-based category in terms of yards per game, per route run and as a percentage of team total.
| Season | Receiver | Rec Grade | Yards/Game | YPRR | Yards Share |
| 2015 | Julio Jones | 92.5 | 116.9 | 3.0 | 43.8 |
| 2008 | Steve Smith | 91.9 | 101.5 | 3.8 | 43.2 |
| 2019 | Michael Thomas | 90.5 | 112.5 | 3.2 | 40.8 |
| 2015 | Antonio Brown | 92.6 | 114.6 | 2.9 | 38.0 |
| 2012 | Andre Johnson | 91.9 | 99.9 | 3.0 | 39.5 |
| 2018 | DeAndre Hopkins | 92.5 | 98.2 | 2.5 | 30.7 |
| 2012 | Calvin Johnson | 89.5 | 122.8 | 2.6 | 37.7 |
And we can look at these seasons visually in comparison to all receiver seasons with 100 targets since 2006. Smith’s 2008 isn’t viewed as highly as others, and probably isn’t as well-rounded. But being such an outlier in terms of yards per route run puts it in strong consideration for the best ever.
One season left off of the list above that will come to most minds is Randy Moss’ 2007. What’s interesting is that his numbers don’t make the top-10 of grades or the yard-based metrics weighed heavily in this analysis. Moss would have the lowest yards per game, tied for the lowest yards per route run and yard share and the third-lowest receiving grade of any receiver on the above list.
I take no issues with putting Moss at the top of the list due to his touchdown dominance (highest per-game and per-target numbers in the PFF era) and being the leader of one of the greatest team passing seasons ever. It’s only due to the parameters of this analysis that acknowledging him and still keeping him separate.
| Season | Receiver | Rec Grade | Yards/Game | YPRR | Yard Share (%) |
| 2007 | Randy Moss | 90.1 | 93.3 | 2.5 | 30.7 |
I’m placing Michael Thomas’ 2019 behind Jones and Smith, though I wouldn’t argue against making him first. Like most MVP candidacies, Thomas gets a bump for being the perceived best player on a team with a strong record (12-3). Thomas has the additional benefit of proving his relative worth by continuing to dominate while his Hall of Fame quarterback Drew Brees was sidelined for multiple weeks.
