The football season is so short, an analytical fantasy football player would be forgiven for over-relying on historical averages for their future projections. But I built my weekly projection and ranking system to also account for three contextual factors of games in the venue, the weather, and the opponent’s defense, and those adjustments improved the accuracy of my predictions in 2018.
In an effort to build on that success, I compared my projections to realized statistics to look for contextual factors I might have missed, and one such factor was inescapable: The final score margin can tell you a lot about how a game was likely played.
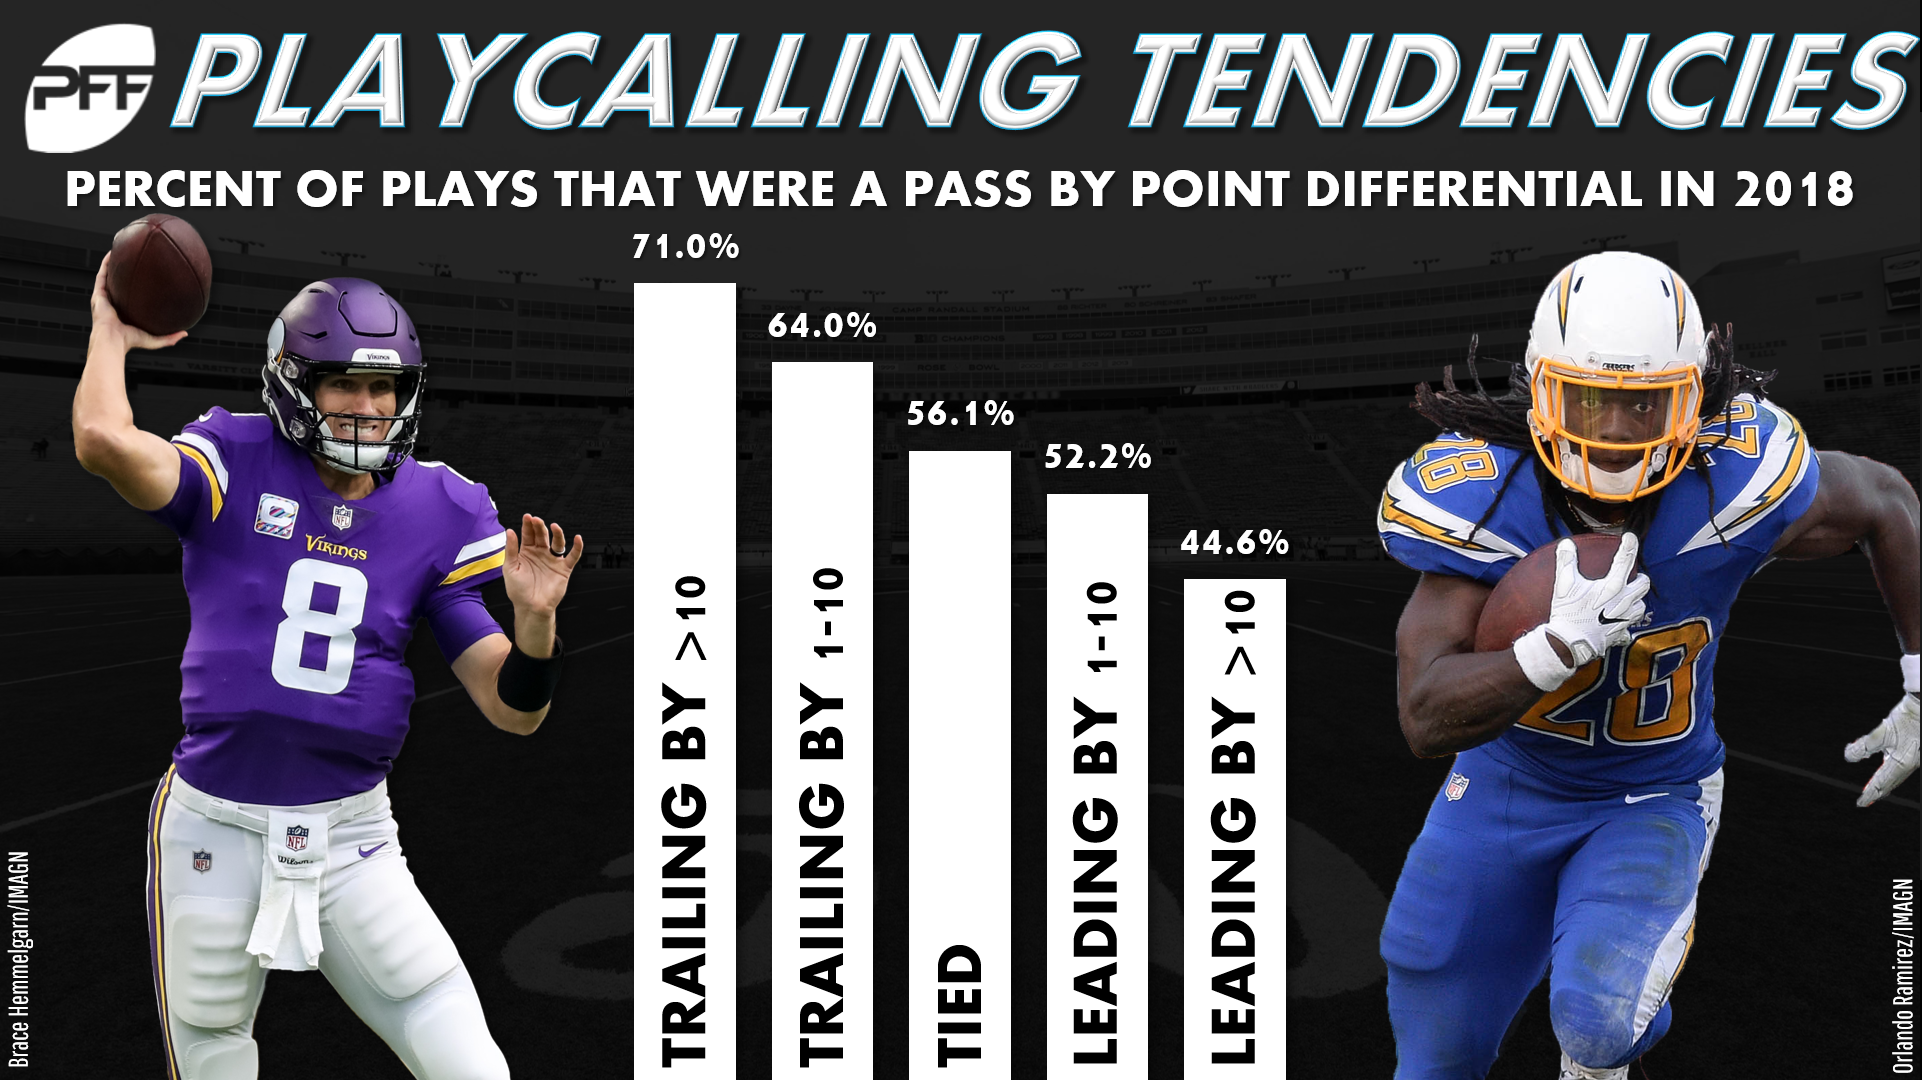
It became clear to me I had overlooked score margin when I looked for patterns in my team play projection surpluses and shortfalls. The teams that won tended to run more and throw less than I projected, and the teams that lost tended to run less and throw more than I projected. In other words, gamescripts influenced pass and run play totals even after I made defensive pace adjustments. And, in fact, it was a lot more. The final score differential correlated with my surplus or shortfall of projected pass attempts with a strength of -0.31, and the final score differential correlated with my surplus or shortfall of projected run attempts with a strength of 0.56.
To improve my team play projections, I clearly needed to project the outcome of their upcoming games. That’s an effort that handicappers can spend years perfecting, but I suspected I could enjoy 90% of their success with just 10% of the effort by relying on simple Elo ratings. Elo ratings in essence produce power rankings by allowing winning teams to “steal” power from the opponents they beat. The bigger power advantage an opponent has, the more a team will steal with a win and the less they will forfeit with a loss.
I started my Elo ratings by assigning every team an 800 rating — my arbitrary neutral rating — in Week 1, 2009. Then, I calculated each team’s new rating every week by summing the ratings of all of the teams they’d played that season and adding it to 400 times their wins minus losses, all divided by their total of games played. Finally, I regressed each team’s rating back toward 800 whenever the calendar flipped over.
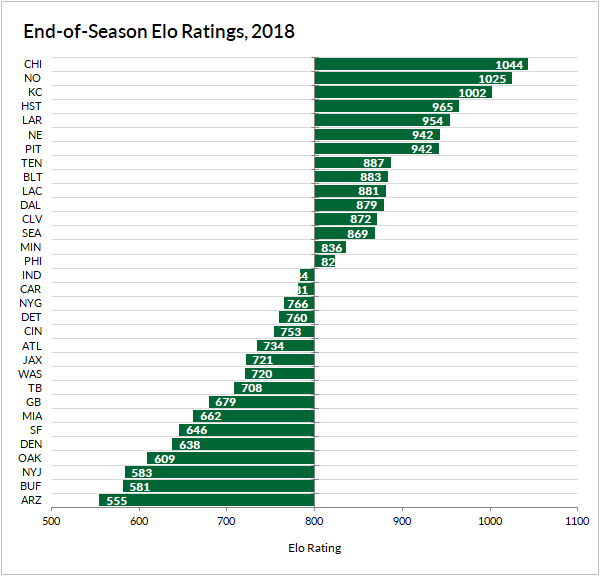
This isn’t an exact science, and your resulting Elo ratings will be different if you rely on different neutral ratings or steal magnitudes or start in a different week. But mine passed the eye test in fairly short order. And by the end of the 2018 regular season, my Elo ratings mirrored the power rankings of most analysts with a fraction of the effort spent.
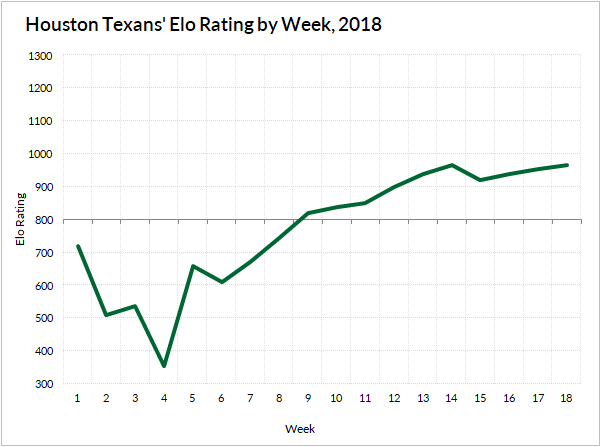
They’re pretty decent even in the early season and flexible to change with teams that over- or underachieve over small samples of games. The Texans fell from their 2018 preseason rating of 720 down to 355 after their consecutive losses to the Patriots, Titans, and Giants to start the season. From there, they steadily climbed up over 900 on the strength of their nine-game win-streak.
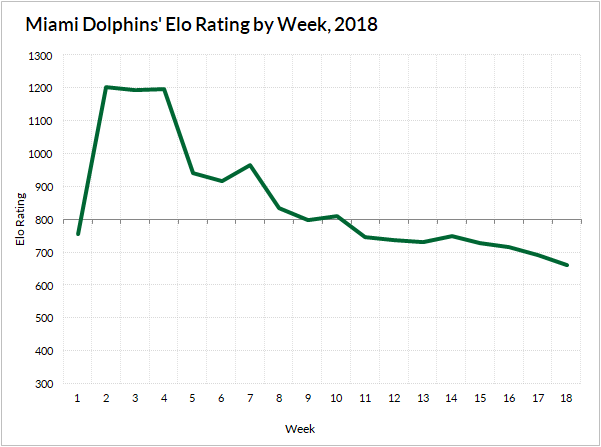
The trajectory of the Dolphins’ 2018 rating was pretty much the opposite. They peaked early after a 3-0 start and slowly declined to a below-average rating of 662 by season’s end.
More than just passing the eye test, the Elo ratings proved to be predictive. The Elo differentials of teams entering a matchup correlated with the final score differential. And when I used those Elo differentials to adjust projected team pass and run plays, they made small improvements to both their correlations and root mean square errors — where lower numbers are better — similar to those made by the venue, weather, and defensive adjustments.
| Correls and RMSEs of My Weekly Play Projections, 2018 | |||||||
| Adjustments | Correl | RMSE | |||||
| Ven | Wea | Def | Elo | Pass | Run | Pass | Run |
| 0 | 0 | 0 | 0 | 0.22 | 0.19 | 8.64 | 7.64 |
| 1 | 0 | 0 | 0 | 0.21 | 0.21 | 8.66 | 7.62 |
| 1 | 1 | 0 | 0 | 0.21 | 0.21 | 8.67 | 7.62 |
| 1 | 1 | 1 | 0 | 0.22 | 0.26 | 8.65 | 7.53 |
| 1 | 1 | 1 | 1 | 0.23 | 0.27 | 8.63 | 7.52 |
I find that to be a really cool revelation since fantasy can so often feel divorced from the things that really matter in football.
