
• PFF Greenline uses a model-based approach to derive game outcomes based on myriad team and situational factors, determining each team's win probability.
• Our win probabilities are then compared to breakeven percentages to define edges. A positive edge is a +EV (expected value) bet.
• Our PFF mobile app takes it a step further, assigning letter grades to a bet based on its edge.
Last updated: Oct. 28, 3:15 p.m.
Estimated reading time: 3 mins

The following is an explanation of how PFF Greenline discovers and defines edges. At the end of each week during the football season, we'll update this story with our biggest betting edges in college or the NFL. Check back frequently for the most profitable betting opportunities, also updated daily and available with our NFL Schedule, odds and early bets.
College Football Week 10: Top PFF Greenline NCAA Edges
• Tulane-Tulsa — Tulsa moneyline (4.7%)
• Middle Tennessee-Louisiana Tech — Under 63 (4.2%)
• Oregon-Colorado — Under 63 (4.2%)
• Hawaii-Fresno State — Under 62 (4%)
• Houston-SMU — Under 66 (4%)
A $20 BET ON A FIVE-LEG PARLAY (+4416) WOULD NET $903.27 AT BETMGM
The typical sports bettor starts out by wagering for or against their favorite team. No sophisticated approach is taken — they simply evaluate the bets they want to make based on feel.
The evolution continues with finding and tailing other people or tools the bettor deems worthy of following blindly. This can be a betting influencer on Twitter or a tool such as PFF Greenline.
Greenline operates similarly to a few other public-facing prediction systems, using a model-based approach which derives its own outcome for the game based on various team and situational factors. At the end of the process, Greenline spits out a probability for how likely each team is to win.
Let’s start with an example:
Week 8 of the 2022 season includes the slightly underwhelming Tennessee Titans visiting the Houston Texans. Questions linger about the status of Ryan Tannehill’s injured ankle — will be able to play, and if so, how effective can he be? For numerous reasons, the market moved in the Texans' direction and has them at +108 on the moneyline, where, conversely, the Titans are -130.
We can convert both of these numbers into percentages using simple math or an odds calculator. To convert american odds:
Positive odds: 100 divided by (the odds plus 100), multiplied by 100 gives a percentage e.g. odds of 108 = (100 / (108 + 100)) * 100 = 48%.
Negative odds: Multiply the odds by -1 and use the positive value in the following formula: odds divided by (the odds plus 100), multiplied by 100 to give a percentage. odds of -130 = (130/(130+100)) * 100 = 56.5%.
This is the breakeven percentage shown by PFF Greenline for every type of bet, based on its current price. So if there’s an even price on both sides of -110, we would show 52.4% Breakeven.
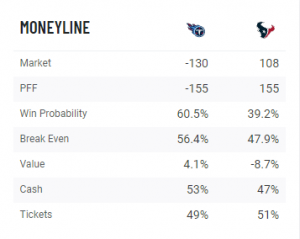
PFF Greenline modeling takes the factors prior research has found to be predictive for the outcome of the games and runs some machine-learning models to derive its own Win Probability for every game.
We can then take that Win Probability and compare it to the Break Even probability. So in our example, PFF Greenline has the Titans' Win Probability at 60.5%. When compared to the 56.4% Break Even percentage, there is a positive 4.1% difference, which we would call the value or edge on Tennessee. This is a positive expected value bet and one we should place based on PFF Greenline’s outlook for the game.
The PFF mobile app takes this one step further and — instead of showing the value/edge percentage —assigns a grade to each bet. Using this approach, we can build a quick rubric we use to assign the grade for each bet based on PFF’s edge value.
| Edge/Value | Grade |
| >= 2.5% | ~ A |
| >= 0.5% & < 2.5% | ~ B |
| >= -0.5% & < 0.5% | ~ C |
| >= -2.5 & < -0.5% | ~ D |
| ~ F |