
“Getting off to a hot start” is often cited as a goal. This makes a lot of sense intuitively, as the team that leads after the first quarter wins the game almost 75% of the time.
However, football is a very noisy game. It’s one thing to say that “if x happens, then y will happen.” It’s another thing entirely to say, “we have a significant amount of evidence to say that x will happen, given z.”
Over the course of the season, I’ve been tweeting out graphics about how teams have done on what I am defining as “scripted” plays. Hall of Fame head coach Bill Walsh was famous for scripting the first 15 plays of each game — a tactic he passed on to the members of his coaching tree, members of which are still roaming the sidelines in today’s game.
Offensive performance during “scripted” plays during the first 16 weeks of the season. Article about this tomorrow on https://t.co/tc0yelGgUG pic.twitter.com/Ob69SNSlpm
— Eric Eager ???????? (@PFF_Eric) December 26, 2019
In this article, I want to look into whether there is any predictive power in these splits. The first thing I did was look at how stable the first half (eight weeks) of the season was at predicting the last half of the season and compare that to non-script and full-game stats. Then, I looked at how these numbers predicted first-quarter points scored by a team and its opponent, since such markets are considered softer than full-game-totals markets in the betting space.
Stability of Metrics on Scripted Plays
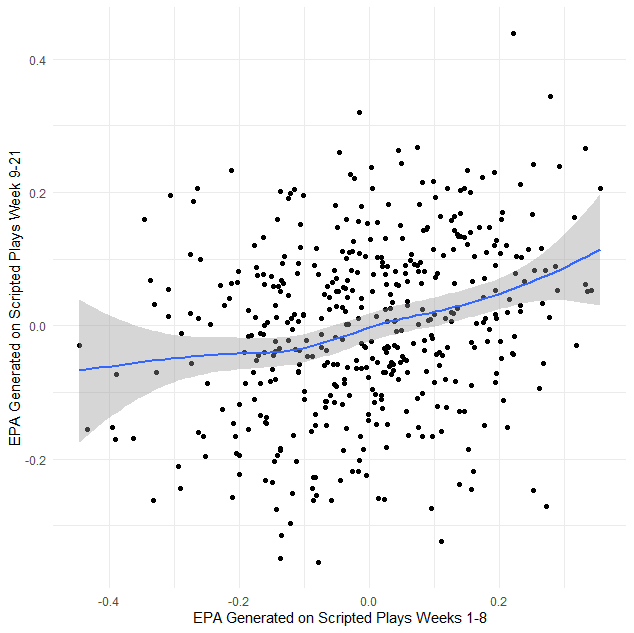
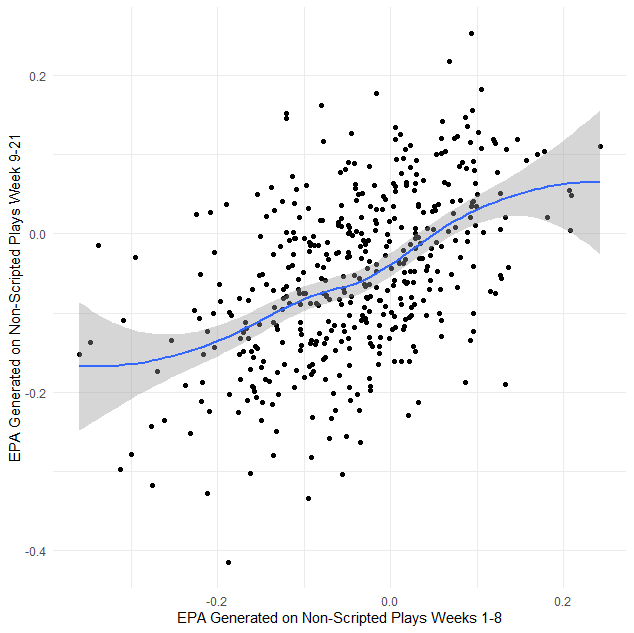
As with almost any proper subset of a full data set, a team’s ability to produce or prevent expected points on scripted plays is less stable and predictive than said ability on all plays. It’s also fairly straightforward to expect that non-scripted plays would be more predictive than scripted plays since there are roughly three times as many of them over the course of a season.
And this is what we find. Using the aforementioned first half/second half splits, offensive efficiency on scripted plays in the first half of the season correlated with that from the second half of the season at a rate of 0.26 (success rate was 0.27). EPA allowed on defense correlated at a rate of only 0.16 (0.13 for success rate). EPA on non-scripted plays was far more stable in both respects (0.51 and 0.29, respectively) and rivals that of EPA overall (0.57, 0.313).
Predictive Power of Metrics on Scripted Plays
So, there’s some signal in how teams perform early in games, but this signal is dwarfed by that of how well they play outside of scripted plays and overall.
Another question we could ask is, “how is scripted-play success predictive of things we care about, like the number of first-quarter points (you can bet on these things)?” Do to so, we aggregated a team’s overall EPA and EPA on scripted plays — both for and against — and used a gradient boosting tree to determine which of these variables predicted first-quarter points (instead of using regression, we used classification since most first quarters end with 0, 3, 7, 10, 14, etc. points).
The variable importances for overall offensive and defensive EPA were more than 10 times that of either during scripted plays. Hence, if you want to wager on first-quarter totals, just ask yourself how good the two teams are offensively and defensively (when it comes to EPA-related variables), weighing your prediction heavily towards offense. Our friend Chase Stuart again wins with the “splits happen” fade on promising (but eventually just noisy) subsets of data.
Scheme
A fair question to ask is if scheme can help us predict early-game scoring. In our article on Lamar Jackson, we discussed a way to look at scheme that essentially asks the question, “how much different are you than other teams?” So, can some measure of this distance give someone an edge when looking at early-game markets?
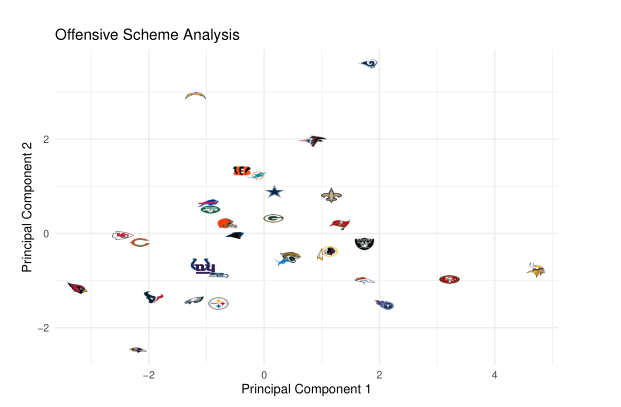
The first two principal components of each team’s offensive scheme data through 16 weeks of the 2019 season. Teams further away from the (0, 0) origin are more unique.
Using data from 2014-present (the earliest date where we have all scheme-related data), we measured how different each offensive and defensive play-caller was for the last year-plus and used that as a feature in our aforementioned gradient boosting tree model. We found that the offensive scheme variable is the second-most important variable in terms of predicting points scored in the first quarter of games, with variable importance roughly half that of a team’s overall EPA per play leading up to that game and three times that of the offense’s scripted EPA per play.
Interestingly, the defensive scheme variable is not very important in predicting first-quarter points, and defensive variables, in general, are rendered less important with the inclusion of the offensive scheme.
Conclusion and Future Direction
While it's a fun way to look at what has happened during the course of the season, performance on “scripted” plays is not as stable or predictive as to how well a team performs during the duration of a game. Digging deeper into the source of early-game success, though, reveals an interesting nugget: How unique a team’s offensive scheme is can help predict first-quarter scoring, even after accounting for how good a team is at moving the football.
While our approach to modeling scheme is new, and will likely be updated with new features as they are discovered, it appears to have borne fruit. The 2019 NFL season has been the season of coaching, and this is no exception.
